Abstract
Iron oxide nanoparticles present a promising alternative to conventional energy deposition-based tissue therapies. The success of such nanoparticles as a therapeutic for diseases like cancer, however, depends heavily on the particles’ ability to localize to tumor tissue as well as provide minimal toxicity to surrounding tissues and key organs such as those involved in the reticuloendothelial system (RES). We present here the results of a long term clearance study where mice injected intravenously with 2 mg Fe of 100 nm dextran-coated iron oxide nanoparticles were sacrificed at 14 and 580 days post injection. Histological analysis showed accumulation of the nanoparticles in some RES organs by the 14 day time point and clearance of the nanoparticles by the 580 day time point with no obvious toxicity to organs. An additional study reported herein employs 20 nm and 110 nm starch-coated iron oxide nanoparticles at 80 mg Fe/kg mouse in a size/biodistribution study with endpoints at 4, 24 and 72 hours. Preliminary results show nanoparticle accumulation in the liver and spleen with some elevated iron accumulation in tumoral tissues with differences between the 20 nm and the 110 nm nanoparticle depositions.
Keywords: iron oxide, magnetite, magnetic, nanoparticle, hyperthermia, biodistribution, in vivo
1. INTRODUCTION
Research on the use of magnetic iron oxide nanoparticles for cancer imaging and therapy has gained momentum in recent years. When placed in an alternating magnetic field (AMF) of specific frequency range and strength, magnetic iron oxide nanoparticles release energy though hysteresis loss observed on a global scale as heat deposition in the surrounding medium. These nanoparticles differ from superparamagnetic iron oxide nanoparticles used for magnetic resonance imaging in their higher specific absorption rate (SAR) and therefore ability to deliver a greater energy dose.1 The nanoparticles’ scale allows for the potential to deliver a site-specific hyperthermic dose of energy to single cells or sub-cellular structures. This size-based specificity afforded by nanoparticle hyperthermia improves upon conventional methods of hyperthermia therapy, where heat delivery often has poor therapeutic distinction between normal and tumoral tissues.
In order for such a therapy to succeed, however, iron oxide nanoparticles must be localized within cancerous tissue at concentrations and distributions sufficient for a cytotoxic treatment. Additionally, nanoparticles must present low short and long term toxicity. Directly injecting nanoparticles into tumor tissues show therapeutic promise in some local tumor treatment situations.2 The reticuloendothelial system (RES) largely influences the overall biodistribution of nanoparticles administered intravenously with the majority ending up in the liver and spleen due to relatively larger vessel fenestrations.3,4,5,6,7
Clearance studies on non-SAR-optimized nanoparticles for imaging shows a complete clearance of particles from major organs by 100 days post-injection with no observable lasting toxicity.8,9 Size and surface coating characteristics ultimately determine tissue deposition of intravenously-administered of nanoparticles.10,11 Studies have indicated that smaller (20 nm or less in diameter) nanoparticles have better tumor tissue penetration.12, 13 Smaller particles also tend to stay in circulation longer since larger nanoparticles are more readily sequestered by Kupffer cells in the liver.12 Iron oxide nanoparticles of smaller size, however, tend to possess poorer heating capability due to predominantly superparamagnetic crystal cores.1
In these studies, we present the results of a long term clearance study with SAR-optimized iron oxide nanoparticles of 100 nm average hydrodynamic diameter. Also shown are preliminary results from a biodistribution study with 110 and 20 nm hydroxylethyl starch-coated iron oxide nanoparticles with whole organ iron analysis.
2. METHODOLOGY
2.1 Mice used for study
Female C3H mice from either The Jackson Laboratory (Bar Harbor, Maine 04609 USA) or Charles River Laboratories (Wilmington, MA 01887 USA) between the ages of 6 and 10 weeks were employed in these studies. All mice were handled according to approved Dartmouth Institutionalized Animal Care and Use Committee protocols. The age of mice put on study remained constant among each experiment and associated control. For tumor-bearing mice, 106 cells/100 μl of MTGB syngeneic mouse mammary adenocarcinoma was implanted in the right subcutaneous flank. Tumors were measured every other day with calipers in three dimensions and the volume calculated according to the formula for an ellipsoid. Tumor-bearing mice were placed on study when tumors reached a diameter of 150mm3 ± 40 mm3.
2.2 Particles used for the studies
All nanoparticles used for these studies were purchased from Micromod Partikeltechnologie GmbH (18119 Rostock-Warnemuende, GERMANY). For the clearance pilot study, nanoparticles were magnetite core, dextran-coated with 110-120 nm average hydrodynamic diameter. For the size-distribution study, the two particle types were 9.6 mg Fe/ml with iron accounting for about 40% of the total mass of each type, magnetite core hydroxyl-ethyl starch-coated and 110 nm and 20 nm average hydrodynamic diameter respectively. The 20 nm particles from this study contained superparamagnetic cores.
2.3 Long term clearance study
For the clearance study, non-tumor-bearing mice were anesthetized briefly using isoflurane and a dose of nanoparticles at 2 mg Fe/mouse was administered normalized to 250μl volume via tail vein injection. Equal volume of phosphate-buffered saline (PBS) was administered to controls. A total of eight mice was placed in each nanoparticle group and four in each PBS control group. Mice were sacrificed at 14 or 580 days post-injection with spleen, liver, lungs, heart, kidney and brain harvested and formalin-fixed for histological analysis. Organs were blocked together, cut and serial sections were stained using hematoxylin and eosin (H&E); and Prussian blue and nuclear fast red respectively. Slides were visualized on a confocal microscope at 40X magnification. Eight images of non-overlapping areas of each organ of each mouse were taken for image quantification analysis after white-balancing the field of view for each slide.
2.4 Image Processing
Post-acquisition, all Prussian Blue-stained organ images were loaded into MATLAB (MathWorks, Natick, MA 01760 USA). Iron-stained pixels were identified by calculating the Euclidian distance of each pixel to an average iron-stained RGB value given from a Prussian Blue iron-stained control slide. Iron-positive pixels were counted if the distance fell above a vector threshold constant which was qualitatively determined by analysis of the iron control slide. Iron-positive regions were segmented and visually inspected for obvious artifacts. The percentage of iron-positive pixels over the entire field of view was then calculated and averaged over all eight images per organ per mouse.
2.5 Short term size/distribution study
For the size/distribution study, tumor-bearing mice were briefly anesthetized with isoflurane and a dose of 80 mg Fe/kg body weight was administered intravenously (IV) via the jugular vein. At 4, 24 or 72 hours post-injection mice were given 5 units of heparin (1000 USP units/ml from Hospira, Inc., Lake Forest, IL 60045 USA) intraperitoneally, followed in 10 minutes by anesthetization with isoflurane and a clean whole blood sample taken via intracardiac blood draw. Each mouse was then perfused completely with iron-free distilled water to decrease noise in the iron analysis due to varying levels of heme by removing the blood. Whole lungs, liver, kidneys, spleen and tumor tissues were collected in pre-weighted conical tubes for ICP-MS analysis. Tubes containing samples were post-weighed to determine the mass of each sample
2.6 Inductively Coupled Plasma Mass Spectrometry (ICP-MS) digestion protocol
Tissues were digested in a 1:3 volumetric mix of trace metal-grade hydrochloric acid to nitric acid. Digestions were incubated at 70°C for up to 12 hours until it appeared all tissue had gone into solution. Tubes were weighted post-digestion to determine the mass of the final digested sample. All samples were then sent to the Trace Metal Analysis Core Facility at Dartmouth College for ICP-MS analysis using an Agilent 7500cx in collision mode with He. Iron concentrations in mg Fe/kg sample are reported from the results and iron concentrations per sample mass are calculated by determining the total iron content of each sample tube and dividing by the mass of each sample.
3. RESULTS
Seven of the nanoparticle dose mice were studied at the 580 day time point. The results from these mice were compared against 14 day control mice with a PBS dose. Histological assessment (H&E) of the spleen and liver from the 14 day nanoparticle mice showed some particle deposition with modest vacuolization in the liver. However, the assessment of hepatic enzymes at this time did not demonstrate hepatocellular damage. Analysis of the 580 day H&E slides mice showed no significant difference in histology from the 14 day control set as well as a disappearance of the particle clusters from the spleen and liver as was witnessed at 14 days.
Image quantification of the heart, brain and lung showed no significant difference in mean percent iron content (pixels) for either the 14 day or the 580 day groups when compared to the 14 day control. Results for the liver, kidney and spleen are shown below.
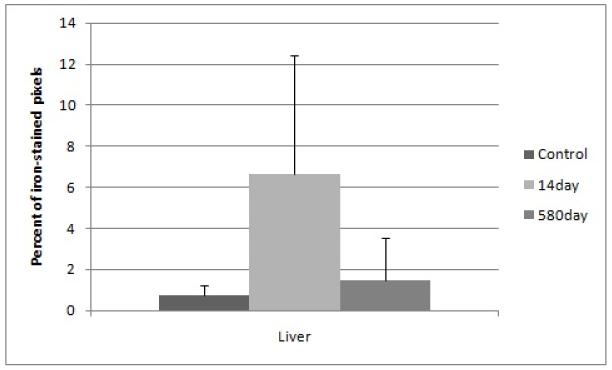
The variation in iron staining of the 14 day nanoparticle liver images (Figure 1) may be the result of a non-homogeneous nanoparticle distribution throughout the tissue where areas around vasculature received large amounts of particles and therefore high staining and other areas had staining levels closer to background. The mean of the 14 day nanoparticle liver samples was still much higher (3X) than that of the 580 day nanoparticle or the 14 day control groups; however the propagated standard deviation did not afford statistical significance between it and either of the groups.
Figure 1.
Percent of iron-stained pixels in liver tissue with standard deviation error bars. Elevated iron is seen in the 14 day nanoparticle group although error bars showed high variability. The y-axis is calculated from histological image quantification on 8 area-distinct images at 40X magnification of the Prussian Blue-stained tissue, averaged from a minimum of three mice per group.
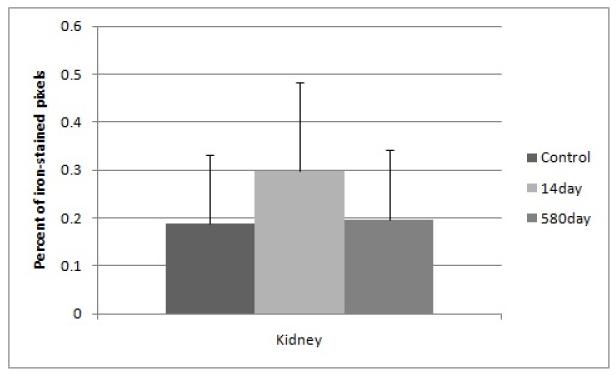
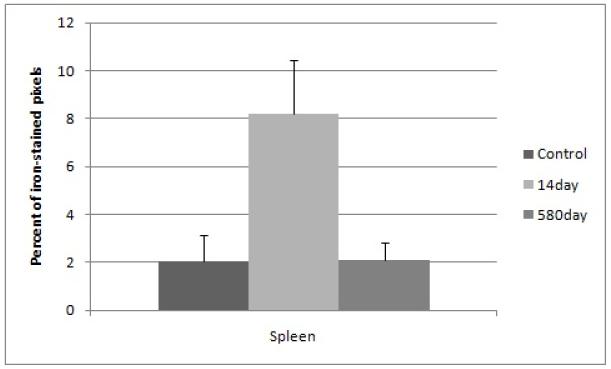
Kidneys overall did not show a significant difference in mean percent iron content (Figure 2). Splenic iron staining was significantly higher (4X) in the 14 day nanoparticle group as compared to the 14 day controls (Figure 3). In the 14 day controls and the 580 day nanoparticle samples there was no significant difference (Figure 3).
Figure 2.
Percent of iron-stained pixels in kidney tissue with standard deviation error bars. No significant difference is detected between all groups. The y-axis is calculated from histological image quantification on 8 area-distinct images at 40X magnification of the Prussian Blue-stained tissue, averaged from a minimum of three mice per group.
Figure 3.
Percent of iron-stained pixels in kidney tissue with standard deviation error bars. Significantly elevated iron (4X) is seen in the 14 day nanoparticle group and no significant difference is detected between the 14 day control and the 580 day nanoparticle groups. The y-axis is calculated from histological image quantification on 8 area-distinct images at 40X magnification of the Prussian Blue-stained tissue, averaged from a minimum of three mice per group.
Results from the size/distribution study are shown below.
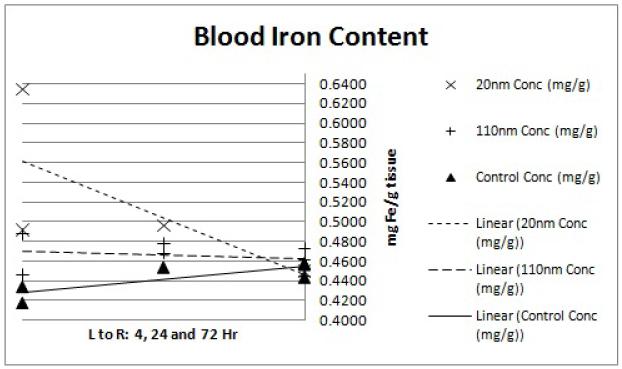
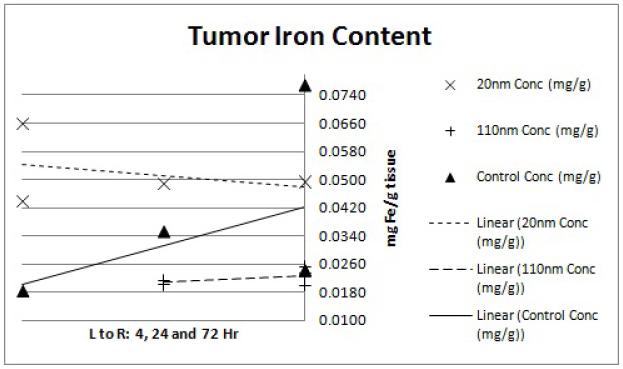
Variation in the ICP-MS results for each point was very tight; average values are reported for all points (Figures 4-9). The tumor preliminary data (Figure 9) does not contain a 4hr 110nm concentration mouse value as the sample was lost during processing. Additional mice currently on study will help to clarify this time point. The tumor data also showed an unusually high control tissue iron concentration at the 72hr time point. This is most likely due to excess blood or blood clots remaining near the mouse from the perfusion which may have associated with the tumor tissue at the time of harvest.
Figure 4.
ICP-MS blood iron content. Each point represents the determined iron concentration of a sample from a single mouse. Linear regression trend lines were fitted to each nanoparticle size group (20nm, 110nm and water control) to observe the preliminary trends in concentration data. The x-axis shows the 4, 24 and 72hr time points from left to right while the y-axis shows ICP-MS-determined iron concentration of the tissue sample in mg Fe/g tissue weight.
Figure 9.
ICP-MS tumor iron content. Each point represents the determined iron concentration of a sample from a single mouse. Linear regression trend lines were fitted to each nanoparticle size group (20nm, 110nm and water control) to observe the preliminary trends in concentration data. The x-axis shows the 4, 24 and 72hr time points from left to right while the y-axis shows ICP-MS-determined iron concentration of the tissue sample in mg Fe/g tissue weight.
4. DISCUSSION
The results of the clearance study suggest that intravenously-administered dextran-coated 100 nm iron oxide nanoparticles are cleared primarily by the spleen and liver and are no longer present at 580 days.16 Normal iron concentrations in these organs have been known to change over the lifespan of the mouse, so it is not unreasonable that the liver and especially the spleen would display higher average iron concentrations with age.14 The long lifespan of the nanoparticle-dosed mice coupled with histological assessment of the 580 day samples also suggests 2 mg Fe/mouse did not result in any observable health effects or abnormal tissue iron concentrations.
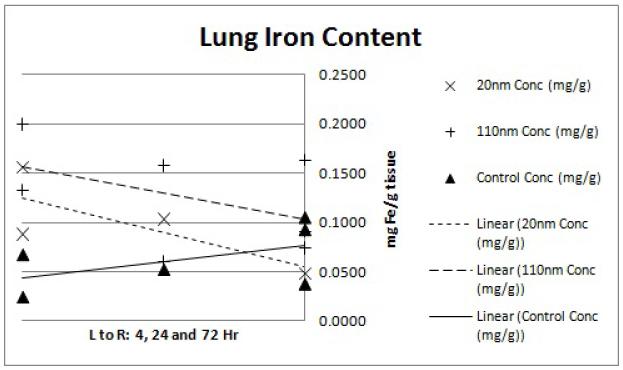
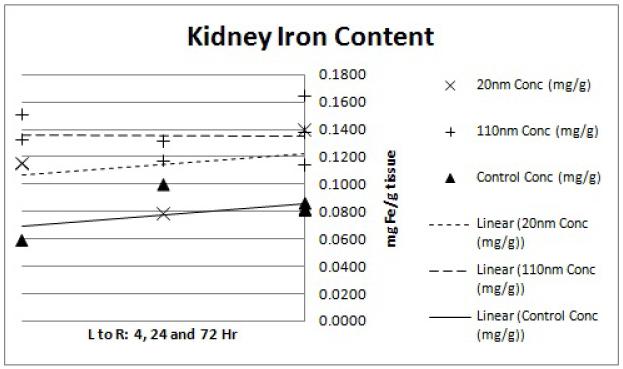
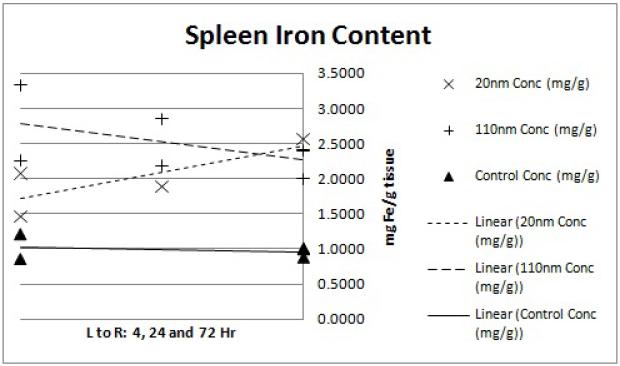
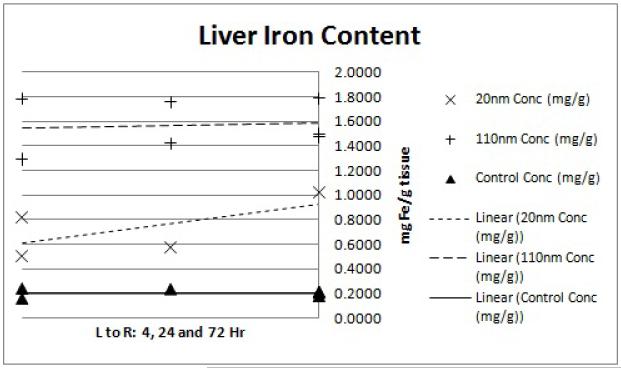
Pilot size/distribution study results demonstrate that the smaller (20 nm) nanoparticles have lower liver uptake and higher tumor accumulation. The lung and kidney data (Figures 5 and 6) display slightly elevated iron levels at all time points for both nanoparticle groups. This agrees with previous findings of minimal nanoparticle deposition to these organs.15 Splenic iron was higher for both nanoparticle groups compared to the controls (Figure 8), which is again consistent with previous studies.15 Blood iron concentrations appears to be higher for the 20 nm than the 110 nm samples at the 4hr time point (Figure 4). This observation is in line with the hypothesis that the smaller nanoparticles will have longer circulation time while the larger nanoparticles are more quickly sequestered by the RES.12 Liver data (Figure 7) confirms this observation with a markedly higher iron concentration for the 110 nm nanoparticles than for the 20 nm nanoparticles at the 4hr time point. The gap in concentration difference, however, does not narrow by the 24 or 72 hour time point suggesting that the 20 nm nanoparticles are either being more rapidly cleared or being sequestered in organs that were not considered in this analysis such as the lymph nodes.
Figure 5.
ICP-MS lung iron content. Each point represents the determined iron concentration of a sample from a single mouse. Linear regression trend lines were fitted to each nanoparticle size group (20nm, 110nm and water control) to observe the preliminary trends in concentration data. The x-axis shows the 4, 24 and 72hr time points from left to right while the y-axis shows ICP-MS-determined iron concentration of the tissue sample in mg Fe/g tissue weight.
Figure 6.
ICP-MS kidney iron content. Each point represents the determined iron concentration of a sample from a single mouse. Linear regression trend lines were fitted to each nanoparticle size group (20nm, 110nm and water control) to observe the preliminary trends in concentration data. The x-axis shows the 4, 24 and 72hr time points from left to right while the y-axis shows ICP-MS-determined iron concentration of the tissue sample in mg Fe/g tissue weight.
Figure 8.
ICP-MS spleen iron content. Each point represents the determined iron concentration of a sample from a single mouse. Linear regression trend lines were fitted to each nanoparticle size group (20nm, 110nm and water control) to observe the preliminary trends in concentration data. The x-axis shows the 4, 24 and 72hr time points from left to right while the y-axis shows ICP-MS-determined iron concentration of the tissue sample in mg Fe/g tissue weight.
Figure 7.
ICP-MS liver iron content. Each point represents the determined iron concentration of a sample from a single mouse. Linear regression trend lines were fitted to each nanoparticle size group (20nm, 110nm and water control) to observe the preliminary trends in concentration data. The x-axis shows the 4, 24 and 72hr time points from left to right while the y-axis shows ICP-MS-determined iron concentration of the tissue sample in mg Fe/g tissue weight.
As expected, tumoral iron concentration (Figure 9) remains minimal compared to the elevated iron in RES sequestering organs. However, the 20 nm nanoparticle samples display higher tumoral iron concentration than the 110 nm samples. This difference might be expected since the smaller size of particle would allow better tissue penetration through tumor vasculature. The 110 nm samples, however, currently have an average iron concentration below that of the control samples at the 24 and 72hr time points. Adding additional mice per group is expected to resolve this discrepancy.
5. CONCLUSIONS AND FUTURE DIRECTIONS
Our long term clearance study results have corroborated previous findings that iron oxide nanoparticles are cleared from sequestering organs with no long term toxicity.16, 17 Results from the pilot size/distribution study also follow biodistribution precedent of higher liver deposition and longer circulation time for larger and smaller particles respectively.12 Increased tumor deposition for smaller particles was also observed. Additional groups are underway to study the effects of surface coatings such as polyethylene glycol and targeting antibodies on biodistribution since it is well known that these modifications have profound impacts on tissue-particle localization.18, 19, 20, 21, 22, 23
REFERENCES
- [1].Gazeau F, et al. Optimizing magnetic nanoparticle design for nanothermotherapy. Nanomedicine. 2008;3(6):831–844. doi: 10.2217/17435889.3.6.831. [DOI] [PubMed] [Google Scholar]
- [2].Jordan A, et al. The effect of thermotherapy using magnetic nanoparticles on rat malignant glioma. Journal of Neuro-Oncology. 2006;78:7–14. doi: 10.1007/s11060-005-9059-z. [DOI] [PubMed] [Google Scholar]
- [3].Papisov MI, et al. Colloidal magnetic resonance contrast agents: effect of particle surface on biodistribution. Journal of Magnetism and Magnetic Materials. 1993;122:383–386. [Google Scholar]
- [4].Lacava LM, et al. Use of magnetic resonance to study biodistribution of dextran-coated magnetic fluid intravenously administered in mice. Journal of Magnetism and Magnetic Materials. 2002;252:367–369. [Google Scholar]
- [5].Pouliquen D, et al. Iron oxide nanoparticles for use as an MRI contrast agent: pharmacokinetics and metabolism. Magnetic Resonance Imaging. 1991;9:215–283. doi: 10.1016/0730-725x(91)90412-f. [DOI] [PubMed] [Google Scholar]
- [6].Moore A, et al. Tumoral distribution of long-circulating dextran-coated iron oxide nanoparticles in a rodent model. Radiology. 2000;214:568–574. doi: 10.1148/radiology.214.2.r00fe19568. [DOI] [PubMed] [Google Scholar]
- [7].Gaumet M, et al. Nanoparticles for drug delivery: The need for precision in reporting particle size parameters. European Journal of Pharmaceutics and Biopharmaceutics. 2008;69:1–9. doi: 10.1016/j.ejpb.2007.08.001. [DOI] [PubMed] [Google Scholar]
- [8].Briley-Saebo KC, et al. Hepatic cellular distribution and degradation of iron oxide nanoparticles following single intravenous injection in rats: implications for magnetic resonance imaging. Cell Tissue Res. 2004;316:315–323. doi: 10.1007/s00441-004-0884-8. [DOI] [PubMed] [Google Scholar]
- [9].Longmire M, et al. Clearance properties of nano-sized particles and molecules as imaging agents: considerations and caveats. Nanomedicine. 2008;3(5):703–717. doi: 10.2217/17435889.3.5.703. [DOI] [PMC free article] [PubMed] [Google Scholar]
- [10].Gaur U, et al. Biodistribution of fluoresceinated dextran using novel nanoparticles evading reticuloendothelial system. International Journal of Pharmaceutics. 2000;202:1–10. doi: 10.1016/s0378-5173(99)00447-0. [DOI] [PubMed] [Google Scholar]
- [11].Corot C, et al. Recent advances in iron oxide nanocrystal technology for medical imaging. Advanced Drug Delivery Reviews. 2006;58:1471–1504. doi: 10.1016/j.addr.2006.09.013. [DOI] [PubMed] [Google Scholar]
- [12].Raynal I, et al. Macrophage Endocytosis of Superparamagnetic Iron Oxide Nanoparticles: Mechanisms and Comparison of Ferumoxides and Ferumoxtran-10. Investigative Radiology. 2004;39(1):56–63. doi: 10.1097/01.rli.0000101027.57021.28. [DOI] [PubMed] [Google Scholar]
- [13].Mandeville JB, et al. Dynamic Liver Imaging with Iron Oxide Agents: Effects of Size and Biodistribution on Contrast. MRM. 1997;37:85–890. doi: 10.1002/mrm.1910370613. [DOI] [PubMed] [Google Scholar]
- [14].Keen CL, Hurley LS. Developmental changes in concentrations of iron, copper, and zinc in mouse tissues. Mechanisms of Ageing and Development. 1980;13:161–176. doi: 10.1016/0047-6374(80)90059-7. [DOI] [PubMed] [Google Scholar]
- [15].Tate J, et al. Toxicity and biodistribution of activated and non-activated intravenous iron oxide nanoparticles. Proc. SPIE. 2009;7181:71810–L. doi: 10.1117/12.809830. [DOI] [PMC free article] [PubMed] [Google Scholar]
- [16].Briley-Saebo KC, et al. Clearance of Iron Oxide Particles in Rat Liver: Effect of Hydrated Particle Size and Coating Material on Liver Metabolism. Investigative Radiology. 2006;41(7):560–571. doi: 10.1097/01.rli.0000221321.90261.09. [DOI] [PubMed] [Google Scholar]
- [17].Jain TK, et al. Biodistribution, Clearance, and Biocompatibility of Iron Oxide Magnetic Nanoparticles in Rats. Molecular Pharmaceutics. 2008;5(2):316–327. doi: 10.1021/mp7001285. [DOI] [PubMed] [Google Scholar]
- [18].Kaul G, Amiji M. Biodistribution and targeting potential of poly (ethylene glycol)-modified gelatin nanoparticles in subcutaneous murine tumor model. J Drug Target. 2004;12(9-10):585–591. doi: 10.1080/10611860400013451. [DOI] [PMC free article] [PubMed] [Google Scholar]
- [19].Berry CC, Curtis ASG. Functionalisation of magnetic nanoparticles for applications in biomedicine. J. Phys. D: Appl. Phys. 2003;36:R198–R206. [Google Scholar]
- [20].Dobrovolskaia MA, et al. Preclinical Studies To Understand Nanoparticle Interaction with the Immune System and Its Potential Effects on Nanoparticle Biodistribution. Molecular Pharmaceutics. 2008;5(4):487–495. doi: 10.1021/mp800032f. [DOI] [PMC free article] [PubMed] [Google Scholar]
- [21].Simberg D, et al. Differential proteomics analysis of the surface heterogeneity of dextran iron oxide nanoparticles and the implications for their in vivo clearance. Biomaterials. 2009;30:3926–3933. doi: 10.1016/j.biomaterials.2009.03.056. [DOI] [PMC free article] [PubMed] [Google Scholar]
- [22].Sun X, et al. An Assessment of the Effects of Shell Cross-Linked Nanoparticle Size, Core Composition, and Surface PEGylation on in Vivo Biodistribution. Biomacromolecules. 2005;6:2541–2554. doi: 10.1021/bm050260e. [DOI] [PMC free article] [PubMed] [Google Scholar]


