

ABSTRACT
Clustered regularly interspaced short palindromic repeats (CRISPR) and CRISPR-associated (cas) genes constitute the CRISPR-Cas systems found in the Bacteria and Archaea domains. At least in some strains they provide an efficient barrier against transmissible genetic elements such as plasmids and viruses. Two CRISPR-Cas systems have been identified in Escherichia coli, pertaining to subtypes I-E (cas-E genes) and I-F (cas-F genes), respectively. In order to unveil the evolutionary dynamics of such systems, we analyzed the sequence variations in the CRISPR-Cas loci of a collection of 131 E. coli strains. Our results show that the strain grouping inferred from these CRISPR data slightly differs from the phylogeny of the species, suggesting the occurrence of recombinational events between CRISPR arrays. Moreover, we determined that the primary cas-E genes of E. coli were altogether replaced with a substantially different variant in a minor group of strains that include K-12. Insertion elements play an important role in this variability. This result underlines the interchange capacity of CRISPR-Cas constituents and hints that at least some functional aspects documented for the K-12 system may not apply to the vast majority of E. coli strains.
IMPORTANCE
Escherichia coli is a model microorganism for the study of diverse aspects such as microbial evolution and is a component of the human gut flora that may have a direct impact in everyday life. This work was undertaken with the purpose of elucidating the evolutionary pathways that have led to the present situation of its significantly different CRISPR-Cas subtypes (I-E and I-F) in several strains of E. coli. In doing so, this information offers a novel and wider understanding of the variety and relevance of these regions within the species. Therefore, this knowledge may provide clues helping researchers better understand these systems for typing purposes and make predictions of their behavior in strains that, depending on their particular genetic dotation, would result in different levels of immunity to foreign genetic elements.
INTRODUCTION
Clustered regularly interspaced short palindromic repeat (CRISPR)-Cas systems consist of two main functional components: (i) at least one cassette of DNA repeats regularly spaced by unique sequences called spacers (1) and (ii) a set of genes named cas (for “CRISPR associated”) (2). Although these systems have tentatively been involved in disparate functions (3–6), it was recently demonstrated that they form part of the diverse repertoire of tools utilized by prokaryotic microorganisms to prevent infection by foreign DNA (7, 8).
CRISPR-Cas systems interfere with genetic invaders by an unprecedented mechanism (9, 10). Interference is achieved after the CRISPR arrays are transcribed and the resulting pre-CRISPR RNAs (pre-crRNAs) processed by specific Cas proteins into monospacer crRNA molecules (11, 12). Afterward, crRNAs hybridize with complementary sequences and, concomitantly, a Cas endonuclease cuts within the target, leading to its degradation (9, 13). During invasion, new spacers are incorporated into the host CRISPR arrays, providing adaptive immunity (7, 14, 15). As a result of this adaptation, the spacer identities and numbers may largely differ between strains, reflecting the diverse previous encounters and activity of the acquisition machinery (16–18).
Escherichia coli isolates may carry two different CRISPR-Cas systems (19, 20) that belong to either subtype I-E or subtype I-F (21). The components of the I-E system are split between two loci, CRISPR-I and CRISPR-II, flanked by the iap and cysH genes and the ygcE and ygcF genes, respectively. In the CRISPR-I locus, there is a cassette of type 2 repeats (22), termed the CRISPR2.1 array, and a set of eight cas-E genes (namely, cas2, cas1, cas6e, cas5, cas7, cse2, cse1, and cas3). The proteins encoded by cas6e, cas5, cas7, cse2, and cse1 make the Cascade complex, which generates the crRNA molecules (9, 11). Either one repeat array (CRISPR2.2-3) or two repeat arrays (CRISPR2.2 and CRISPR2.3, separated by 0.5 kb) can be present in the CRISPR-II locus. Next to both CRISPR2.1 and CRISPR2.3 cassettes, there are leader sequences (23) that harbor the promoters for their transcription (24, 25, 26). The I-F system is located between the clpA and infA genes in the locus referred to as CRISPR-III. This locus consists of up to two arrays of type 4 repeats (22), consequently called CRISPR4.1 and CRISPR4.2, and an operon of 6 cas-F genes (namely, cas6f-csy3-csy2-csy1-cas2-cas3-cas1). Leader sequences are observed adjoining each repeat array (19). When only one cassette is found in this locus (which implies absence of cas genes), it is named CRISPR4.1-2. Although all E. coli strains analyzed so far carry at least one CRISPR4 repeat unit, just a few bear cas-F genes, usually representing the only cas in the cell (only a single strain has been identified so far carrying I-E and I-F cas genes [19]). In contrast, most E. coli strains harbor a complete I-E system and only certain clonal groups entirely lack it, albeit there are a variety of intermediate situations (19, 27).
While some bacteria harbor active CRISPR-Cas systems that efficiently prevent lateral gene transfer and that are primarily involved in defense (7, 13, 28), these roles are not evident in E. coli (20, 27, 29). For instance, in K-12-derivative strains, the CRISPR-Cas I-E system is almost completely silenced under normal laboratory growth conditions (24, 25). Moreover, the diversity of spacers encountered in the species is considered reduced compared to what would be expected for a conventional immune system (20). Yet the pervasiveness of these systems in E. coli (19) suggests that they must provide an advantage for the cell.
In this work, we conducted evolutionary analyses of the CRISPR loci in a set of available E. coli sequences and a collection of isolates (ECOR collection [30]). ECOR strains were included in the study because they represent much of the species genetic variability and their phylogeny has been well established, defining up to six groups (namely, A, B1, B2, D, E, and F [31]). Also included were sequences from different Shigella species, a polyphyletic genus whose members can be considered highly specialized pathogenic E. coli strains (32–34).
This report provides a comprehensive view of the E. coli CRISPR-Cas regions that will be of utility for functional and typing studies. We obtained data supporting the replacement of a complete set of cas-E genes, together with the associated leader, with a minor variant represented by the profusely characterized K-12 system. Furthermore, in line with previous suggestions (35, 36), we provide consistent data to confirm that the dynamics of the CRISPR-Cas systems is greatly affected, at least in the case of cas-E, by insertion elements as driving forces implicated in their evolution.
RESULTS
Evolutionary dynamics of the CRISPR arrays across E. coli.
In order to determine how the CRISPR arrays have evolved in E. coli, a binary clustering analysis of the spacer content was performed in a panel of 131 isolates and the corresponding tree was constructed as described in Materials and Methods. In brief, for each CRISPR array, strains were classified into groups (denoted spacer groups, or “SGs”) depending on the identity of the spacers in that array: strains within a given SG shared at least one spacer with other member(s) of the group. Concurring with previous observations (19, 24), the majority of shared spacers were located at the leader-distal end of the array (data not shown). A total of 14 SGs were identified for CRISPR2.1, 12 for CRISPR2.3, 3 for CRISPR2.1-2, and 2 for both CRISPR4.1 and CRISPR4.2 arrays (Table S1). Every SG was considered a character, and the combined binary data for all the arrays of each strain were used to generate a spacer-based tree (see Fig. S1 in the supplemental material). Given that multilocus sequence typing (MLST) produces the most commonly accepted phylogenetic reconstruction of the species (31, 37, 38), an MLST tree was generated for the same strains (see Fig. S2 in the supplemental material) and the ultrametric matrices of the two trees were compared with the use of the COPH and MXCOMP programs (NTSYSpc 2.0 package). The correlation value obtained was 0.517 for a cutoff of 0.083 at a significance level of 0.05; hence, the two trees were considered comparable (39). Nevertheless, as previously observed in a similar analysis performed with another set of strains (40), some clusters of the spacers tree did not conform to the MLST groups (see Table S1 in the supplemental material and compare Fig. S1 with Fig. S2), suggesting that recombinational events between CRISPR loci of different strains might have taken place. Notably, Escherichia fergusonii ATCC 35469 shares a CRISPR2.1 spacer with E. coli K-12-MG1655 (here referred to as K-12) and related strains, despite both species having diverged about 46 million years ago (Mya) (41). This observation further supports the occurrence of spacer exchange even among phylogenetically distant strains. Related to the variation at the spacer group level, a great divergence in the number of common spacers that constitute the SGs for the I-E system in the different clonal groups was found (ranging from 1 to 40; results not shown). Usually, strains belonging to SGs with the lowest numbers of spacers also corresponded to basal (i.e., earlier to diverge) MLST groups (data not shown). In this sense, MLST groups A and B1 separated more recently from the basal B2, D, E, and F groups (see Fig. S2). Hence, it might be possible that, during the phylogenetic evolution of the species, a substantial change occurred that was reflected in these variations.
Evolution of cas-E and cas-F genes.
The evolutionary relationships of the E. coli cas genes were inferred by considering the panel of sequenced strains studied in this work. The phylogenetic trees were obtained after alignments performed with concatenated sequences of the cas-F genes (10 sequences; Fig. 1A) or cas-E genes (37 sequences; Fig. 2A). Each of these cas trees was compared with an MLST tree (Fig. 1B and 2B) built with the corresponding strains. As a result, different degrees of correlation were observed depending on the cas subtype. Whereas for cas-F genes the matching was almost coincident (Fig. 1), a correspondence with phylogeny was more discordant in the case of cas-E (Fig. 2A and B). Notably, a cluster (here referred to as the E2 cluster) composed of few strains (see Fig. 2A) was separated from a major one (named E1 cluster) that included two non-E. coli strains used as outgroups (Salmonella enterica subsp. enterica serotype Choleraesuis SC-B67 and Escherichia albertii TW07627) (Fig. 2B). The E2 cluster comprised some MLST A strains, a group E strain (S. dysenteriae Sd197), and the other outgroup included in the analysis (E. fergusonii ATCC 35469; Fig. 2A). These results are compatible with a different origin for each cluster. In addition, a clade of some MLST B1 strains (including B171 among others) branched at a position that was more basal than that defined by MLST, suggesting that recombination events could have taken place at the cas region.
FIG 1 .

Trees from cas-F genes (A) and MLST data (B) of sequenced E. coli and Shigella strains. Yersinia pestis serovar Angola and E. fergusonii ATCC 35469 were used as outgroups. Both sets of genes were concatenated and aligned separately. Colors indicate the MLST group (green, B1; red, B2). Shigella sp. strain D9 is abbreviated as SspD9.
FIG 2 .

Trees from cas-E genes (A), MLST data (B), and cas1-cas2-cas3 sequences (C) of sequenced E. coli and Shigella strains. E. fergusonii ATCC 35469, E. albertii TW07627, and S. enterica serotype Choleraesuis SC-B67 were used as outgroups. All sets of genes were concatenated and aligned separately. Colors denote the MLST group (dark blue, A; green, B1; fuchsia, D; light blue, E; dark red, F). Two separate columns to the right of each tree indicate the distinctive spacer groups for CRISPR2.1 (2.1) and CRISPR2.3 (2.3) arrays. Shigella strains are designated with an abbreviation (Sb, S. boydii; Sd, S. dysenteriae; Sf, S. flexneri; Ss, S. sonnei; ssp., Shigella sp.) and a specific code as indicated in Table S1 in the supplemental material. B1 strains with a complete set of cas-E genes showing a significantly altered topology with respect to the MLST phylogeny are boxed in red.
A similar phylogenetic analysis considering only the genes that encode the Cascade region (9) revealed the same altered topology found in Fig. 2A (results not shown). Conversely, when the cas1-cas2-cas3 genes were aligned, a better correlation of the resulting cas tree (Fig. 2C) with the phylogeny of the species (Fig. 2B) was observed for these discrepant B1 strains, thus indicating that Cascade-encoding genes are more prone to variation than the cas1-cas2-cas3 genes, at least in these strains. However, E1 and E2 clusters were still defined as separated clades, providing further support to the idea of a distinct origin of at least non-Cascade genes.
To determine if recombination could have accounted for the tree discrepancies observed in the case of the B171 clade of B1 strains, a prediction analysis of such events was carried out with the cas-E1 genes (see Fig. S3 in the supplemental material) using the GENECONV program (see Materials and Methods). The results confirmed that, concurring with the phylogenetic trees, recombination at the Cascade region was more relevant for the above-mentioned B1 cluster. Unsurprisingly, this recombination appeared to be frequent among closely related strains, especially within the B1 group. Nevertheless, this higher occurrence within them was partially due to their prevalence among the strains under study. In contrast, no recombination was detected for S. enterica, and only two of such events were found in E. albertii, both with D group strain 042, thus evidencing that recombination was favored among strains sharing close phylogenetic relationships. These results indicated that the phylogenetic variability of the cas-E systems was driven not only by genetic drifts (i.e., point mutations) but also by partial gene substitutions, at least within certain strains.
To further examine the possible impact in phylogeny of this higher variability at the Cascade level, we calculated the values of the codon adaptation index (CAI) as a measure of the codon usage bias of a sequence in relation to its genetic environment (42). These studies were performed for the corresponding cas genes of those MLST B1 strains represented in Fig. S3 in the supplemental material, including B171 and E22 (results not shown). Remarkably, statistically significant differences were observed for the CAI values of B171 and E22 with respect to the other strains considered. This divergence was found not only for cse1, cse2, and cas7 (comprising the bulk of the Cascade genes) but also for cas3, despite the latter not disrupting the established MLST topology (Fig. 2C). Whereas CAI values for cas3 were higher in both B171 and E22 (possibly reflecting a more optimal gene expression), a lower value was found in the case of cse1, cse2, and cas7, perhaps hinting at a functional correlation between these two sets of genes. Moreover, no major differences in CAI values were found for Cascade genes cas5 and cas6e, as well as cas1 and cas2, thus suggesting a CAI-polarized divergence of the cas genes depending on the strains.
Despite these differences found as the consequence of both genetic drift and recombination, the most significant discordance between cas-E and MLST groupings corresponded to the segregation of the E2 cluster in the cas tree (Fig. 2). Analyses of the codon usage and the guanine and cytosine (GC) content of the cas genes could provide further insight on their origin and evolution. These two parameters are linked to the adaptation of specific sequences to their genetic context (43–45) and had been previously reported in certain CRISPR systems unrelated to E. coli (35). First, the GC content of E1 and E2 genes was calculated to assess whether these two variants could have been independently acquired. In agreement with this possibility, the mean GC percentage of E1 genes was substantially different from those in the E2 group (53.5 versus 45.6). Moreover, these values contrasted with those of cas-F genes (50.5%) and the K-12 genome (50.7%), suggesting a more recent acquisition of the cas-E genes. To corroborate this observation, a similarity tree based on codon usage frequencies was constructed (Fig. 3). Whereas cas-F genes clustered along with the genome, the cas-E genes split into two main groups corresponding to E1 and E2. The robustness of this grouping with respect to the K-12 genome was statistically supported. Remarkably, the E2 genes were the more dissimilar with respect to the genome. Taking these results together, it can be concluded that E1 and E2 conform to substantially distinct cas-E variants in E. coli, probably having been incorporated into the genome after the cas-F genes, with E2 as the most recent acquisition.
FIG 3 .
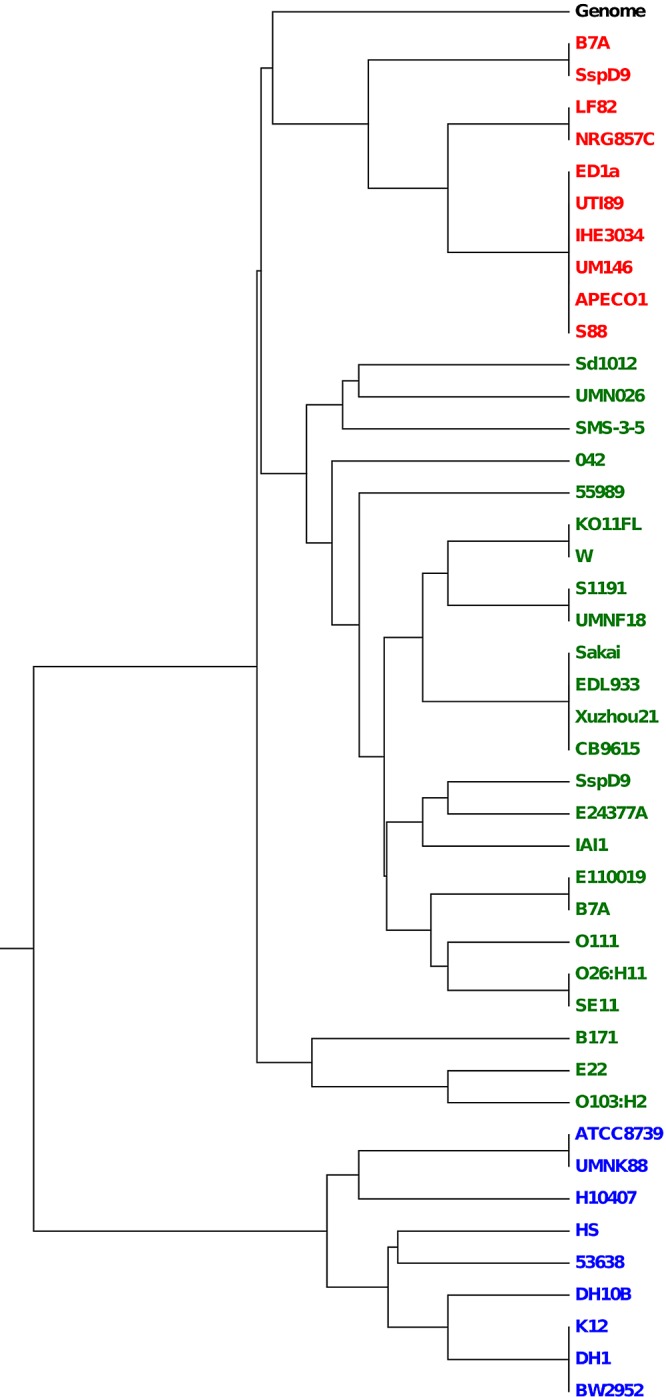
Tree based on codon usage distances of cas-E and cas-F genes. Sequenced E. coli and Shigella strains with the complete set of these genes were considered. The codon usage data of the entire K-12-MG1655 genome (labeled “Genome”) are also included for reference. The colors designate the different sets of cas genes: red, cas-F; green, cas-E1; blue, cas-E2. Shigella strains are abbreviated as described for Fig. 2.
The occurrence of each cas-E variant in the ECOR collection strains was determined by PCR performed with a primer matching variant-specific cas3 sequences, along with a second primer annealing with a conserved region downstream of cysH (see Materials and Methods). Amplification of a strain with either cas3E1-R or cas3E2-R primers would imply that it harbors the corresponding variant of cas3 and, presumably, of the rest of the cas-E genes. Only strains yielding amplification for one variant and not the other were further considered (see Table S1 in the supplemental material). The results of these amplifications, together with data of sequenced strains, showed that cas-E2 genes are present in most E-carrying strains from the MLST group A (with the exceptions of EC01, EC06, EC24, UMNF18, and S1191), a strain from group E (SD 197), and E. fergusonii ATCC 35469.
Diversity of CRISPR regions.
In order to gain further insight into the origin and evolution of the E. coli CRISPR-Cas systems, a survey of the iap-cysH, ygcE-ygcF, and clpA-infA regions, harboring CRISPR-I, CRISPR-II, and CRISPR-III loci, respectively, was performed.
The diversity of genetic elements in the CRISPR-I locus (containing the cas-E genes and CRISPR2.1 array) was determined for sequenced E. coli and related strains. First, we noticed that the leader of CRISPR2.1 was linked to the presence of cas genes. Moreover, the leader sequences were related to the specific gene variants (see Fig. S4 in the supplemental material) and are therefore referred to as L1 and L2, for the associated gene variants E1 and E2, respectively.
In addition to the leader and cas-E variants, the occurrence of diverse insertion sequences (IS), a hok sok system, and conserved intergenic regions (IG) was considered to establish the diversity of CRISPR-I arrangements. Nine main organizations (named A to I; Fig. 4) were defined. The arrangements of affiliation thus established for sequenced genomes and those inferred for ECOR strains in accordance with the size of CRISPR-I PCR amplicons (see Materials and Methods) and previous data (19) are indicated in Table S1. Specific genetic elements were associated with the absence of cas-E genes or the presence of a given cas/leader variant. For instance, all E. coli strains carrying E1 were linked to the presence of IG4 and the E2 variant was invariably associated with IG5 (i.e., both elements are absent in strains lacking cas-E genes; Fig. 4). Moreover, the hok sok toxin-antitoxin system (46) is present in all strains but those harboring E2, and IG3 was found in E1 and strains without cas-E genes, except for the G arrangement (Fig. 4). Taking into account the presence or absence of these genetic elements in the analyzed strains as well as predicted intermediate situations (see arrangements AH1 and AH2 in Fig. 4), a scenario of cas-E deletion or acquisition in E. coli could be inferred. Figure 4 shows the most parsimonious order of events concurring with the phylogeny of the species. Arrangement A, which is present in strains of all phylogenetic groups but B2 (with the exception of the highly modified case A5; Fig. 5), could be considered the most ancient (i.e., cas-E1). Deletion of the IG6-IG3 intervening region would give rise to arrangement B and a later insertion of ISu (uncharacterized IS) in case C. In unrelated events, the insertion of IS186 and ISu into case A strains would lead to arrangements D, E, and F and the predicted hypothetical cases AH1 and AH2. The subsequent recombination between equivalent IS elements in AH1 and AH2 cases would have produced removal of the L1 leader and the cas-E1 genes and partial depletion of the CRISPR cassette, as observed, for example, in case G. Next, a module composed of the IG5 region, a complete set of cas-E2 genes, and an L2 leader would be inserted in AH2, leading to case H. Moreover, the conservation of the CRISPR region next to IG6 in both cas-E1- and cas-E2-harboring strains and the presence in the leader-proximal region of L2-specific CRISPRs (19) strongly suggest that the insertion module also carried at least one CRISPR unit and that the integration took place at the CRISPR array. Finally, the I arrangement could have been generated after insertion of an IS186 element within the CRISPR cassette of an H strain. Some authors have previously suggested a possible role of ISs in the evolution of the CRISPR-Cas systems, merely based on the incidence at these regions of those elements (35, 36). Here, we provide solid evidence supporting that interpretation.
FIG 4 .

Diagram depicting the evolutionary steps in the modular replacements that have taken place at the CRISPR-I locus of E. coli. Arrangements are designated A to I. Predicted steps and hypothetical cases (AH1, AH2) are indicated with dotted lines. Intergenic (IG) regions, insertion elements IS186 and (uncharacterized) ISu, the hok sok system, CRISPR repeats (C), and variants of the cas-E genes and leader (L) are indicated and distinctively colored.
FIG 5 .

Graphical depiction of minor CRISPR2.1 arrangements for Shigella and E. coli strains. Each arrangement variant is denoted with the letter of the main arrangement from which it could have derived and a subscript number. The names of the IS encountered are indicated. Each genetic element is distinctively colored. Nontruncated cas genes are in yellow and partial or interrupted sequences in red. cas2 is referred to as “2.” Arrangement A5 is deduced from unpublished results from C. Díez-Villaseñor. The arrangements of E. albertii TW07627 (E.al) and S. enterica Choleraesuis SC-B67 (S.en), with their distinctive regions, are also included.
Minor arrangements derived from the major ones were observed, the majority of them involving additional ISs that presumably promoted further deletions (Fig. 5). In agreement with the higher incidence of this sort of element in Shigella genomes than in E. coli genomes (34, 47, 48), the occurrence of these variants was prominent in the former.
In the case of the CRISPR-II locus (carrying CRISPR2.2 and 2.3 arrays), no significant variations in the CRISPR flanking regions of the sequenced strains were found (data not shown), aside from the sporadic presence of insertion elements, mostly in Shigella strains, that had no apparent impact on the evolution of this region. Moreover, in contrast to CRISPR2.1, the leaders of CRISPR2.3 (leader 2.3) were similar in all cases, in both cas-E1- and cas-E2-carrying strains, as well as in those lacking these genes (see Fig. S5 in the supplemental material). Moreover, many strains pertaining to the same SG for the CRISPR2.3 array possessed either the I-E1 or the I-E2 variant, as seen in Table S1. These observations strongly suggest that the CRISPR-II locus was already present when the replacement of the leader-cas elements in CRISPR-I took place and that the two CRISPR I-E loci have evolved in distinct manners.
As in the case of CRISPR-II, the variability of the CRISPR-III locus (I-F system region) was limited and no IS was usually present (see Fig. S6 in the supplemental material), the only exception being the B7A strain, with IS100 located between the cas-F genes and the leader of CRISPR4.2. Thus, in agreement with what was observed at the level of cas-F genes and CRISPR4 arrays, this region is more clonal than the I-E counterpart.
Timeline of acquisition of the CRISPR-Cas systems.
The existence of two distinct CRISPR-Cas subtypes in E. coli, one of them presenting two alternative variants, raises the issue of when they were incorporated into the genome. Evidence of the presence of equivalent I-E and I-F systems in the corresponding loci of E. coli, E. fergusonii, E. albertii, and S. enterica strains (Fig. 5; see also Fig. S6 in the supplemental material and reference 19) denotes an ancient and widespread occurrence. As seen above, frequencies of codon usage and GC content of cas genes pointed out that the I-F system of E. coli was more related to its genomic environment whereas the E2 variant would be the most dissimilar (Fig. 3). These two parameters can be used as indicators of the relative times of acquisition of genes: after a novel sequence is incorporated into a genome, it gradually adapts these features to match those of its surroundings in the process known as amelioration (40, 45). Hence, the more ameliorated I-F system would have been the first to incorporate into the genome followed by I-E1 and, more recently, I-E2 replaced I-E1 in some strains. Against this line of reasoning, the higher concordance of I-F with the genome could be merely interpreted as the result of this system evolving more rapidly toward homogenization. Yet the inferred mutation rates for the sets of cas-E and cas-F genes, as calculated from their CAI values (42, 49), showed no statistically significant difference between cas-E1 and cas-F, therefore arguing against I-F evolving faster. Moreover, the codon usage frequencies of the E. coli K-12 genome (a strain with cas-E2 genes and no cas-F) that were included in the corresponding tree (Fig. 3) grouped with cas-F. Also in line with these observations, the above-mentioned differences at the cas3-cysH intergenic regions among strains, with some IGs associated with certain cas-E variants (Fig. 4; see also Fig. S4 and S5 and Table S1 in the supplemental material), further supported this order of incorporation.
The order of acquisition of I-E and I-F systems in E. coli has been previously addressed based on their presence or absence in related Salmonella and Escherichia species (50), suggesting that the I-E system preceded the I-F system. In our study, we considered a more comprehensive set of data that allows a more parsimonious explanation. In particular, two I-E variants have now been recognized, additional species and a larger number of strains have been included, and parameters such as codon usage and GC content have been considered. As mentioned above, on the basis of the GC content and codon usage values and also of support by the association of certain IGs with specific cas-E variants, we propose that I-F is the more ancestral of the two systems. Afterward, I-E1 followed and was later replaced in certain strains by I-E2. Thus, we considered the mean divergence time inferred from the most distant (basal) strains in possession of the I-F, I-E1, or I-E2 system to calculate their time of acquisition. This divergence was determined by taking into account a rate of mutation of 6.86 × 10⁻¹⁰ substitutions per year, estimated from a mean 6.31% difference in MLST distances between the E. coli strains and their closest outgroup (E. fergusonii), the two species having separated 46 Mya (41). Thus, we concluded that the extant I-F was acquired some 20.5 ±0.25 Mya, followed by I-E1 at about 19.5 ±0.8 Mya, the latter then being replaced with I-E2 at approximately 14.1 ±0.6 Mya, perhaps from an unknown donor that also transferred it to E. fergusonii.
DISCUSSION
Multiple levels of genetic exchange and variability at the CRISPR-Cas regions.
The two CRISPR-Cas systems present in E. coli have experienced recombination and gene exchange in different degrees. While cas-F genes mainly follow the clonal frame characteristic of most genes within the species (31, 37, 38), cas-E genes are considerably prone to genetic exchange. This variation involving the cas-E genes is more frequent in strains ascribed to certain clonal MLST groups (e.g., A and B1). Also, it extends to the adjacent CRISPR array and the intergenic regions, where CRISPR2.1 shows a higher diversity (i.e., more SGs, less clonally related with the MLST phylogeny) than CRISPR2.3. This variability in CRISPR2.1 is associated with the neighboring cas genes (as SGs relate better to cas-E than to MLST groupings), thereby hinting at a concerted shift of these adjacent regions. This association is also reinforced by the invariable correlation of a specific cas-E variant and the corresponding leader. This cas-leader-array relationship hints that multiple exchanges may have in fact occurred involving this region, with each set of genes most likely carrying its own leader and possibly even its own CRISPR array. This would suggest that at least some compatible interaction between the cas genes and the leader-repeat regions might be needed for optimal operation. However, this relationship would not be indispensable, as seen previously by our group (51) and also supported by the fact that the E2 variant is functional with the substantially different CRISPR-II leader (24). Thus, CRISPR2.1 could be considered the most variable array, likely due to the proximity of the exchangeable cas genes. In contrast, CRISPR-II (away from the cas genes) is considerably more clonal, following the MLST phylogeny to a higher degree.
Despite the spacer variability, the correspondence with the MLST phylogeny was still significant for most strains. This study somehow contrasted with previous works, where higher rates of spacer turnover and lineage heterogeneity were found (20, 50). An explanation for this discrepancy lies in the approach used to generate the SGs to build the spacer tree. The methodology employed in this work allowed us to relate strains sharing very few or even no common spacers, thus contributing to a lesser dispersion of data and therefore to a more coherent clustering.
With respect to the functionality of the CRISPR-Cas systems, the CAI divergence involving most of the cas-E1 genes of certain B1 strains suggests that, at least in this phylogenetic clade, coevolutionary adaptations might have occurred. Although the role of Cascade is not yet entirely characterized, a recent work has established that, in the process of CRISPR-mediated immunity, Cse1 recruits Cas3 for DNA degradation (9). Given that CAI may be affected by the levels of gene expression (43), it is plausible (on the basis of our results) that a lower transcription as expected for cse1 and adjacent genes might be at least partially compensated by the increase in cas3 expression, as inferred by the CAI of B171 and associated strains.
Also related to CRISPR-Cas functionality and spacer diversity, the differences in the number of the spacers that conform SGs could be an indication of a significant cas modification at the molecular level to adapt to more efficient rates of spacer uptake. Alternatively, they might simply reflect a change to a more challenging environment for those strains. It seems unlikely, however, that such drastic ecological change has ever occurred during the evolutionary history of the species in all the strains. Moreover, the differences in the spacer numbers that constitute the SGs could largely be due to the genetic exchange in those regions. Therefore, these values should be taken as approximate, at least for the most variable arrays (i.e., CRISPR2.1) and strains. In line with this variability, strains ascribed to the same SG may come from different hosts and geographical locations (http://www.shigatox.net/new/reference-strains/ecor.html), as already pointed out in a previous work performed with a comparable set of E. coli isolates (19). Nevertheless, strains reflecting more clonal relationships at the I-E level concurring with the MLST phylogeny (e.g., in groups D, E, and F and in some A and B1 clusters) could provide better estimations of such rates, which would also be applicable to the mainly clonal I-F system.
In this work, two cas-E variants (E1 and E2) were found in E. coli. At present, functional studies have mainly been performed with K-12 derivatives carrying cas-E2, which were shown to be repressed by the transcriptional regulator H-NS (11, 24–26). Additionally, the cas-E1 variant has been studied on an O157:H7 strain, where differences with respect to K-12 were observed affecting the acquisition stage (51). Thus, the conclusions from K-12 might not entirely apply to the more prevalent E1 system: other strains might show different levels of activity in terms of spacer incorporation.
The mobile nature of the CRISPR-Cas systems is hinted at by the inconsistency of phylogenetic relationships derived from Cas or repeat analysis and gains further support from the presence of complete systems in plasmids and viruses, or associated with insertion elements, that could serve as vehicles for their lateral transfer (22, 36, 40). Moreover, it has been demonstrated that a CRISPR-Cas locus retains functionality even across distantly related microorganisms (36). Furthermore, evidence has been provided supporting the replacement of CRISPR-Cas and associated Cmr modules in crenarchea as a result of their mobility (40). The evidence presented here for the I-E system, in the form of recombination at both genes and CRISPR arrays, the different intergenic regions associated with specific variants, and the influence of insertion elements, was indicative of such behavior.
The majority of strains that conserve at least a portion of the CRISPR-I locus possess the same tandem, consisting of a degenerated repeat and a particular spacer, at the iap proximal end of the array (19), regardless of the cas-E variant. Additionally, slightly different degenerated repeats are present in some strains (19) of basal MLST groups in which some or even the majority of the members correspond to arrangement B (Fig. 4). Based on the parsimonious substitution model depicted in Fig. 4, the pervasiveness of this tandem can be explained by our estimation of the time of incorporation of the CRISPR-Cas systems. This acquisition roughly coincides with a decrease in the population size of the species that therefore contributed to reduce its diversity (38). Furthermore, this prevalence of the degenerated repeat might have a functional purpose, such as facilitating CRISPR-Cas substitution. Their presence would effectively hamper the total loss of the array by homologous recombination with the rest of significantly different type 2 repeats (19, 22). Thus, strains from arrangement B (missing the entire CRISPR-Cas cassette) might have been prevented from reintroducing new genes and arrays as frequently as in the rest. Given this premise, the terminal degenerate repeats, observed in arrays of many other CRISPR systems, could serve as “anchor” units.
Implication of insertion elements in the genetic variability of the CRISPR-Cas systems.
As mentioned, ISs may have played an important role in the removal or inactivation of cas genes and the replacement of I-E variants in E. coli. As an indication of the nonessential nature of this CRISPR-Cas subtype (11, 20), these events were observed in a relatively high number of E-carrying strains. Expendable genomic regions are usually prone not just to higher rates of mutation but also to being targeted by ISs (47, 52). This situation in I-E contrasts with the almost complete lack of incidences of IS within I-F (with the exception of B7A), which would point to a more crucial role of this system, at least in those strains carrying a complete set of cas-F genes. Yet this relevance would be accompanied by a lesser degree of variability within I-F and by more uniform rates of spacer incorporation. For I-E, its dispensability (and therefore variability) would then reflect the opposite situation, that of a more versatile and adaptable system that arose to replace the original I-F.
Of all the insertion elements observed in this work, a special relevance of both IS186 and the uncharacterized ISu in the evolution of the cas-E system of E. coli is patent. While little is known about ISu, IS186 has an affinity for sequences abundant in GC (53). Unsurprisingly, such regions can be found (i) at the IG2-IG3 boundary (IS186 insertion), (ii) at the cysH-distal part of IG1 (ISu insertion), and (iii) mostly within the repeats of CRISPR-I and CRISPR-II loci. Most notably, neither type 4 repeats in I-F nor the type 2 degenerated in I-E (19, 22) shares these features. Therefore, GC-rich sequences would be acting as “hot spots” for IS insertion that may guide the evolution, through removal, of the CRISPR-Cas systems.
Concluding remarks.
The study of the diversity at the CRISPR-Cas regions of E. coli and related organisms revealed a series of events taking place in the evolutionary history of the species, reflected in a profuse exchange among certain strains. At least in the I-E system, insertion elements constituted a major driving force for this variability, and the degenerated (anchor) repeat may play a crucial role in preserving some of the CRISPR-Cas integrity. We have established the existence of two cas I-E variant subtypes in E. coli, each with its own leader and also associated with specific adjacent regions that confirm the modular nature of these systems. Previous studies on strain K-12, harboring the less ameliorated I-E2 variant, have shown a reduced cas activity that, aside from the H-NS repression, might be explained by the marked differences in sequence with respect to I-E1. In this regard, even the most recent analyses performed with strain O157:H7 carrying I-E1 might have the hindrance of its situation within a more basal MLST cluster (E), with spacer groups having reduced numbers of units that might reflect a lower activity of this system. Additional experiments with selected strains from diverse MLST groups might then help researchers to better understand these possible differences. In any case, our findings along with previous results strongly suggest that the spacer variability of the I-E arrays would preferentially be due to recombination and gene exchange rather than being the result of cas activity.
MATERIALS AND METHODS
Growth conditions.
E. coli strains cultured in this study comprised a set of 72 natural isolates known as the ECOR collection (30). LB medium was used for growth, and cultures were incubated at 37° C for 12 h.
PCR and sequencing.
DNA templates were extracted from cells grown with shaking in liquid medium. After growth, cultures were centrifuged, the supernatant was removed, and the cell pellet was resuspended in 1 ml of ultrapure (Milli-Q) water. This washing was repeated for a total of three times. Lysis was achieved by heating at 98° C for 10 min and cell debris removed by centrifugation. Finally, the supernatant solution containing the DNA was stored in aliquots at −20° C.
PCRs were conducted under standard conditions (annealing temperature [Tª], 55°C) with Taq polymerase (Roche) on a TC-3000 thermal cycler (Techne). Primer cysH-F (5′ CGTTTTTATTTTGCGAGCAGC 3′), hybridizing at the conserved intergenic region closest to the cysH flanking gene, was used in combination with either primer cas3E1-R (5′ TCGTCGCCCCCGTCTTTCTC 3′) or primer cas3E2-R (5′ CAGATGAATATCATTTCCTTTCG 3′), both hybridizing at equivalent positions close to the 5′ end of the cas3 gene of their respective variants. PCR products were purified with a QIAquick PCR purification kit (Qiagen). Sequencing was performed with a BigDye Terminator cycle sequencing kit in an ABI Prism 310 DNA sequencer, after the manufacturer’s indications (Applied Biosystems).
Source of sequence data.
Genomic sequences were retrieved from public nucleotide databases (http://www.xbase.ac.uk/main/browse/; http://www.ncbi.nlm.nih.gov/genomes/). In the case of ECOR strains, partial sequences of genes used for multilocus sequence typing were downloaded from the Environmental Research Institute, University of Cork (http://MLST.ucc.ie; dinB, icdA, pabB, polB, putP, trpA, trpB, and uidA genes), and from the Institut Pasteur (http://www.pasteur.fr/recherche/genopole/PF8/mlst/; adk, fumC, gyrB, icdA, mdh, purA, and recA genes) websites. Data on repeat number and cas and spacer content, as well as on the presence of insertion elements in CRISPR loci of ECOR strains, derived from a previous study (19).
Sequence analyses.
Phylogenetic analyses of nucleotide sequences (for cas and MLST genes) were carried out with the program MEGA version 4 (54) from alignments conducted with CLUSTALW (http://genome.jp/tools/clustalw/) and manually edited to correct mismatches. Sequence trees were constructed using the unweighted-pair group method using average linkages (UPGMA), with distances calculated by the Jukes-Cantor model on a pairwise-deletion comparison that allowed the inclusion of partial sequences. However, the lack of proper alignment of the partially deleted cas3 of Shigella flexneri 2a strain 301 (Sf301) prevented its use in the analyses.
For the construction of codon usage and trees based on spacer absence or presence, binary clustering analyses were performed with NTSYSpc 2.0 (Exeter software). As with the sequence data, trees were built using UPGMA. Distances were calculated by the average taxonomic distance model. For the generation of the matrix based on the combined binary data of the spacers from the 5 CRISPR arrays analyzed, an iterative procedure was used to select the characters to be considered. First, for each CRISPR array, only those spacers present in the highest number of strains (defining the spacer groups [SG]) were considered. Next, strains not included in any SG but sharing at least one spacer with any member within it were recruited. Then, each remaining ungrouped strain as well as each SG was considered a distinct character (i.e., all strains within each group were assigned the same character value). Further, the same procedure was later applied within each SG to define potential subgroups as new distinct characters, although this was done only if the new results obtained were different from those obtained with the original SG. A CRISPR2.1 spacer present in the vast majority of strains, thus not being discriminative, and spacers that were identical but that were located in different loci (presumably acquired in separate events) were not considered for the generation of SGs. For the construction of trees based on codon usage, codon usage frequencies were determined with the Countcodon application (http://www.kazusa.or.jp/codon/countcodon.html) and converted into a binary matrix of characters. Either 1 or 0 was assigned to the codons of each amino acid depending on whether the score was above or below the cutoff value of 80% with respect to the particular maximum.
Analyses of recombination at the cas-E1 sequence variants were performed with the program GENECONV 1.81 (Department of Mathematics, Washington University, St. Louis, MO; http://www.math.wustl.edu/~sawyer/geneconv). Only strains bearing the complete set of cas genes were considered for the analysis. Two selected strains (if present) were chosen for each main MLST cluster. In the case of the more abundant strains from B1 group, at least two strains were taken from those subclades diverging more than 0.2%. For each strain included in the analysis, the concatenated cas sequences were aligned and the nucleotide differences for each pair were statistically tested by the program to seek for recombinational events. Pairwise comparisons rendering a Bonferroni-corrected Karlin-Altschul P value of less than 0.05 were deemed significant for recombination between the two sequences.
IS-Finder (https://www-is.biotoul.fr/) was used for the identification of insertion elements. Consensus leader sequences were obtained with WebLogo (http://weblogo.berkeley.edu/logo.cgi). CAI values were calculated using the application at http://genomes.urv.es/CAIcal/ (30), with the codon usage frequencies of the entire genome of E. coli K-12-MG1655 (http://www.kazusa.or.jp/codon/) as a reference. Three independent sets of E. coli K-12 sequences with their estimated mutation rates (μ) were selected: (i) MLST analysis (this work), (ii) lacI and his operons (55), and (iii) a collection of randomly distributed genes (56). The CAI-log μ representation of these genes allowed us to infer a lineal regression (r2 > 0.99) which was used to extrapolate μ from the CAI of the different sets of cas genes (cas-E1, cas-E2, and cas-F).
Statistical analyses.
Analysis of variance (ANOVA) tests were performed using SPSS software version 17.0 (SPSS 111 Inc., Chicago, IL). A P value of less than 0.05 was considered significant.
SUPPLEMENTAL MATERIAL
Tree of the E. fergusonii ATCC 35469, E. coli, and Shigella strains used in this study, based on the spacer groupings of the CRISPR2.1, CRISPR2.3, and CRISPR4 arrays. MLST groups of the ECOR strains, as designated in a previous work (O. Tenaillon, D. Skurnik, B. Picard, E. Denamur, Nat. Rev. Microbiol. 8:207–217, 2010), are indicated in parentheses and colored as described for Fig. 1 and 2. Strains EC03, EC08, and EC09 are not included due to lack of data for at least one CRISPR array. Download
Tree showing the phylogenetic relationships of the E. fergusonii ATCC 35469, E. coli, and Shigella strains used in this study, based on established MLST sequences (T. Wirth, D. Falush, R. Lan, F. Colles, P. Mensa, L. H. Wieler, H. Karch, P. R. Reeves, M. C. Maiden, H. Ochman, M. Achtman, Mol. Microbiol. 60:1136–1151, 2006; F. Jaureguy, L. Landraud, V. Passet, L. Diancourt, E. Frapy, G. Guigon, E. Carbonnelle, O. Lortholary, O. Clermont, E. Denamur, B. Picard, X. Nassif, S. Brisse, BMC Genomics 9:560, 2008). MLST groups of the ECOR strains, as designated by a previous work (O. Tenaillon, D. Skurnik, B. Picard, E. Denamur, Nat. Rev. Microbiol. 8:207–217, 2010), are indicated in parentheses and colored as described for Fig. 1 and 2. Spacer groups, when defined, are shown in adjacent columns for CRISPR2.1 (2.1), CRISPR2.3 or CRISPR2.2-3 (2.3), CRISPR4.1 (4.1), and CRISPR4.2 (4.2). (U) Arrays with unique spacers. ND, not determined. Dashes, not present or not applicable. Download
Recombinational events predicted for cas-E genes of selected strains. Regions where recombination was not detected are shown in yellow, while zones having undergone such occurrences are distinctively indicated. Recombinational fragments and cas-E genes are drawn to scale. Download
WebLogos generated by the alignment of repeat-proximal 96-nucleotide (nt) leader sequences of the CRISPR-I loci corresponding to cas-E variants E1 (top) and E2 (bottom). The leaders included are from the sequenced Escherichia and Shigella strains used in this work. Download
WebLogos generated by the alignment of the repeat-proximal 96-nt leader sequences of the CRISPR-II loci corresponding to the cas-E variants E1 (top) and E2 (middle) as well as the cas-lacking strains (bottom). The leaders included are from the sequenced Escherichia and Shigella strains used in this work. Download
Schematic depiction of the structural diversity of the CRISPR-III loci of representative E. coli and related strains. The leader (L), CRISPR units (rhombi; spacers are not shown), and cas and adjacent genes (arrows point toward their direction of transcription) are distinctly colored and identified in the upper text line. Regions exclusive of a single strain are labeled within them. An intercalated “//” between the rhombi indicates a number of repeats equal to or greater than the one represented. A putative truncated repeat is shown as a green triangle in Salmonella enterica. Drawings are not scaled. Download
Affiliation to CRISPR-Cas element groups of the strains under study.
ACKNOWLEDGMENTS
This work was funded by the Ministerio de Economía y Competitividad (BIO2011-24417).
We are grateful to Manuel Martínez-García for critical reading of the manuscript.
Footnotes
Citation Almendros C, Mojica FJM, Díez-Villaseñor C, Guzmán NM, García-Martínez J. 2014. CRISPR-Cas functional module exchange in Escherichia coli. mBio 5(1):e00767-13. doi:10.1128/mBio.00767-13.
REFERENCES
- 1. Mojica FJ, Díez-Villaseñor C, Soria E, Juez G. 2000. Biological significance of a family of regularly spaced repeats in the genomes of Archaea, Bacteria and mitochondria. Mol. Microbiol. 36:244–246 [DOI] [PubMed] [Google Scholar]
- 2. Jansen R, Embden JD, Gaastra W, Schouls LM. 2002. Identification of genes that are associated with DNA repeats in prokaryotes. Mol. Microbiol. 43:1565–1575 [DOI] [PubMed] [Google Scholar]
- 3. Babu M, Beloglazova N, Flick R, Graham C, Skarina T, Nocek B, Gagarinova A, Pogoutse O, Brown G, Binkowski A, Phanse S, Joachimiak A, Koonin EV, Savchenko A, Emili A, Greenblatt J, Edwards AM, Yakunin AF. 2011. A dual function of the CRISPR–Cas system in bacterial antivirus immunity and DNA repair. Mol. Microbiol. 79:484–502 [DOI] [PMC free article] [PubMed] [Google Scholar]
- 4. Cady KC, O’Toole GA. 2011. Non-identity-mediated CRISPR-bacteriophage interaction mediated via the Csy and Cas3 proteins. J. Bacteriol. 193:3433–3445 [DOI] [PMC free article] [PubMed] [Google Scholar]
- 5. Mojica FJ, Ferrer C, Juez G, Rodríguez-Valera F. 1995. Long stretches of short tandem repeats are present in the largest replicons of the Archaea Haloferax mediterranei and Haloferax volcanii and could be involved in replicon partitioning. Mol. Microbiol. 17:85–93 [DOI] [PubMed] [Google Scholar]
- 6. Viswanathan P, Murphy K, Julien B, Garza AG, Kroos L. 2007. Regulation of dev, an operon that includes genes essential for Myxococcus xanthus development and CRISPR-associated genes and repeats. J. Bacteriol. 189:3738–3750 [DOI] [PMC free article] [PubMed] [Google Scholar]
- 7. Barrangou R, Fremaux C, Deveau H, Richards M, Boyaval P, Moineau S, Romero DA, Horvath P. 2007. CRISPR provides acquired resistance against viruses in prokaryotes. Science 315:1709–1712 [DOI] [PubMed] [Google Scholar]
- 8. Marraffini LA, Sontheimer EJ. 2010. CRISPR interference: RNA-directed adaptive immunity in bacteria and archaea. Nat. Rev. Genet. 11:181–190 [DOI] [PMC free article] [PubMed] [Google Scholar]
- 9. Westra ER, van Erp PB, Künne T, Wong SP, Staals RH, Seegers CL, Bollen S, Jore MM, Semenova E, Severinov K, de Vos WM, Dame RT, de Vries R, Brouns SJ, van der Oost J. 2012. CRISPR immunity relies on the consecutive binding and degradation of negatively supercoiled invader DNA by Cascade and Cas3. Mol. Cell 46:595–605 [DOI] [PMC free article] [PubMed] [Google Scholar]
- 10. Wiedenheft B, Sternberg SH, Doudna JA. 2012. RNA-guided genetic silencing systems in bacteria and archaea. Nature 482:331–338 [DOI] [PubMed] [Google Scholar]
- 11. Brouns SJ, Jore MM, Lundgren M, Westra ER, Slijkhuis RJ, Snijders AP, Dickman MJ, Makarova KS, Koonin EV, van der Oost J. 2008. Small CRISPR RNAs guide antiviral defense in prokaryotes. Science 321:960–964 [DOI] [PMC free article] [PubMed] [Google Scholar]
- 12. Carte J, Wang R, Li H, Terns RM, Terns MP. 2008. Cas6 is an endoribonuclease that generates guide RNAs for invader defense in prokaryotes. Genes Dev. 22:3489–3496 [DOI] [PMC free article] [PubMed] [Google Scholar]
- 13. Garneau JE, Dupuis ME, Villion M, Romero DA, Barrangou R, Boyaval P, Fremaux C, Horvath P, Magadán AH, Moineau S. 2010. The CRISPR/Cas bacterial immune system cleaves bacteriophage and plasmid DNA. Nature 468:67–71 [DOI] [PubMed] [Google Scholar]
- 14. Swarts DC, Mosterd C, van Passel MW, Brouns SJ. 2012. CRISPR interference directs strand specific spacer acquisition. PLoS One 7:e35888. 10.1371/journal.pone.0035888 [DOI] [PMC free article] [PubMed] [Google Scholar]
- 15. Yosef I, Goren MG, Qimron U. 2012. Proteins and DNA elements essential for the CRISPR adaptation process in Escherichia coli. Nucleic Acids Res. 40:5569–5576 [DOI] [PMC free article] [PubMed] [Google Scholar]
- 16. Horvath P, Romero DA, Coûté-Monvoisin AC, Richards M, Deveau H, Moineau S, Boyaval P, Fremaux C, Barrangou R. 2008. Diversity, activity, and evolution of CRISPR loci in Streptococcus thermophilus. J. Bacteriol. 190:1401–1413 [DOI] [PMC free article] [PubMed] [Google Scholar]
- 17. McGhee GC, Sundin GW. 2012. Erwinia amylovora CRISPR elements provide new tools for evaluating strain diversity and for microbial source tracking. PLoS One 7:e41706. 10.1371/journal.pone.0041706 [DOI] [PMC free article] [PubMed] [Google Scholar]
- 18. Rezzonico F, Smits TH, Duffy B. 2011. Diversity, evolution, and functionality of clustered regularly interspaced short palindromic repeat (CRISPR) regions in the fire blight pathogen Erwinia amylovora. Appl. Environ. Microbiol. 77:3819–3829 [DOI] [PMC free article] [PubMed] [Google Scholar]
- 19. Díez-Villaseñor C, Almendros C, García-Martínez J, Mojica FJ. 2010. Diversity of CRISPR loci in Escherichia coli. Microbiology 156:1351–1361 [DOI] [PubMed] [Google Scholar]
- 20. Touchon M, Charpentier S, Clermont O, Rocha EP, Denamur E, Branger C. 2011. CRISPR distribution within the Escherichia coli species is not suggestive of immunity-associated diversifying selection. J. Bacteriol. 193:2460–2467 [DOI] [PMC free article] [PubMed] [Google Scholar]
- 21. Makarova KS, Haft DH, Barrangou R, Brouns SJ, Charpentier E, Horvath P, Moineau S, Mojica FJ, Wolf YI, Yakunin AF, van der Oost J, Koonin EV. 2011. Evolution and classification of the CRISPR-Cas systems. Nat. Rev. Microbiol. 9:467–477 [DOI] [PMC free article] [PubMed] [Google Scholar]
- 22. Kunin V, Sorek R, Hugenholtz P. 2007. Evolutionary conservation of sequence and secondary structures in CRISPR repeats. Genome Biol. 8:R61. 10.1186/gb-2007-8-4-r61 [DOI] [PMC free article] [PubMed] [Google Scholar]
- 23. Mojica FJ, Díez-Villaseñor C, García-Martínez J, Almendros C. 2009. Short motif sequences determine the targets of the prokaryotic CRISPR defence system. Microbiology 155:733–740 [DOI] [PubMed] [Google Scholar]
- 24. Pougach K, Semenova E, Bogdanova E, Datsenko KA, Djordjevic M, Wanner BL, Severinov K. 2010. Transcription, processing and function of CRISPR cassettes in Escherichia coli. Mol. Microbiol. 77:1367–1379 [DOI] [PMC free article] [PubMed] [Google Scholar]
- 25. Pul U, Wurm R, Arslan Z, Geissen R, Hofmann N, Wagner R. 2010. Identification and characterization of E. coli CRISPR-cas promoters and their silencing by H-NS. Mol. Microbiol. 75:1495–1512 [DOI] [PubMed] [Google Scholar]
- 26. Westra ER, Pul U, Heidrich N, Jore MM, Lundgren M, Stratmann T, Wurm R, Raine A, Mescher M, Van Heereveld L, Mastop M, Wagner EG, Schnetz K, Van Der Oost J, Wagner R, Brouns SJ. 2010. H-NS-mediated repression of CRISPR-based immunity in Escherichia coli K12 can be relieved by the transcription activator LeuO. Mol. Microbiol. 77:1380–1393 [DOI] [PubMed] [Google Scholar]
- 27. Touchon M, Charpentier S, Pognard D, Picard B, Arlet G, Rocha EP, Denamur E, Branger C. 2012. Antibiotic resistance plasmids spread among natural isolates of Escherichia coli in spite of CRISPR elements. Microbiology 158:2997–3004 [DOI] [PubMed] [Google Scholar]
- 28. Almendros C, Guzmán NM, Díez-Villaseñor C, García-Martínez J, Mojica FJ. 2012. Target motifs affecting natural immunity by a constitutive CRISPR-Cas system in Escherichia coli. PLoS One 7:e50797. 10.1371/journal.pone.0050797 [DOI] [PMC free article] [PubMed] [Google Scholar]
- 29. Mojica FJ, Díez-Villaseñor C. 2010. The on-off switch of CRISPR immunity against phages in Escherichia coli. Mol. Microbiol. 77:1341–1345 [DOI] [PubMed] [Google Scholar]
- 30. Ochman H, Selander RK. 1984. Standard reference strains of Escherichia coli from natural populations. J. Bacteriol. 157:690–693 [DOI] [PMC free article] [PubMed] [Google Scholar]
- 31. Tenaillon O, Skurnik D, Picard B, Denamur E. 2010. The population genetics of commensal Escherichia coli. Nat. Rev. Microbiol. 8:207–217 [DOI] [PubMed] [Google Scholar]
- 32. Fricke WF, Wright MS, Lindell AH, Harkins DM, Baker-Austin C, Ravel J, Stepanauskas R. 2008. Insights into the environmental resistance gene pool from the genome sequence of the multidrug-resistant environmental isolate Escherichia coli SMS-3-5. J. Bacteriol. 190:6779–6794 [DOI] [PMC free article] [PubMed] [Google Scholar]
- 33. Jin Q, Yuan Z, Xu J, Wang Y, Shen Y, Lu W, Wang J, Liu H, Yang J, Yang F, Zhang X, Zhang J, Yang G, Wu H, Qu D, Dong J, Sun L, Xue Y, Zhao A, Gao Y, Zhu J, Kan B, Ding K, Chen S, Cheng H, Yao Z, He B, Chen R, Ma D, Qiang B, Wen Y, Hou Y, Yu J. 2002. Genome sequence of Shigella flexneri 2a: insights into pathogenicity through comparison with genomes of Escherichia coli K12 and O157. Nucleic Acids Res. 30:4432–4441 [DOI] [PMC free article] [PubMed] [Google Scholar]
- 34. Yang F, Yang J, Zhang X, Chen L, Jiang Y, Yan Y, Tang X, Wang J, Xiong Z, Dong J, Xue Y, Zhu Y, Xu X, Sun L, Chen S, Nie H, Peng J, Xu J, Wang Y, Yuan Z, Wen Y, Yao Z, Shen Y, Qiang B, Hou Y, Yu J, Jin Q. 2005. Genome dynamics and diversity of Shigella species, the etiologic agents of bacillary dysentery. Nucleic Acids Res. 33:6445–6458 [DOI] [PMC free article] [PubMed] [Google Scholar]
- 35. Horvath P, Barrangou R. 2010. CRISPR/Cas, the immune system of Bacteria and Archaea. Science 327:167–170 [DOI] [PubMed] [Google Scholar]
- 36. Sapranauskas R, Gasiunas G, Fremaux C, Barrangou R, Horvath P, Siksnys V. 2011. The Streptococcus thermophilus CRISPR/Cas system provides immunity in Escherichia coli. Nucleic Acids Res. 39:9275–9282 [DOI] [PMC free article] [PubMed] [Google Scholar]
- 37. Jaureguy F, Landraud L, Passet V, Diancourt L, Frapy E, Guigon G, Carbonnelle E, Lortholary O, Clermont O, Denamur E, Picard B, Nassif X, Brisse S. 2008. Phylogenetic and genomic diversity of human bacteremic Escherichia coli strains. BMC Genomics 9:560. 10.1186/1471-2164-9-560 [DOI] [PMC free article] [PubMed] [Google Scholar]
- 38. Wirth T, Falush D, Lan R, Colles F, Mensa P, Wieler LH, Karch H, Reeves PR, Maiden MC, Ochman H, Achtman M. 2006. Sex and virulence in Escherichia coli: an evolutionary perspective. Mol. Microbiol. 60:1136–1151 [DOI] [PMC free article] [PubMed] [Google Scholar]
- 39. Lapointe FJ, Legendre P. 1992. Statistical significance of the matrix correlation coefficient for comparing independent phylogenetic trees. Syst. Biol. 41:378–384 [Google Scholar]
- 40. Shah SA, Garrett RA. 2011. CRISPR/Cas and Cmr modules, mobility and evolution of adaptive immune systems. Res. Microbiol. 162:27–38 [DOI] [PubMed] [Google Scholar]
- 41. Walk ST, Alm EW, Gordon DM, Ram JL, Toranzos GA, Tiedje JM, Whittam TS. 2009. Cryptic lineages of the genus Escherichia. Appl. Environ. Microbiol. 75:6534–6544 [DOI] [PMC free article] [PubMed] [Google Scholar]
- 42. Sharp PM, Li WH. 1987. The codon adaptation index--a measure of directional synonymous codon usage bias, and its potential applications. Nucleic Acids Res. 15:1281–1295 [DOI] [PMC free article] [PubMed] [Google Scholar]
- 43. Henry I, Sharp PM. 2007. Predicting gene expression level from codon usage bias. Mol. Biol. Evol. 24:10–12 [DOI] [PubMed] [Google Scholar]
- 44. Lawrence JG, Ochman H. 1997. Amelioration of bacterial genomes: rates of change and exchange. J. Mol. Evol. 44:383–397 [DOI] [PubMed] [Google Scholar]
- 45. Marri PR, Golding GB. 2008. Gene amelioration demonstrated: the journey of nascent genes in bacteria. Genome 51:164–168 [DOI] [PubMed] [Google Scholar]
- 46. Gerdes K, Larsen JE, Molin S. 1985. Stable inheritance of plasmid R1 requires two different loci. J. Bacteriol. 161:292–298 [DOI] [PMC free article] [PubMed] [Google Scholar]
- 47. Mira A, Pushker R, Rodríguez-Valera F. 2006. The Neolithic revolution of bacterial genomes. Trends Microbiol. 14:200–206 [DOI] [PubMed] [Google Scholar]
- 48. Perna NT. 2011. Genomics of Escherichia and Shigella, p 119–139 In Wiedmann M, Zhang W. (ed), Genomics of foodborne bacterial pathogens. Food microbiology and food safety. Springer Science; & Business Media, New York, NY. 10.1007/978-1-4419-7686-4_5 [DOI] [Google Scholar]
- 49. Puigbò P, Bravo IG, Garcia-Vallve S. 2008. CAIcal: a combined set of tools to assess codon usage adaptation. Biol. Direct 3:38. 10.1186/1745-6150-3-38 [DOI] [PMC free article] [PubMed] [Google Scholar]
- 50. Touchon M, Rocha EP. 2010. The small, slow and specialized CRISPR and anti-CRISPR of Escherichia and Salmonella. PLoS One 5:e11126. 10.1371/journal.pone.0011126 [DOI] [PMC free article] [PubMed] [Google Scholar]
- 51. Díez-Villaseñor C, Guzmán NM, Almendros C, García-Martínez J, Mojica FJ. 2013. CRISPR-spacer integration reporter plasmids reveal distinct genuine acquisition specificities among CRISPR-Cas I-E variants of Escherichia coli. RNA Biol. 10:57–67 [DOI] [PMC free article] [PubMed] [Google Scholar]
- 52. Eyre-Walker A, Keightley PD. 2007. The distribution of fitness effects of new mutations. Nat. Rev. Genet. 8:610–618 [DOI] [PubMed] [Google Scholar]
- 53. Chong P, Hui I, Loo T, Gillam S. 1985. Structural analysis of a new GC-specific insertion element IS186. FEBS Lett. 192:47–52 [DOI] [PubMed] [Google Scholar]
- 54. Tamura K, Dudley J, Nei M, Kumar S. 2007. MEGA4: molecular evolutionary genetics analysis (MEGA) software version 4.0. Mol. Biol. Evol. 24:1596–1599 [DOI] [PubMed] [Google Scholar]
- 55. Drake JW. 1991. A constant rate of spontaneous mutation in DNA-based microbes. Proc. Natl. Acad. Sci. U. S. A. 88:7160–7164 [DOI] [PMC free article] [PubMed] [Google Scholar]
- 56. Elena SF, Whittam TS, Winkworth CL, Riley MA, Lenski RE. 2005. Genomic divergence of Escherichia coli strains: evidence for horizontal transfer and variation in mutation rates. Int. Microbiol. 8:271–278 [PubMed] [Google Scholar]
Associated Data
This section collects any data citations, data availability statements, or supplementary materials included in this article.
Supplementary Materials
Tree of the E. fergusonii ATCC 35469, E. coli, and Shigella strains used in this study, based on the spacer groupings of the CRISPR2.1, CRISPR2.3, and CRISPR4 arrays. MLST groups of the ECOR strains, as designated in a previous work (O. Tenaillon, D. Skurnik, B. Picard, E. Denamur, Nat. Rev. Microbiol. 8:207–217, 2010), are indicated in parentheses and colored as described for Fig. 1 and 2. Strains EC03, EC08, and EC09 are not included due to lack of data for at least one CRISPR array. Download
Tree showing the phylogenetic relationships of the E. fergusonii ATCC 35469, E. coli, and Shigella strains used in this study, based on established MLST sequences (T. Wirth, D. Falush, R. Lan, F. Colles, P. Mensa, L. H. Wieler, H. Karch, P. R. Reeves, M. C. Maiden, H. Ochman, M. Achtman, Mol. Microbiol. 60:1136–1151, 2006; F. Jaureguy, L. Landraud, V. Passet, L. Diancourt, E. Frapy, G. Guigon, E. Carbonnelle, O. Lortholary, O. Clermont, E. Denamur, B. Picard, X. Nassif, S. Brisse, BMC Genomics 9:560, 2008). MLST groups of the ECOR strains, as designated by a previous work (O. Tenaillon, D. Skurnik, B. Picard, E. Denamur, Nat. Rev. Microbiol. 8:207–217, 2010), are indicated in parentheses and colored as described for Fig. 1 and 2. Spacer groups, when defined, are shown in adjacent columns for CRISPR2.1 (2.1), CRISPR2.3 or CRISPR2.2-3 (2.3), CRISPR4.1 (4.1), and CRISPR4.2 (4.2). (U) Arrays with unique spacers. ND, not determined. Dashes, not present or not applicable. Download
Recombinational events predicted for cas-E genes of selected strains. Regions where recombination was not detected are shown in yellow, while zones having undergone such occurrences are distinctively indicated. Recombinational fragments and cas-E genes are drawn to scale. Download
WebLogos generated by the alignment of repeat-proximal 96-nucleotide (nt) leader sequences of the CRISPR-I loci corresponding to cas-E variants E1 (top) and E2 (bottom). The leaders included are from the sequenced Escherichia and Shigella strains used in this work. Download
WebLogos generated by the alignment of the repeat-proximal 96-nt leader sequences of the CRISPR-II loci corresponding to the cas-E variants E1 (top) and E2 (middle) as well as the cas-lacking strains (bottom). The leaders included are from the sequenced Escherichia and Shigella strains used in this work. Download
Schematic depiction of the structural diversity of the CRISPR-III loci of representative E. coli and related strains. The leader (L), CRISPR units (rhombi; spacers are not shown), and cas and adjacent genes (arrows point toward their direction of transcription) are distinctly colored and identified in the upper text line. Regions exclusive of a single strain are labeled within them. An intercalated “//” between the rhombi indicates a number of repeats equal to or greater than the one represented. A putative truncated repeat is shown as a green triangle in Salmonella enterica. Drawings are not scaled. Download
Affiliation to CRISPR-Cas element groups of the strains under study.