Abstract
An achromatic stimulus is defined as a patch of light that is devoid of any hue. This is usually achieved by asking observers to adjust the stimulus such that it looks neither red nor green and at the same time neither yellow nor blue. Despite the theoretical and practical importance of the achromatic locus, little is known about the variability in these settings. The main purpose of the current study was to evaluate whether achromatic settings were dependent on the task of the observers, namely the navigation direction in color space. Observers could either adjust the test patch along the two chromatic axes in the CIE u*v* diagram or, alternatively, navigate along the unique-hue lines. Our main result is that the navigation method affects the reliability of these achromatic settings. Observers are able to make more reliable achromatic settings when adjusting the test patch along the directions defined by the four unique hues as opposed to navigating along the main axes in the commonly used CIE u*v* chromaticity plane. This result holds across different ambient viewing conditions (Dark, Daylight, Cool White Fluorescent) and different test luminance levels (5, 20, and 50 cd/m2). The reduced variability in the achromatic settings is consistent with the idea that internal color representations are more aligned with the unique-hue lines than the u* and v* axes.
Keywords: achromatic, unique hues, color constancy, luminance, color space
Introduction
An achromatic stimulus is defined as a patch of light that is devoid of any hue. This is usually achieved by asking observers to adjust the stimulus such that it looks neither red nor green and at the same time neither yellow nor blue. In terms of opponent-color theory, both chromatic opponent mechanisms, the red–green and the yellow–blue mechanisms, are at equilibrium if a color-normal observer views such an achromatic stimulus. The output of the chromatic channels is hypothesized to be at zero since no hue is perceived in such a stimulus. The idea that the chromatic system is at a “resting state” at the achromatic locus has led to the use of the achromatic point as a means to scale the cone fundamentals (Bompas, Powell, & Sumner, 2013; Walraven & Werner, 1991). Experimentally, settings of the achromatic loci are widely used to establish the effect of illumination or to assess spatial or temporal context effects (see, e.g., Doerschner, Boyaci, & Maloney, 2004; Lee, Dawson, & Smithson, 2012). The extent of invariance of these achromatic settings depends on the spatial configuration, the chromaticity of the background and the ambient illumination (Bauml, 2002; Brainard, 1998; Delahunt & Brainard, 2004; Helson & Michels, 1948), eye fixation (Granzier, Toscani, & Gegenfurtner, 2012), viewing pattern (Golz, 2010), and the precise task instructions (Ekroll, Faul, Niederée, & Richter, 2002). The purpose of the current study was to evaluate whether achromatic settings were dependent on one particular task aspect, namely the navigation direction in color space. It focuses on the reliability of the achromatic settings across and within observers; virtually all experiments using achromatic settings make the implicit assumption that observers are able to consistently navigate in a two-dimensional (or even three-dimensional) color space. Here we test this assumption directly by manipulating the directions in color space along which observers can adjust the stimuli to obtain an achromatic setting. In the first method, observers were able to adjust the stimuli along the two main axes in an approximately uniform CIELUV color space (Wyszecki & Stiles, 1982). We refer to this navigation method as the u*v* method. In the second method, referred to as the UH method, stimuli could be adjusted along the unique hue lines (Hering, 1964). A secondary aim was to evaluate whether these achromatic settings are invariant under changes in ambient illumination. Our main result is that the reliability in the achromatic settings is higher when observers are able to adjust along the unique hue directions; this result generalizes over all three ambient viewing conditions and test luminance levels.
Methodology
Apparatus
Stimuli were generated with the CRS Matlab toolbox on a 14-bit ViSaGe system (Cambridge Research System, Kent, UK) and displayed on the CRT monitor (Mitsubishi DiamondPro 2070). Observer responses were collected using a CB6 response box (Cambridge Research System, Kent, UK). The monitor was calibrated using the ColourCal calibration device (Cambridge Research System, Kent, UK). The CIE chromaticity coordinates and luminance of the phosphors at peak output were as follows: red = (0.629, 0.3421, 25.4 cd/m2); green = (0.290, 0.605, 65.5 cd/m2); blue = (0.148, 0.070, 11.2 cd/m2). The monitor was switched on at least 30 min before the start of the experiment to ensure a stable luminance output.
A GTI ColorMatcher GLE M5/25 installed on the ceiling in the center of a booth was used to provide two lighting conditions (Xiao, Fu, Mylonas, Karatzas, & Wuerger, 2012): a D65 simulator for daylight (Correlated Colour Temperature [CCT] = 6376 K; x = 0.312; y = 0.334; 41 cd/m2) and Cool White Fluorescent (CWF) for typical white fluorescent office light (CCT = 3747 K; x = 0.394; y = 0.387; 136 cd/m2). In addition, we included a dark condition where the only source of illumination was the test patch on the CRT screen. The inside of the booth was painted dark gray, reflecting very little light.
The peak output of the monitor was measured under all three ambient viewing conditions (Dark, D65, CWF). Due to the small amount of ambient light reflected from the CRT display, the transformation matrices from RGB to XYZ vary slightly under the different viewing conditions. These small differences have been taken into account in the computation of the u′v′ coordinates.
Observers
Thirty subjects (18 women and 12 men; mean age: 24.24 years; age range: 18–60 years) participated in the experiment. All participants had their color vision assessed using the Cambridge Colour Test (Regan, Reffin, & Mollon, 1994) and were found to be color normal.
Experimental procedure
We investigated the effect of three variables on the achromatic locus: the navigation direction in color space (u*v* method or UH method), which was the main manipulation; the luminance level of the stimuli (5, 20, and 50 cd/m2); and the ambient illumination condition (Dark, D65, and CWF). Each participant repeated each achromatic setting three times; in the course of the complete experiment, each of the 30 observers therefore made 54 achromatic settings (3 illumination conditions × 3 luminance levels × 2 navigation methods × 3 repetitions).
Achromatic settings under the different ambient illumination conditions were obtained in separate blocks, which were run in the order Dark, D65, and CWF. The background of the monitor was set to black throughout all experiments. The observer adapted for at least 5 min to the prevailing illumination to ensure steady adaptation. Within each block, the order of the navigation direction (which is our main variable) was balanced: Half the observers first conducted the u*v* task followed by the UH task; the other half ran the experiments in the reverse order. This ensured that learning effects would not differentially bias the achromatic settings in one of the two tasks.
Each block (i.e., fixed ambient-illumination condition) lasted about 15–20 min; hence, the entire set of experiments lasted between 45 min and 1 hr for each observer, including pre-experiment adaptation and a short break between the different illumination conditions. Observers were compensated for their time with a small fee.
Each trial started with an initial color, which was chosen randomly from a predefined radius of eight colors at distances of ∼25 u*v* units around the point (0, −5) in the u*-v* plane. The choice of this central point is to some extent arbitrary. We chose this point at x = 0.289, y = 0.298, since this was the background chromaticity used in previous unique-hue experiments (Wuerger, 2013). The CIE x- and y-coordinates of the eight starting values were as follows: (0.3908, 0.3006), (0.4079, 0.3587), (0.3947, 0.4148), (0.3458, 0.4433), (0.2765, 0.4273), (0.1869, 0.3159), (0.2018, 0.2244), (0.2936, 0.2110). On each trial, the observer was asked to adjust the color of a central circular ∼2.6° patch such that it contained neither red nor green and neither yellow nor blue. The participant could make these adjustments along four directions in color space by pressing one of four buttons on the response box. These buttons roughly controlled movement along the red–green and yellow–blue directions (see details later), that is, pressing the red button reduced the level of red in the test patch, pressing the green button reduced the level of green, and so on. There was no time limit, and observers could switch back and forth between the two chromatic axes. When the observer was satisfied with his or her choice, he or she pressed a fifth button and the next trial started.
To statistically evaluate the effects of all three variables, a multivariate analysis of variance (MANOVA; SPSS Version 20) was performed with the dependent variable being the two-dimensional coordinates in the u′v′ chromaticity diagram. A MANOVA is most efficient for moderately correlated dependent variables (Stevens, 2012); in the data reported here, the correlations varied from 0.2 to 0.8, which is in line with the range of recommended correlations (0.3–0.7). Subsequently, post hoc comparisons were performed with correction for multiple comparisons.
Navigation directions in color space
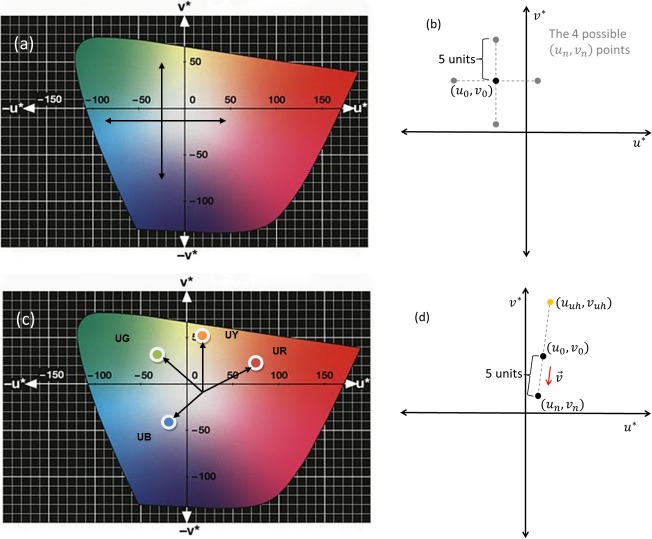
The main manipulation was the navigation direction in color space: To find an achromatic setting, the observers could adjust the stimuli either along the two axes (u*, v*) of the standard CIE LUV color space (denoted the u*v* task; see Figure 1a) or along the unique-hue directions (denoted the UH task; see Figure 1c). The unique-hue lines we used were based on the unique-hue settings of 185 color-normal observers (Wuerger, 2013) and were obtained using a hue-selection task (Wuerger, Atkinson, & Cropper, 2005). In this large sample, the interobserver variability exceeded the intraobserver variability by a factor of 2 (details on observer variability are in Xiao, Wuerger, Fu, & Karatzas, 2011, table II). Interobserver perceptual errors (expressed in δE00) for the four unique hues range from 1.2 to 2.3. We therefore considered the interobserver variability sufficiently small to use the same directions for all observers. If anything, unique-hue directions not optimized for each individual observer should result in less pronounced task differences and thereby underestimate the effect of navigation direction.
Figure 1.
Navigation direction in color space. (a) The u*v* method: Observers navigate along the axes in the u*v* chromaticity diagram. (b) The step size is 5 units in u*v* space. After each response, the color is updated along the relevant direction and the updated setting is used as the new starting value for the next iteration. (c) The UH method: Observers navigate along the directions of the unique hues. (d) The step size for the UH task is again 5 u*v* units, but now the adjustment is made in one of the directions defined by the unique hues. The updated setting is used as the new starting value for the next iteration.
Both tasks in the current experiment were cancellation tasks, that is, the color directions chosen by the observers were used to cancel color from the stimulus to obtain the subsequent stimulus. Figure 1b and d describes how the stimulus was updated after each observer's response. For both navigation directions, the step size in u*v* space was fixed to 5 units, which corresponds roughly to a distance of 0.007 in the u′v′ diagram. This step size has been derived from extensive preliminary studies with the authors as experienced observers; it is well below the discrimination threshold around a typical CRT white point obtained for color-normal observers (Regan et al., 1994). Within each trial, the luminance level of the test patch was fixed and observers could adjust only the chromaticity of the patch.
For the u*v* method (Figure 1b), the starting value for the chromaticity of the test patch might be at (u0, v0), for example. The next color stimulus (un, vn) was calculated by moving 5 units from the initial point (uo, v0) along one of the four directions determined by the axes of the u*-v* plane. The direction was chosen by the participants by pressing one of four buttons. In response to the button press, the test patch was updated accordingly (as shown in Figure 1b).
In the UH method (Figure 1d), the step size was also 5 u*v* units, but now the direction of change was calculated as follows: First, the directional vector v⃗ from the chosen unique hue (uuh, vuh) to the initial color (u0, v0) was computed:
 |
The new stimulus (at iteration n) was then defined as the point lying at a distance of 5 units from the initial color in the direction v⃗:
 |
An example is shown in Figure 1d, where the initial point is assumed to be at (u0, v0) and the participant cancels unique yellow, that is, yellow is reduced in the stimulus. Since the L* values always remain constant (at L0) in this process, the new color stimulus is at (L0, un, vn). This new color is then the starting point for the next iteration. This procedure was repeated until the participant confirmed that according to him or her, the stimulus displayed on the screen was achromatic, that is, contained neither red nor green and neither yellow nor blue.
During the experiment, the display RGB values of the final achromatic settings selected by the participants were automatically saved. Subsequently, they were transformed to CIE XYZ tristimulus values using the calibrated display profile that was generated based on color measurements results by a spectroradiometer. To confirm the accuracy of our calibration, the CIE tristimulus values derived from the display profile were compared with the actual measurements; the differences were found to lie within measurement error.
Results
All achromatic settings are presented in the u′v′ chromaticity diagram rather than in the CIE xy chromaticity diagram, since the former is known to be approximately uniform—that is, equal Euclidean distances in u′v′ reflect approximately similar perceptual distances. Approximate uniformity is of relevance for the interpretation of our results, since we will be comparing the intra- and interobserver variability across different navigation methods and illumination conditions (Wuerger, Maloney, & Krauskopf, 1995). We report first the mean achromatic settings and then the effect of the navigation method on the reliability of the achromatic settings.
Mean achromatic settings: Effect of navigation method, ambient illumination, and test luminance level
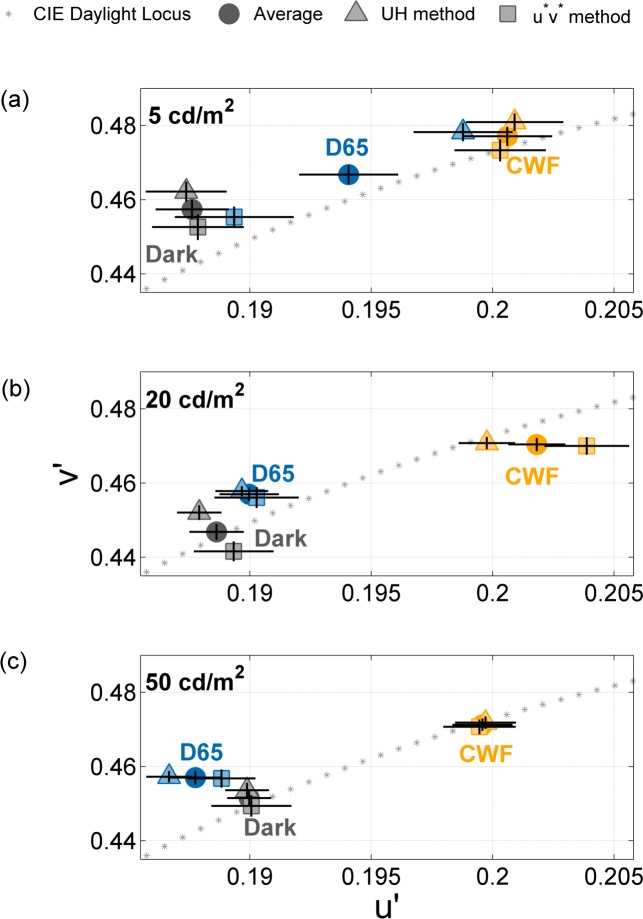
Figure 2 shows the achromatic settings averaged over all observers; error bars denote plus and minus standard error of the mean. We will, in turn, discuss the effect of the navigation method, illumination, and test luminance level on the achromatic loci. As depicted in Figure 2, the achromatic settings depend on the navigation method; achromatic loci obtained with the UH method (▴) differ from the settings obtained with the u*v* method (▪), F(2, 521) = 23.1, p < 0.0001.
Figure 2.
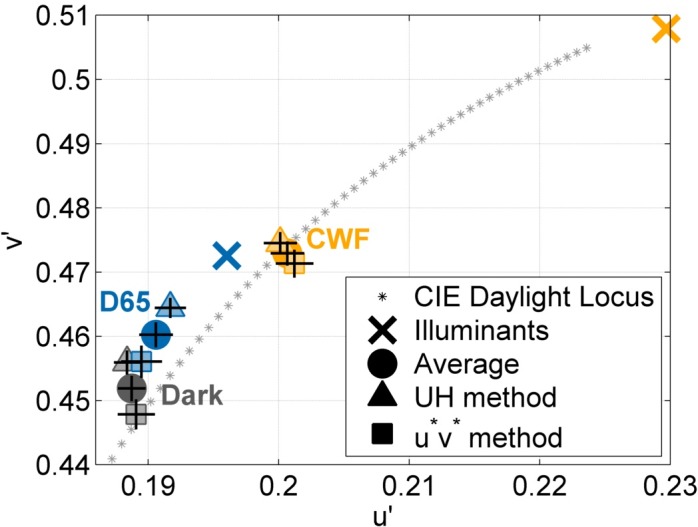
Achromatic loci averaged over all 30 observers and all test luminance levels. Error bars denote ±1 standard error of the mean. Gray symbols denote the mean settings under the Dark viewing condition, blue symbols under the D65 condition, and yellow symbols under the CWF condition. The settings for the UH method and the u*v* method are indicated by ▴ and ▪, respectively, while • denotes the mean setting under each illuminant.
Secondly, ambient illumination affects the achromatic locus by shifting the settings towards the prevailing illumination, F(4, 1,042) = 65.7, p < 0.0001. The filled circles indicate the grand mean settings (averaged over all observers, all test luminance levels, and both navigation methods) for the Dark ( ), D65 (
 ), and CWF (
 ) viewing conditions. When compared to achromatic settings obtained under the Dark viewing conditions (gray symbols), the settings are shifted towards the chromaticity of the prevailing illumination (blue symbols for D65; yellow symbols for CWF). When viewed in the D65 condition (
 ), achromatic settings (
 &
&  ) move along the daylight locus towards D65; similarly, when viewed in the CWF condition (
 ), the achromatic settings (
 &
&  ) move towards the chromaticity of the ambient illumination. Post hoc comparisons revealed that all pairwise differences in the achromatic settings (Dark vs. D65; D65 vs. CWF; CWF vs. Dark) were statistically significant (ps corrected < 0.05).
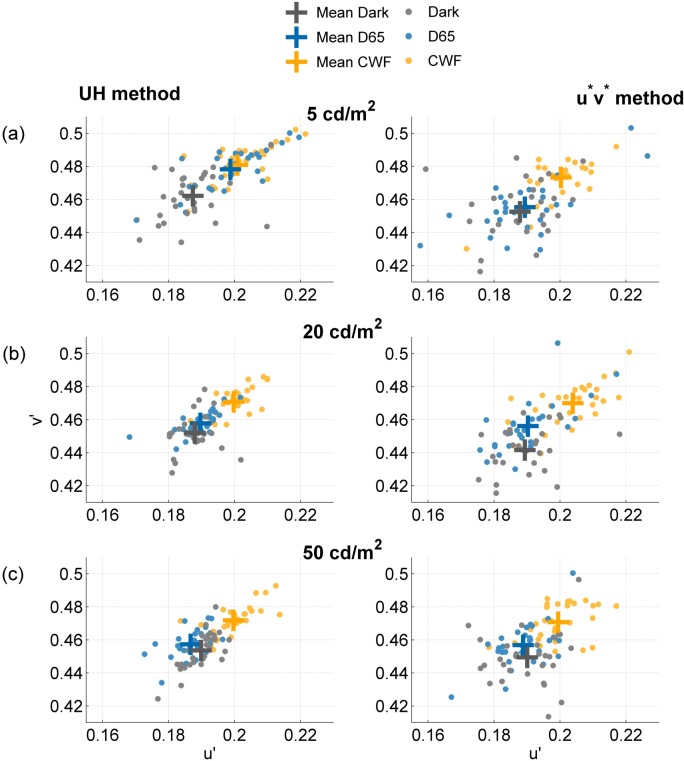
Thirdly, the luminance level of the test patch affects the achromatic settings, F(4, 2,042) = 14.6, p < 0.0001. Figure 3 shows the achromatic settings for all three luminance levels: (a) 5 cd/m2, (b) 20 cd/m2, and (c) 50 cd/m2. Higher luminance level yield less variable results (compare Figure 3c and a), in terms of both observer consistency and the discrepancy between the two navigation methods. At the highest luminance level (Figure 3c; 50 cd/m2), both navigation methods converge on very similar achromatic settings. The effect of test luminance level on the achromatic settings is driven by the differences in v′ under low luminance (5 cd/m2 vs. 20 cd/m2: p < 0.001; 5 cd/m2 vs. 50 cd/m2: p < 0.0001). The larger variability for the achromatic settings at the 5 cd/m2 luminance level is likely to be related to the rod–cone interactions at mesopic light ranges.
Figure 3.
Achromatic settings under stimulus luminance level of (a) 5 cd/m2, (b) 20 cd/m2, and (c) 50 cd/m2. The settings are averaged over the 30 observers, and the same symbols as Figure 2 are used. At the highest luminance level, both navigation methods converge on very similar achromatic settings.
We did not find any effect of learning in our experiments. To evaluate this possibility, we conducted further MANOVAs with session number as a factor. Each neutral gray setting was obtained three times; if learning took place, we would expect to find a difference between these three settings. To test for such a difference, the data were split in three different groups for each of the 18 conditions (3 illuminants × 3 test luminance levels × 2 tasks) before the MANOVAs were run. The results showed no statistically significant dependence on the session number: The 18 MANOVA p values varied between 0.15 and 0.88, none of them significant.
Effect of navigation method on the variability of the achromatic settings
Figure 4 shows in more detail how the navigation method affects the variability of the achromatic settings. Each data point reflects the mean setting for an individual observer, for a particular test luminance level (Figure 4a: 5 cd/m2; b: 20 cd/m2; c: 50 cd/m2) and for both navigation methods (on the left: UH method; on the right: u*v* method). Details of the ambient viewing conditions are as before (see Figure 1). The spread in the data points is larger for the u*v* method compared to the UH method (compare left and right panels in Figure 4); the spread in the settings is also reduced when the test luminance level is increased (compare Figure 4a and c).
Figure 4.
Mean achromatic settings for each observer under a stimulus luminance level of (a) 5 cd/m2, (b) 20 cd/m2, and (c) 50 cd/m2. Gray points denote the Dark condition, blue points denote the D65 condition, and yellow points denote the CWF condition. The observed spread in the settings is larger for the u*v* method (right panel) compared to the UH method (left panel).
To quantify the effect of navigation method and test luminance level on the variability in the settings, we computed both the intraobserver and interobserver variability in the approximately uniform u′v′ chromaticity diagram (Xiao et al., 2012; Xiao et al., 2011). Interobserver variability indicates the extent to which individual observers agree with the average observer, whereas intraobserver variability indicates how consistent the individual observer is across several repetitions. Intraobserver variability is defined as
 |
where n denotes the number of observations for a particular stimulus, (
 ,
,
 ) is the ith observation, and (
 ,
,
 ) is the mean of these n observations. Interobserver variability is calculated similarly:
 |
where m denotes the number of participants, (
 ,
,
 ) is the average setting for the ith participant, and (
 ,
,
 ) is the mean of the average settings for all m observers.
The ratio between inter- and intraobserver variability is an indicator of how consistent the settings are across the sample in relation to the consistency within each observer (Kuehni, 2005). There is a large effect of navigation method on the variability (Table 1): Both inter- and intraobserver variability are much smaller when settings are obtained using the UH method in comparison to the u*v* method. Variability in the UH method is, on an average, just above 70% of the variability in the u*v* method (73% for the intra- and 74% for the interobserver variability). This reduction in variability in the UH method is seen for all test luminance levels but is more pronounced under the Dark viewing condition. The ratio between inter- and intraobserver variability is on average 1.74 and does not depend on the navigation method. This ratio ranges from about 1.5 to 2, indicating a good consistency in the achromatic settings across participants, and is comparable to the ratios found for unique-hue settings (Xiao et al., 2012; Xiao et al., 2011).
Table 1.
Intra- and interobserver variability (expressed in 10-3 units) for the achromatic settings for all three illumination conditions (Dark, D65, and CWF), all three test luminance levels (5, 20, and 50 cd/m2), and both navigation methods (UH method and u*v* method). The ratio between inter- and interobserver variability is independent of the navigation method.
| Dark |
D65 |
CWF |
Avg. over illuminants |
|||||||||
| Intra |
Inter |
Ratio |
Intra |
Inter |
Ratio |
Intra |
Inter |
Ratio |
Intra |
Inter |
Ratio |
|
| UH | ||||||||||||
| 5 cd/m2 | 9.6 | 14.9 | 1.55 | 6 | 14.7 | 2.45 | 6.2 | 13.7 | 2.21 | 7.3 | 14.4 | 1.99 |
| 20 cd/m2 | 6.4 | 9.1 | 1.42 | 4.7 | 7.7 | 1.64 | 5.2 | 8.8 | 1.69 | 5.4 | 8.5 | 1.57 |
| 50 cd/m2 | 5.3 | 10.2 | 1.92 | 5.6 | 8 | 1.43 | 5.4 | 9.3 | 1.72 | 5.4 | 9.2 | 1.69 |
| Lum. avg. | 7.1 | 11.4 | 1.61 | 5.4 | 10.1 | 1.87 | 5.6 | 10.6 | 1.89 | 6 | 10.6 | 1.77 |
| u*v* | ||||||||||||
| 5 cd/m2 | 11.5 | 18.3 | 1.59 | 8.2 | 15.9 | 1.94 | 7.2 | 13.7 | 1.90 | 9 | 16 | 1.78 |
| 20 cd/m2 | 10.2 | 14.7 | 1.44 | 6.7 | 14.1 | 2.10 | 7 | 13.3 | 1.90 | 8 | 14 | 1.76 |
| 50 cd/m2 | 8.8 | 15 | 1.70 | 7.2 | 11.8 | 1.64 | 7.7 | 12.2 | 1.58 | 7.9 | 13 | 1.65 |
| Lum. avg. | 10.2 | 16 | 1.57 | 7.4 | 13.9 | 1.89 | 7.3 | 13.1 | 1.79 | 8.2 | 14.2 | 1.73 |
| Avg. | 8.6 | 13.5 | 1.58 | 6.3 | 11.9 | 1.87 | 6.4 | 11.8 | 1.84 | 7.1 | 12.4 | 1.74 |
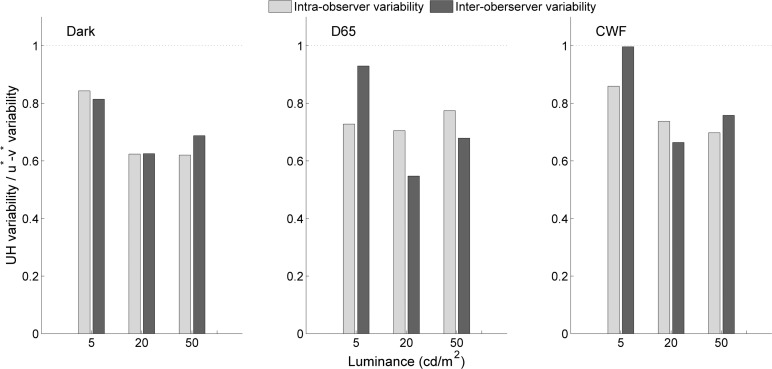
To quantify the reduction in variability, we plotted the ratio between the variability in the UH method and the u*v* method for all conditions (Figure 5). This ratio is always smaller than unity, for both intra- (light bars) and interobserver (dark bars) variability, indicating that the settings are less variable when observers adjust the achromatic locus along the UH directions. This result is not contingent on the choice of u′v′ space; almost identical variability ratios are obtained when using LAB space (Supplementary Figure S1; Supplementary Material).
Figure 5.
The main finding of our study is that the variability in the UH task is always smaller than in the u*v* task. The ratio between the variability in the UH method and the u*v* method is plotted here against the stimulus luminance level (5, 20, and 50 cd/m2). The intraobserver-variability ratios are in light color, while the interobserver-variability ratios are in dark. Each subplot denotes a separate ambient viewing condition (Dark, D65, and CWF). The calculations for these plots are performed in the u′v′ space, but the same effects are found in other color spaces too.
Discussion
The purpose of this study was to evaluate the reliability with which color-normal human observers can perform achromatic settings, that is, adjust a patch of light such that it appears devoid of any hue. We evaluated two different navigation methods in chromaticity planes of constant luminance. Our main finding is that observers' achromatic settings are more reliable (in terms of inter- and intraobserver variability) when they are asked to adjust the light along the unique-hue lines compared to adjustment along the main axes of the commonly used CIE u*v* chromaticity diagram (Figure 5). This effect of navigation method on the variability in the achromatic settings holds across all test luminance levels and ambient illumination conditions. While we have no data using more complex stimuli, we have no reason to believe that this effect of navigation method on the reliability of the achromatic setting depends on the particular spatial structure or viewing condition; instead, we suggest that it is related to the internal representation of the different directions in color space.
Shifts in the achromatic locus under changes in ambient illumination
In comparison to the achromatic settings obtained under the Dark viewing condition, the achromatic loci move towards the chromaticity of the ambient illumination (Figure 6: × indicates a light source). The observed shift (from D65 to CWF) is indicated by a • the predicted shift by ▴. A simple cone-adaptation model fails to predict the achromatic shifts on several accounts. Firstly, while the direction of the shift is accounted for by cone adaptation without assuming any cross talk between the different cone classes (Wuerger, 1996), the observed magnitude of the shift is much smaller, only about 30% of the predicted shift. This is consistent with previous studies showing poor color constancy—on a dark background (Hansen, Walter, & Gegenfurtner, 2007), for increments relative to the background instead of decrements (Helson & Michels, 1948), and with an immediate surround that is not at the chromaticity of the illuminant (Delahunt & Brainard, 2004; Kraft & Brainard, 1999).
Figure 6.
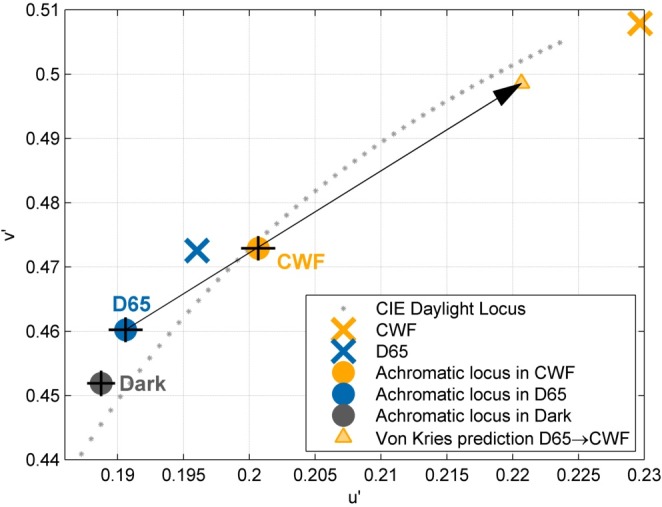
Von Kries prediction for the mean achromatic setting when the ambient illumination changes from D65 to CWF. The observed shift is in the same direction as the predicted shift.
Secondly, consistent with Kuriki's study (2006), we find that the achromatic settings vary with stimulus intensity (Figure 3), which precludes modeling the effect of ambient illumination with cone adaptation where the scaling factors depends only on the cone absorptions of the illuminations. To compare the test-luminance dependency of our achromatic settings with Kuriki's, we performed the same analysis: The relative cone weights (M/L and M/S) were plotted against the luminance in a log-log plot (Supplementary Figure S2; Supplementary Material). It was found that the log-relative cone ratios depend both on the luminance of the test patch and on the ambient illumination. Under D65 viewing, the achromatic settings converge for high luminance values to the settings obtained under the Dark viewing condition, which is in agreement with Kuriki's findings (Figure 4; Kuriki, 2006). This suggests that the achromatic settings become independent of the illumination when the luminance level increases. We found, however, no convergence under CWF (comparable to Kuriki's orange illumination); when observers are adapted to CWF, the test luminance has little effect on the cone ratios, but the cone ratios depend on the ambient illumination. There are important differences between these two studies: The area surrounding Kuriki's test patch was about 10 cd/m2, whereas in our study the background was black; also, in our experiment, no attempt was made to induce an “object mode,” and the observers were aware that the test patch was a self-luminous source.
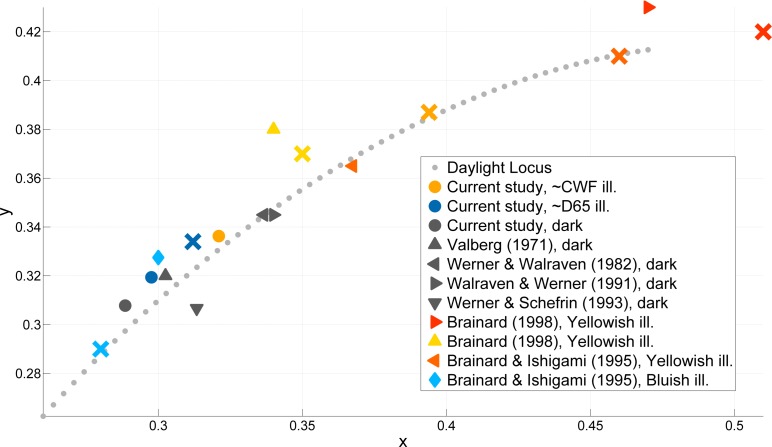
Qualitatively similar shifts have been reported by Brainard and colleagues (Brainard, 1998; Brainard & Ishigami, 1995). Figure 7 shows a comparison of the achromatic loci obtained in the current study ( ,
, , and
, and  ) with those of previous experiments. Although there is some variability in the previously reported achromatic loci, generally, the points for all viewing conditions lie close to the daylight locus. The achromatic points under the Dark viewing condition are close to the equal-energy white point, and shifts introduced by a change in illumination along the daylight locus generally follow the daylight locus (Brainard, 1998; Schefrin & Werner, 1993; Valberg, 1971).
Figure 7.
Mean achromatic settings reported by previous studies, along with those for the current study. The achromatic settings are denoted by symbols as listed in the legend, while the corresponding ambient illuminations are denoted by a × of the same color. The gray dotted line indicates the daylight locus. The achromatic loci for the Dark condition lie close to the equal-energy white point, and illuminant shifts along the daylight locus induce achromatic shifts in the same direction.
Covariation along the daylight locus
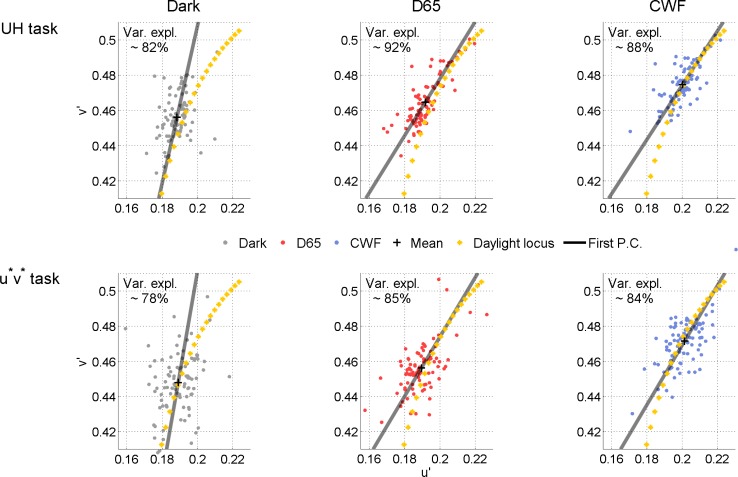
Within a particular condition of illumination and test luminance, the u′v′ settings are not independent (see Figure 4) but are aligned with the daylight locus, as reported by Witzel and colleagues (Witzel, Valkova, Hansen, & Gegenfurtner, 2011). Our principal component analysis (PCA) analysis (shown in Figure 8) confirms their results; the direction of the main covariation (first principal component; solid gray line) is aligned with the daylight locus (dotted line).
Figure 8.
The direction of the first principal component (axis of maximum covariance; thick black line) of the achromatic settings in the u′v′ plane, shown together with the daylight locus (yellow dotted line). The axis of maximum covariance closely follows the daylight locus.
The illuminations used in this experiment are close to the daylight locus (Figure 7); however, it is important to note that the lower variability in the achromatic settings with the UH method is not simply a consequence of the illumination change coinciding with the yellow–blue UH line. Observers were never asked to match achromatic points between illumination conditions; their task was to reach an achromatic point from a randomly chosen starting point for a fixed illumination condition. In most cases, adjusting the test patch along the daylight locus will not suffice to obtain an achromatic stimulus, since the starting points are not restricted to lying on the daylight locus but vary randomly along both dimensions (for xy coordinates of the starting points, see Methodology). It is, however, conceivable that the unique-hue lines, at least the line connecting yellow and blue, are more salient perceptual color directions in comparison to u*v*, since the unique yellow–blue line reflects a naturally occurring change in illumination, the “cerulean line” (Mollon, 2006). Whether unique-hue lines have any special status in the perceptual color space is still an open question, and not much substantial evidence exists supporting this claim, with the exception of Danilova and Mollon's work (2010) demonstrating improved discrimination performance for lights close to the unique yellow–blue hue line.
In conclusion, we have shown that observers' ability to make reliable achromatic settings is increased when observers are asked to adjust the test patch along the directions defined by the four unique hues as opposed to navigating along the main axes in the commonly used CIE u*v* chromaticity plane. While this reduced variability in the achromatic settings does not prove that observers use particular salient mechanisms in the UH method, it is consistent with the idea that internal color representations are more aligned with the unique hues than the u* and v* axes.
Acknowledgments
Preliminary reports of this study were presented at the European Conference of Visual Perception, Alghero, Italy (2012), and at the January Vision meeting of the Colour Group UK (2013). EP and EH were supported by TSB Project No. 720014; KX is supported by the EPSRC (EP/K040057/1).
Commercial relationships: none.
Corresponding author: Sophie Wuerger.
Email: s.m.wuerger@liverpool.ac.uk.
Address: Department of Psychological Sciences, University of Liverpool, Liverpool, UK.
Contributor Information
Tushar Chauhan, Email: Tushar.Chauhan@liverpool.ac.uk.
Esther Perales, Email: esther.perales@ua.es.
Kaida Xiao, Email: kaidaxiao@yahoo.co.uk.
Emily Hird, Email: emily.hird1806@gmail.com.
Dimosthenis Karatzas, Email: dimos@cvc.uab.es.
Sophie Wuerger, Email: s.m.wuerger@liverpool.ac.uk.
References
- Bauml K. H. (2002). Color appearance of spatial pattern: The role of increments and decrements. Vision Research , 42 (13), 1627–1637 [DOI] [PubMed] [Google Scholar]
- Bompas A., Powell G., Sumner P. (2013). Systematic biases in adult color perception persist despite lifelong information sufficient to calibrate them. Journal of Vision, 13 (1): 25 1–19, http://www.journalofvision.org/content/13/1/19, doi:10.1167/13.1.19 [PubMed] [Article] [DOI] [PubMed] [Google Scholar]
- Brainard D. H. (1998). Color constancy in the nearly natural image. 2. Achromatic loci. Journal of the Optical Society of America , 15 (2), 307–325 [DOI] [PubMed] [Google Scholar]
- Brainard D. H., Ishigami K. (1995). Factors influencing the appearance of CRT colors. In Proceedings of the IS&T/SID Color Imaging Conference: Color Science, Systems, and Applications (pp. 62–66). Springfield, VA: IS&T. [Google Scholar]
- Danilova M. V., Mollon J. D. (2010). Parafoveal color discrimination: A chromaticity locus of enhanced discrimination. Journal of Vision, 10 (1): 25 1–9, http://www.journalofvision.org/content/10/1/4, doi:10.1167/10.1.4 [PubMed] [Article] [DOI] [PMC free article] [PubMed] [Google Scholar]
- Delahunt P. B., Brainard D. H. (2004). Does human color constancy incorporate the statistical regularity of natural daylight? Journal of Vision, 4 (2): 25 57–81, http://www.journalofvision.org/content/4/2/1, doi:10.1167/4.2.1 [PubMed] [Article] [DOI] [PubMed] [Google Scholar]
- Doerschner K., Boyaci H., Maloney L. T. (2004). Human observers compensate for secondary illumination originating in nearby chromatic surfaces. Journal of Vision, 4 (2): 25 92–105, http://www.journalofvision.org/content/4/2/3, doi:10.1167/4.2.3 [PubMed] [Article] [DOI] [PubMed] [Google Scholar]
- Ekroll V., Faul F., Niederée R., Richter E. (2002). The natural center of chromaticity space is not always achromatic: A new look at color induction. Proceedings of the National Academy of Sciences, USA , 99 (20), 13352–13356, doi:10.1073/pnas.192216699 [DOI] [PMC free article] [PubMed] [Google Scholar]
- Golz J. (2010). Colour constancy: Influence of viewing behaviour on grey settings. Perception , 39 (5), 606–619 [DOI] [PubMed] [Google Scholar]
- Granzier J. J. M., Toscani M., Gegenfurtner K. R. (2012). Role of eye movements in chromatic induction. Journal of the Optical Society of America, 29 (2), A353–A365 [DOI] [PubMed] [Google Scholar]
- Hansen T., Walter S., Gegenfurtner K. R. (2007). Effects of spatial and temporal context on color categories and color constancy. Journal of Vision, 7 (4): 25 1–15, http://www.journalofvision.org/content/7/4/2, doi:10.1167/7.4.2 [PubMed] [Article] [DOI] [PubMed] [Google Scholar]
- Helson H., Michels W. C. (1948). The effect of chromatic adaptation on achromaticity. Journal of the Optical Society of America , 38 (12), 1025–1031, doi:10.1364/josa.38.001025 [DOI] [PubMed] [Google Scholar]
- Hering E. (1964). Outlines of a theory of the light sense ( Hurvich L. M. Trans.) Cambridge, MA: Harvard University Press; [Google Scholar]
- Kraft J. M., Brainard D. H. (1999). Mechanisms of color constancy under nearly natural viewing. Proceedings of the National Academy of Sciences, USA , 96, 307–312 [DOI] [PMC free article] [PubMed] [Google Scholar]
- Kuehni R. (2005). Focal color variability and unique hue stimulus variability. Journal of Cognition and Culture , 5 (3), 409–426 [Google Scholar]
- Kuriki I. (2006). The loci of achromatic points in a real environment under various illuminant chromaticities. Vision Research , 46 (19), 3055–3066, doi:10.1016/j.visres.2006.03.012 [DOI] [PubMed] [Google Scholar]
- Lee R. J., Dawson K. A., Smithson H. E. (2012). Slow updating of the achromatic point after a change in illumination. Journal of Vision, 12 (1): 25 1–22, http://www.journalofvision.org/content/12/1/19, doi:10.1167/12.1.19 [PubMed] [Article] [DOI] [PMC free article] [PubMed] [Google Scholar]
- Mollon J. (2006). Monge: The Verriest lecture, Lyon, July 2005. Visual Neuroscience , 23 (3–4), 297–309, doi:10.1017/s0952523806233479 [DOI] [PubMed] [Google Scholar]
- Regan B. C., Reffin J. P., Mollon J. D. (1994). Luminance noise and the rapid determination of discrimination ellipses in colour deficiency. Vision Research, 34 (10), 1279–1299 [DOI] [PubMed] [Google Scholar]
- Schefrin B. E., Werner J. S. (1993). Age-related changes in color appearance of broadband surfaces. Color Research and Application, 18 (6), 380–389 [Google Scholar]
- Stevens J. P. (2012). Applied multivariate statistics for the social sciences (5th ed.). New York: Taylor & Francis; [Google Scholar]
- Valberg A. (1971). A method for the precise determination of achromatic colours including white. Vision Research , 11, 157–160 [DOI] [PubMed] [Google Scholar]
- Walraven J., Werner J. S. (1991). The invariance of unique white: A possible implication for normalizing cone action spectra. Vision Research , 31 (12), 2185–2193, doi:10.1016/0042-6989(91)90171-Z [DOI] [PubMed] [Google Scholar]
- Witzel C., Valkova H., Hansen T., Gegenfurtner K. (2011). Object knowledge modulates colour appearance. i-Perception, 2 (1), 13–49 [DOI] [PMC free article] [PubMed] [Google Scholar]
- Wuerger S. (1996). Color appearance changes resulting from iso-luminant chromatic adaptation. Vision Research , 36 (19), 3107–3118, doi:10.1016/0042-6989(96)00057-0 [DOI] [PubMed] [Google Scholar]
- Wuerger S. (2013). Colour constancy across the life span: Evidence for compensatory mechanisms. PLOS One , 8 (5), e63921, doi:10.1371/journal.pone.0063921 [DOI] [PMC free article] [PubMed] [Google Scholar]
- Wuerger S., Atkinson P., Cropper S. (2005). The cone inputs to the unique-hue mechanisms. Vision Research , 45 (25–26), 3210–3223, doi:10.1016/j.visres.2005.06.016 [DOI] [PubMed] [Google Scholar]
- Wuerger S., Maloney L. T., Krauskopf J. (1995). Proximity judgments in colour space: Test of a Euclidean colour geometry. Vision Research , 35 (6), 827–835 [DOI] [PubMed] [Google Scholar]
- Wyszecki G., Stiles W. S. (1982). Color science: Concepts and methods, quantitative data and formulae. New York: John Wiley & Sons; [Google Scholar]
- Xiao K., Fu C., Mylonas D., Karatzas D., Wuerger S. (2013). Unique hue data for colour appearance models. Part II: Chromatic adaptation transforms. Color Research & Application , 38 (1), 22–29, doi:10.1002/col.20637 [Google Scholar]
- Xiao K., Wuerger S., Fu C., Karatzas D. (2011). Unique hue data for colour appearance models. Part I: Loci of unique hues and hue uniformity. Color Research & Application , 36 (5), 316–323, doi:10.1002/col.20637 [Google Scholar]


