Abstract
Ventral hernias (VHs) are abnormal openings in the anterior abdominal wall that are common side effects of surgical intervention. Repair of VHs is the most commonly performed procedure by general surgeons worldwide, but VH repair outcomes are not particularly encouraging (with recurrence rates up to 43%). A variety of open and laparoscopic techniques are available for hernia repair, and the specific technique used is ultimately driven by surgeon preference and experience. Despite routine acquisition of computed tomography (CT) for VH patients, little quantitative information is available on which to guide selection of a particular approach and/or optimize patient-specific treatment. From anecdotal interviews, the success of VH repair procedures correlates with hernia size, location, and involvement of secondary structures. Herein, we propose an image labeling protocol to segment the anterior abdominal area to provide a geometric basis with which to derive biomarkers and evaluate treatment efficacy. Based on routine clinical CT data, we are able to identify inner and outer surfaces of the abdominal walls and the herniated volume. This is the first formal presentation of a protocol to quantify these structures on abdominal CT. The intra- and inter rater reproducibilities of this protocol are evaluated on 4 patients with suspected VH (3 patients were ultimately diagnosed with VH while 1 was not). Mean surfaces distances of less than 2mm were achieved for all structures.
Keywords: Ventral Hernia, Anterior Abdominal Wall, Image Labeling Protocol
1. INTRODUCTION
Over 2 million abdominal operations are performed each year in the United States for benign conditions alone [1], and ventral hernias (VHs) occur in up to 28% of patients undergoing abdominal operations even in optimal conditions [2, 3]. Repair of these hernias is fraught with failure; recurrence rates ranging from 24–43% [4]. Recurrence of previously repaired VHs increases costs and morbidity to patients and can sometimes require multiple repairs. In some patients, repair of their end-stage VH may produce a worse outcome than a non-operative strategy [5]. Ventral hernias continue to rise in incidence with nearly 350,000 repairs performed in 2006 [6]. From very conservative estimates, the total procedural costs for VH repair in 2006 were $3.2 billion in the United States [6].
Although VH repair is one of the procedures most commonly performed by general surgeons worldwide, much variation exists in its delivery. It is unknown which patient population benefits most from a laparoscopic versus an open VH repair. Optimal mesh type, best mesh position, and ideal method of fixation of the mesh remain to be defined. Most importantly, no well accepted method of classification of VH exists. Muysoms et al. described a clinically based system of classification based on consensus from the European Hernia Society [7]. Although potentially useful, this classification system has not been widely adopted mainly due to its cumbersome nature and internal inconsistencies within the classification scheme. We posit that the lack of a classification system is the chief reason for the wide variation in care in VH management.
Although most VH patients undergo computed tomographic (CT) scanning to evaluate their abdomen and this information is used to make clinical judgments about a particular patient’s hernia for treatment and prognosis, these decisions are very subjective, and are based on little empirical data. Here, we present and characterize an image labeling protocol to quantitatively segment the abdominal wall.
2. MAJOR ANATOMICAL FEATURES
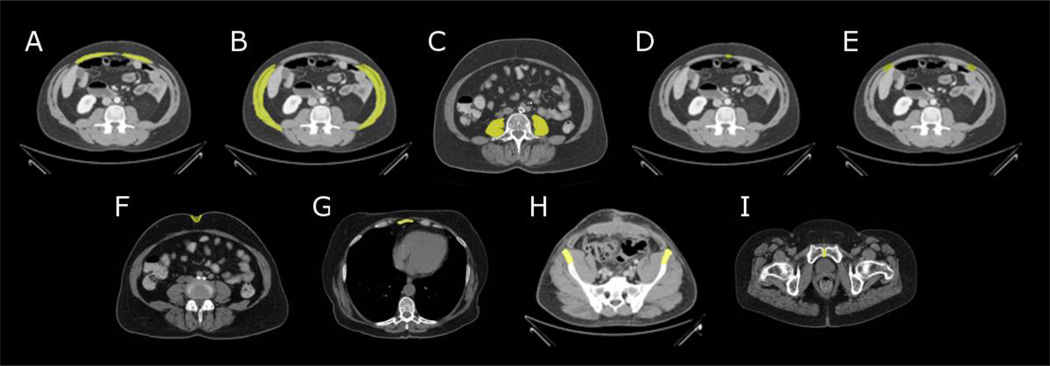
We consider the anterior abdominal wall in terms of three categories of anatomical features visible on CT: muscular groups, fascial connections, and skeletal landmarks (Figure 1).
Figure 1.
Illustration of abdominal anatomy on CT.
Muscular Groups
The Rectus/Pyramidalis Muscles (Fig. 1A) form the anterior-most muscular layer. The rectus consists of a pair of muscular columns oriented along the dorso-ventral axis. It is connected superiorly at the xiphoid process and extends inferiorly to the pubis. The pyramidalis is aligned anterior to the inferior portion of the rectus, directly anterior to the pubis. The two muscles can be difficult to distinguish on CT, and for the purposes of this protocol they are considered as one muscular group.
There are three main muscles that make up the group of Oblique Abdominal Muscles (Fig. 1B): the external oblique, the internal oblique, and the transverse abdominal. These three muscles are connected superiorly to the 5th through 12th ribs, inferiorly to the iliac crest, and extend across the anterior abdominal wall toward the rectus muscle along the midline. They form the lateral barriers of the abdominal wall. On CT, these three muscles can be identified as a singular muscular group.
The left and right Psoas Muscles (Fig. 1C) connect the vertebral column to the inferior-anterior pelvis and femur. Aside the spinal column, they stretch along the superior-inferior axis and connect to all lumbar vertebrae. The two muscles can be seen on CT prominently in the lumbar region, directly posterior to the peritoneum and partially forming the posterior boundary of the abdominal cavity.
Fascial Boundaries
The Linea Alba (Fig. 1D) runs between the two sections of the rectus muscle. It consists of almost exclusively connective tissue, including the fused aponeuroses of the rectus and the oblique muscular groups. It forms the anterior-most midline and extends from the xiphoid process at its superior end to the pubis at its inferior end. The linea alba is easily located on a CT image after identification of the rectus muscle.
The Linea Semilunaris (Fig. 1E) runs directly aside the left and right boundaries of the rectus muscle, beginning at the termination of the oblique muscles. It consists of the aponeuroses of the oblique muscles. It begins superiorly at the 9th rib and extends inferiorly to nearly join at the pubic tubercle. On CT, the linea semilunaris can be identified by the anterior termina of the oblique abdominal muscles.
The Umbilicus (Fig. 1F) is the small depression of the navel or “belly-button”, located anteriorly along the linea alba slightly superior to the pelvis. On CT, the umbilicus can be seen as an indentation and slight increase of intensity of the anterior dermal layer along the midline, anterior to the abdominal wall.
Skeletal Landmarks
The xiphoid process (Fig 1G) is the inferior-most structure of the sternum. It is composed of ossified cartilage and is located medially, at the superior end of the linea alba. On CT, it can be found as a bright, bony structure directly in the medial line superior to the anterior abdominal wall. The inferior-most point of the xiphoid process is useful in defining the superior boundary of the wall.
The left and right anterior superior iliac spines (ASIS, Fig. 1H) are the ridges along the superior curve of the pelvic bone. The anterior-most protrusion of the iliac curve is the anterior iliac spine. On CT, the anterior superior iliac spines are the anterior-most points of the bright, bony pelvis. They are useful as surface anatomical landmarks, and well as in defining the inferior boundary of the anterior abdominal wall.
The pubic symphysis (Fig. 1I) is the cartilaginous joining of the two halves of the pubic bones, located medially and immediately posterior to the external genitalia. On CT, it can be found where the left and right bright, bony pubic structures nearly touch. It is useful in defining the inferior-most boundary of the abdominal wall.
3. LABELING PROTOCOL
Here we present an abbreviated description of the proposed protocol. We find that the abdominal wall surfaces can be appreciated on either axial or sagittal views without extensive three-dimensional visualization, while the skeletal landmarks and hernia volume require tri-planar manipulation.
Abdominal Wall: Axial Labeling Protocol
- The outer abdominal wall (Fig. 2A) is defined as a single continuous contour around the abdomen, beginning laterally at the posterior termination of the oblique muscles. It is located along the superficial border of the musculature and fascia, under the fatty and dermal layers. It surrounds all oblique muscles, tracing around the anterior-most border of the linea semilunaris, the rectus muscles, and the linea alba. Inferior aspects are traced beginning at the anterior iliac spine on both sides, following the oblique and rectus musculature medially to the linea alba. Medial slice traces begin at the posterior termination of the oblique muscles, medially to the linea alba. Superior slice traces begin at the point of the oblique musculature closest to the anterior-most visible rib bone, and follow the anterior wall medially to the linea alba.
-
◦At hernia location(s), tracings follow the outer contour of musculature and fascia.
-
◦
- The inner abdominal wall (Fig. 2B) is defined as a continuous contour, tracing the innermost border of the musculature and fascia of the anterior abdominal wall. It falls directly on the anterior-most border of the viscera. Like the outer wall, tracings begin at the lateral or posterior-most terminations of the oblique muscles, and run on the posterior border of the linea semilunaris, rectus muscles, and linea alba. Inferior, medial, and superior slices begin in the corresponding locations on the inner wall as described above.
-
◦At hernia location(s), tracing continues until there is clear wall deviation due to the hernia. At that point of deviation, tracing terminates until the wall is no longer deviated.
-
◦
The posterior abdominal cavity (Fig. 2C) is defined as a continuous contour, tracing the innermost border of the abdominal cavity as a continuation of the inner abdominal wall. It closely follows the shape of the spinal and trunk musculature and the peritoneum along the anterior of the abdominal cavity. The tracing follows laterally and posterior the majority of the viscera, only deviating anteriorly to follow the peritoneum in exclusion of the kidneys, vena cava, and aorta. The posterior abdominal cavity tracing must form a complete, closed shape with the inner abdominal cavity. Inferior and medial slices begin in the corresponding locations as described above, where the inner abdominal cavity terminates laterally and posteriorly. Superior slices should follow the thoracic diaphragm directly inferior to the lungs.
Figure 2.
Illustration of Axial Labels.
Abdominal Wall: Sagittal Labeling Protocol
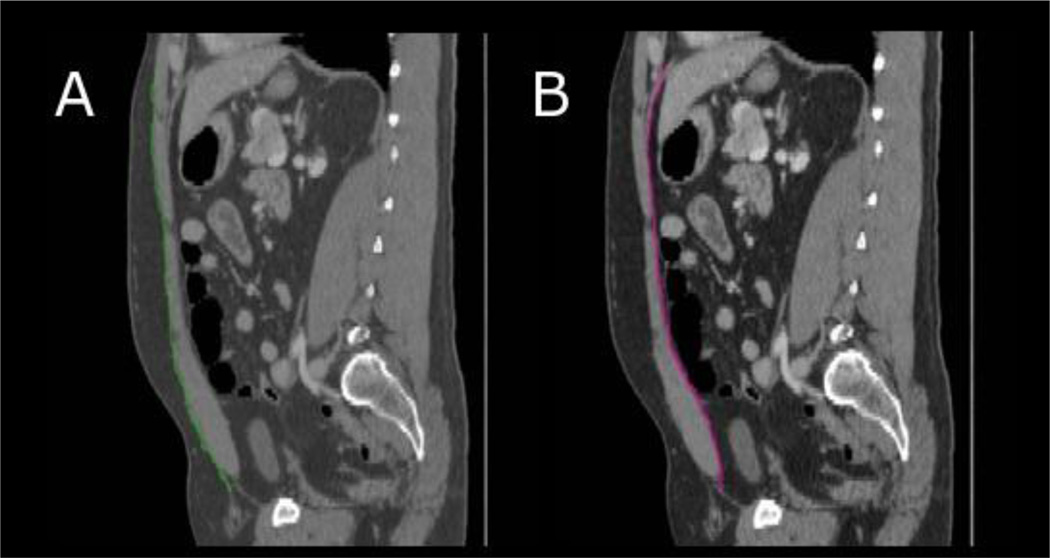
- The outer abdominal wall (Fig. 3A) traces a continuous path along the superficial border of the musculature and fascia of the anterior abdominal wall. The tracing begins superiorly at the first bony structure (ribs or xiphoid process) and proceed inferiorly to the interception with the anterior superior iliac spine or pelvis.
-
◦At hernia location(s), tracings follow the outer contour of musculature and fascia.
-
◦
- The inner abdominal wall (Fig. 3B) tracing follows the innermost border of the musculature and fascia of the anterior abdominal wall using similar bounds as for the outer wall tracing, beginning superiorly at the ribs or xiphoid process and ending inferiorly at the closest point to the iliac crest or pelvic bone.
-
◦At hernia location(s), tracing continues until there is clear wall deviation due to the hernia. At that point of deviation, tracing terminates until the wall is no longer deviated.
-
◦
Figure 3.
Illustration of Sagittal Labels.
Fascial Boundary Labeling Protocol
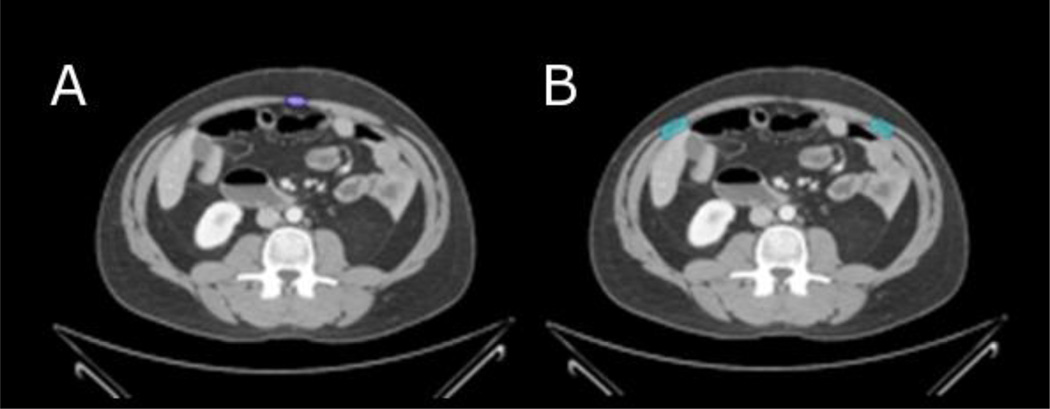
- The linea alba (Fig 4A), running directly down the midline of the abdomen, is labeled axially in order to determine its average width. The label covers the thinned area between the two rectus muscles and between the axial outer abdominal label and the axial inner abdominal wall label, only in slices where the wall is labeled.
-
◦If hernia location(s) overlap with the linea alba, the hernia label takes precedence. The linea alba label may not exist at every slice in which the wall is labeled.
-
◦
- The left and right linea semilunaris (Fig. 4B) are labeled axially in order to determine the average width of the fascial boundaries. The label covers the thinned area between each rectus muscle and the obliques, and between the axial outer abdominal label and the axial inner abdominal wall label, only in slices where the wall is labeled.
-
◦If hernia location(s) overlap with either linea semilunaris, the hernia label takes precedence. The linea semilunaris labels may not exist at every slice in which the wall is labeled.
-
◦
Figure 4.
Illustration of Fascial Boundary Labels.
Tri-planar, Three-dimensional Protocol
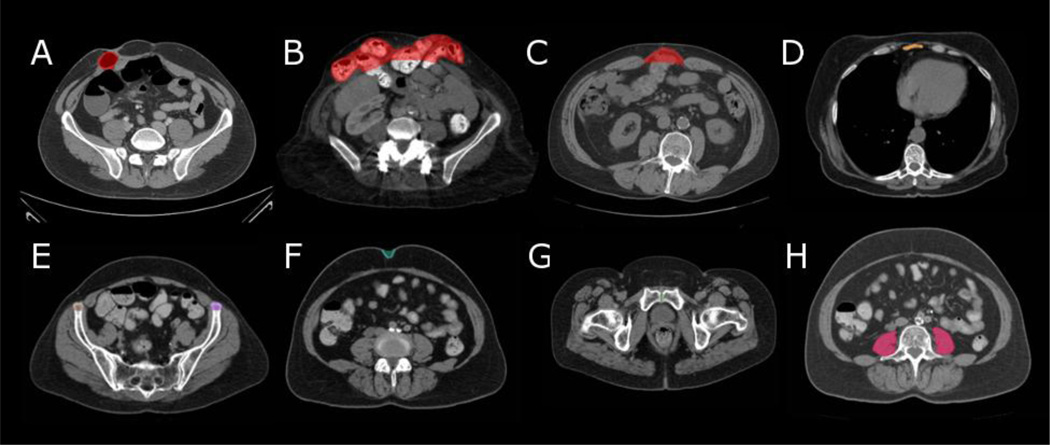
Hernias (examples Fig. 5A–C) are labeled volumetrically as opposed to a surface tracing. The entire hernia is fully labeled in every slice that includes the hernia. The hernia label includes all viscera that have invaded the displaced wall.
The xiphoid process (Fig. 5D), the left ASIS and the right ASIS (Fig. 5E) landmarks are labeled volumetrically in at least five slices. The xiphoid process should include the five inferior-most slices that include the xiphoid process, and the two ASIS landmarks should be centered around the slices that include the anterior-most iliac point on each side.
The entire umbilicus (Fig. 5F) and pubic symphysis (Fig 5G) are labeled volumetrically, in all slices that include these landmarks. Note that the umbilicus includes the external indention and indication of the umbilicus, as well as the internal residual structures.
The psoas muscles (Fig 5H) are labeled on a single slice, located at the center of the L4 vertebra (the second vertebra superior to the sacrum/pelvis). Both left and right psoas muscles are labeled in the same slice.
Figure 5.
Illustration of Tri-planar Labels.
4. METHODS AND RESULTS
Retrospective, clinically acquired CT data on four patients with suspected VHs were acquired in anonymous form under institutional review board supervision. Volumes were approximately 512×512×157 voxels with a resolution of 0.89×0.89×3 mm.
A research associate was trained on the protocol using the Medical Image Processing And Visualization (MIPAV) software (National Institutes of Health, Bethesda, MD) and a high resolution tablet input (Wacom, Tokyo, Japan) on a 64-bit Linux workstation. The twenty datasets were labeled fully twice (Figure 6). For efficiency, normal wall anatomy was evaluated on slices spaced every 5 cm. All labels were created independently so that the individual could not see his own prior labels. Labeling time ranged between 60 and 90 minutes per dataset.
Figure 6.
Representative segmentations for two subjects. Labels: red: volumetric hernia, yellow: outer abdominal wall (axial), blue: inner abdominal wall (axial), green: outer abdominal wall (sagittal), pink: inner abdominal wall (sagittal), cyan: skin
Intra-rater reliability was estimated from the differences between the paired results. Abdominal wall reliability was determined by calculating mean surface distance between the two sets of labels (Table 1). Anatomical label reliability was assessed based on the norm point distance between the centroids of paired results. For the psoas muscle, cross-sectional area was calculated at the slice closest to the center of the L4 vertebra (Table 2). For the hernia segmentation (Table 3), reproducibility was assessed both on surface distances and on volumes.
Table 1.
Intra-Rater Reliability
| Label |
Axial Outer Wall |
Axial Inner Wall |
Sagittal Outer Wall |
Sagittal Inner Wall |
Xiphoid Process |
Left AISP |
Right ASIS | |||
|---|---|---|---|---|---|---|---|---|---|---|
| Metric | μSD ± σSD | μSD ± σSD | μSD ± σSD | μSD ± σSD | ||||||
| Target 1 | 0.35 ± 0.11 | 0.32 ± 0.07 | 0.44 ± 0.17 | 0.47 ± 0.15 | 0.59 | 3.00 | 0.0 | |||
| Target 2 | 0.87 ± 0.76 | 0.83 ± 0.44 | 2.18 ± 3.52 | 0.80 ± 0.65 | 0.67 | 0.84 | 0.0 | |||
| Target 3 | 1.17 ± 0.90 | 0.35 ± 0.10 | 1.01 ± 0.98 | 0.55 ± 0.36 | 0.24 | 0.72 | 9.03 | |||
| Target 4 | 0.31 ± 0.09 | 0.27 ± 0.04 | 0.40 ± 0.07 | 0.30 ± 0.05 | 0.33 | 10.13 | 1.14 | |||
| Mean | 0.68 ± 0.47 | 0.44 ± 0.16 | 1.01 ± 1.19 | 0.53 ± 0.30 | 0.45 | 3.67 | 2.54 | |||
μSD: Mean Surface Distance (mm), σSD: Std. Dev. Surface Distance (mm), : L2 Norm Point Distance (mm)
Table 2.
Inter-Rater Reliability
| Label |
Axial Outer Wall |
Axial Inner Wall |
Sagittal Outer Wall |
Sagittal Inner Wall |
Xiphoid Process |
Left AISP |
Right ASIS | |||
|---|---|---|---|---|---|---|---|---|---|---|
| Metric | μSD ± σSD | μSD ± σSD | μSD ± σSD | μSD ± σSD | ||||||
| Target 1 | 1.54 ± 2.23 | 1.66 ± 2.36 | 0.42 ± 0.22 | 0.36 ± 0.09 | 2.01 | 0.0 | 0.0 | |||
| Target 2 | 2.03 ± 0.67 | 0.94 ± 0.55 | 1.86 ± 1.02 | 0.80 ± 0.48 | 15.87 | 3.12 | 3.11 | |||
| Target 3 | 1.14 ± 0.46 | 0.47 ± 0.40 | 1.19 ± 0.69 | 0.57 ± 0.36 | 0.23 | 4.22 | 9.69 | |||
| Target 4 | 0.37 ± 0.10 | 0.31 ± 0.10 | 0.42 ± 0.12 | 0.39 ± 0.13 | 0.42 | 1.61 | 5.25 | |||
| Mean | 1.27 ± 0.87 | 0.85 ± 0.85 | 1.97 ± 0.51 | 0.53 ± 0.27 | 4.63 | 2.24 | 4.51 | |||
μSD: Mean Surface Distance (mm), σSD: Std. Dev. Surface Distance (mm), : L2 Norm Point Distance (mm)
Table 3.
Hernia Labeling Reliability
| Inter-Rater Variability | Intra-Rater Variability | |||||||
|---|---|---|---|---|---|---|---|---|
| Metric | DSC | μSD | %VD | μVol | DSC | μSD | %VD | μVol |
| Target 1 | 0.73 | 2.14 | 42.01 | 25.95 | 0.91 | 0.75 | 2.54 | 31.18 |
| Target 2 | N/A | N/A | N/A | N/A | N/A | N/A | N/A | N/A |
| Target 3 | 0.88 | 1.96 | 8.07 | 273.6 | 0.91 | 1.96 | 7.35 | 253.2 |
| Target 4 | 0.85 | 1.22 | 11.91 | 79.46 | 0.78 | 2.22 | 32.40 | 100.5 |
| Mean | 0.82 | 1.77 | 20.66 | 123.3 | 0.87 | 1.64 | 14.10 | 128.3 |
μSD: Mean Surface Distance (mm), DSC: Dice Similarity, %VD: % Volume Difference, μVol: Mean Volume (cm3)
5. DISCUSSION
The proposed protocol provides a quantitative basis with which we may begin to characterize the canonical three-dimensional appearance of abdominal wall structure on CT. Mean intra- and inter-rater reliability for the wall surfaces was within 2mm, but ASIS landmarks were off by up to 10 mm (effectively, 3 slices). Continued protocol refinement is necessary to more robustly identify the ASIS. Furthermore, the limited sample size presented here is sufficient for pilot demonstration; full protocol characterization necessitates a more substantial cohort.
ACKNOWLEDGEMENTS
This project was supported by ViSE/VICTR VR3029 and NIH 1R03EB012461.
References
- 1.Wechter ME, Pearlman MD, Hartmann EK, et al. Reclosure of the disrupted laparotomy wound: a systematic review. Obstetrics & Gynecology. 2005;106(2):376–383. doi: 10.1097/01.AOG.0000171114.75338.06. [DOI] [PubMed] [Google Scholar]
- 2.Pans A, Elen P, Dewe W, et al. Long-term results of polyglactin mesh for the prevention of incisional hernias in obese patients. World Journal of Surgery. 1998;22(5):479–482. doi: 10.1007/s002689900420. discussion 482-3. [DOI] [PubMed] [Google Scholar]
- 3.Trimbos JB, Smit IB, Holm JP, et al. A randomized clinical trial comparing two methods of fascia closure following midline laparotomy. Archives of Surgery. 1992;127(10):1232–1234. doi: 10.1001/archsurg.1992.01420100094016. [DOI] [PubMed] [Google Scholar]
- 4.Luijendijk RW, Hop WC, van den Tol MP, et al. A comparison of suture repair with mesh repair for incisional hernia. New England Journal of Medicine. 2000;343(6):392–398. doi: 10.1056/NEJM200008103430603. [DOI] [PubMed] [Google Scholar]
- 5.Aguilar B, Chapital AB, Madura JA, 2nd, et al. Conservative management of mesh-site infection in hernia repair. Journal of Laparoendoscopic & Advanced Surgical Techniques, Part A. 2010;20(3):249–252. doi: 10.1089/lap.2009.0274. [DOI] [PubMed] [Google Scholar]
- 6.Poulose B, Shelton J, Phillips S, et al. Epidemiology and Cost of Ventral Hernia Repair: Making the Case for Hernia Research. Hernia. 2011 doi: 10.1007/s10029-011-0879-9. [DOI] [PubMed] [Google Scholar]
- 7.Muysoms FE, Miserez M, Berrevoet F, et al. Classification of primary and incisional abdominal wall hernias. Hernia. 2009;13(4):407–414. doi: 10.1007/s10029-009-0518-x. [DOI] [PMC free article] [PubMed] [Google Scholar]


