

Abstract
Neuronal electrical oscillations in the theta (4–14 Hz) and gamma (30–80 Hz) ranges are necessary for the performance of certain animal behaviours and cognitive processes. Perisomatic GABAergic inhibition is prominently involved in cortical oscillations driven by ACh release from septal cholinergic afferents. In neocortex and hippocampal CA3 regions, parvalbumin (PV)-expressing basket cells, activated by ACh and glutamatergic agonists, largely mediate oscillations. However, in CA1 hippocampus in vitro, cholinergic agonists or the optogenetic release of endogenous ACh from septal afferents induces rhythmic, theta-frequency inhibitory postsynaptic currents (IPSCs) in pyramidal cells, even with glutamatergic transmission blocked. The IPSCs are regulated by exogenous and endogenous cannabinoids, suggesting that they arise from type 1 cannabinoid receptor-expressing (CB1R+) interneurons – mainly cholecystokinin (CCK)-expressing cells. Nevertheless, an occult contribution of PV-expressing interneurons to these rhythms remained conceivable. Here, we directly test this hypothesis by selectively silencing CA1 PV-expressing cells optogenetically with halorhodopsin or archaerhodopsin. However, this had no effect on theta-frequency IPSC rhythms induced by carbachol (CCh). In contrast, the silencing of glutamic acid decarboxylase 2-positive interneurons, which include the CCK-expressing basket cells, strongly suppressed inhibitory oscillations; PV-expressing interneurons appear to play no role. The low-frequency IPSC oscillations induced by CCh or optogenetically stimulated ACh release were also inhibited by a μ-opioid receptor (MOR) agonist, which was unexpected because MORs in CA1 are not usually associated with CCK-expressing cells. Our results reveal novel properties of an inhibitory oscillator circuit within CA1 that is activated by muscarinic agonists. The oscillations could contribute to behaviourally relevant, atropine-sensitive, theta rhythms and link cannabinoid and opioid actions functionally.
Key points.
Low-frequency (4–14 Hz, ‘theta’) neuronal oscillations are essential for various animal behaviours, and are strongly influenced by inhibitory neuronal activity, although the interneurons responsible for such activity are not known.
We used optogenetic methods to identify the generators of cholinergically activated, theta-frequency inhibitory postsynaptic currents (IPSCs) in mouse CA1 hippocampus.
Rhythmic IPSCs are driven by the activation of muscarinic acetylcholine receptors (mAChRs) via mAChR agonist application or ACh release from cholinergic axons.
The output of parvalbumin (PV)-expressing interneurons was prevented optogenetically or pharmacologically without affecting mAChR-dependent oscillatory IPSCs. Instead, these IPSCs were blocked by inhibiting interneurons that express glutamic acid decarboxylase 2 (Gad2) and cannabinoid receptors, primarily the cholecystokinin (CCK)-expressing cells.
Theta-frequency IPSCs were also inhibited by a μ-opioid receptor agonist, suggesting that, in addition to being a potential substrate for the generation of behaviourally important rhythms, the same interneurons are a site of convergence of the cannabinoid and opioid neuromodulatory systems.
Introduction
ACh affects a wide range of cognitive processes, which is attributable in part to its ability to influence neuronal microcircuits (Cobb & Davies, 2005; Mann et al. 2005; Lawrence, 2008; Ellender & Paulsen, 2010; Cea-del Rio et al. 2012). Activation of hippocampal cholinergic receptors induces robust spontaneous inhibitory postsynaptic current (sIPSC) activity (Pitler & Alger, 1992a) and triggers oscillations within microcircuits (Fisahn et al. 1998; Gillies et al. 2002; Mann et al. 2005; Reich et al. 2005; Gulyas et al. 2010; Nagode et al. 2011). Hippocampal GABAergic interneurons are highly sensitive to both nicotinic and muscarinic receptor activation (Jones & Yakel, 1997; McQuiston & Madison, 1999a,b1999b; Widmer et al. 2006); indeed, interneurons seem to be primary substrates for ACh-driven rhythms. The make-up of the circuits – which interneurons, and whether or not concurrent glutamatergic signalling is required – is not fully established and might be different in various hippocampal subregions.
Low-frequency, cholinergically induced rhythms can be inhibited by the retrograde signalling process called depolarization-induced suppression of inhibition (DSI) (Pitler & Alger, 1992b, 1994; Martin et al. 2001; Hampson et al. 2003; Fortin et al. 2004; for a review, see Alger, 2002), which is mediated by the endocannabinoid activation of the type 1 cannabinoid receptor (CB1R; Wilson & Nicoll, 2001; Wilson et al. 2001; for a review, see Kano et al. 2009). By far the majority of hippocampal CB1R-positive (CB1R+) interneurons also express the neuropeptide cholecystokinin (CCK) (referred to as ‘CCK’ cells throughout; Freund et al. 2003; Freund & Katona, 2007). Hence, the marked sensitivity of ACh-dependent rhythms to endocannabinoid modulation strongly suggests that CB1R+ (presumptively CCK) interneurons are primarily responsible for their generation. We have reported that optogenetically stimulated release of endogenous ACh in hippocampal slices triggers long bursts of low-frequency IPSCs that are inhibited by DSI in CA1 pyramidal cells (Nagode et al. 2011). The CB1R+ interneuronal circuit may also be activated in vivo (cf Robbe et al. 2006). However, in CA3, higher frequency, gamma range oscillations generated by the ACh receptor (AChR) agonist carbachol (CCh) are suppressed by ionotropic glutamate receptor (iGluR) antagonists (Gillies et al. 2002; Mann et al. 2005; Oren et al. 2006,2010; Gulyas et al. 2010) and by the activation of μ-opioid receptors (MORs), which are thought to be predominantly present on parvalbumin (PV)-expressing (and CB1R-negative) interneurons (Freund & Katona, 2007). These data suggest that CCh-induced oscillations in CA3 are driven primarily by PV-expressing (referred to as ‘PV’ cells throughout) basket cells (Gulyas et al. 2010). Thus, the interneuronal circuitry engaged by ACh might be different in different regions. However, a contributory role for PV interneurons in CA1 oscillations has not been entirely ruled out. Understanding the functions of neural circuitry requires the identification of the circuit mechanisms. Accordingly, we have investigated the inhibitory, low-frequency rhythms in CA1 to test the hypothesis that IPSCs originating from PV interneurons are major drivers of cholinergically induced rhythms there as well. Perisomatic inhibition in CA1 is provided by PV and CCK interneurons (Freund & Buzsaki, 1996; Bartos & Elgueta, 2012); hence we also tested the alternative hypothesis that these rhythmic IPSCs arise from CCK interneurons.
Importantly, two high-resolution, paired-cell recording studies from verified CB1R+ or CCK interneurons and pyramidal cells (Neu et al. 2007; Glickfeld et al. 2008) demonstrated that, in a small fraction (11% or 25%, respectively) of these pairs, the MOR agonist, [D-ala2, NMe-Phe4, Gly-ol5]-enkephalin (DAMGO), also suppressed GABAergic transmission. It is not known whether this fraction contributes significant input to the CA1 pyramidal cells, however. Optogenetic methods offer unique advantages to the investigation of such issues, not only in rapidly sampling a larger fraction of the interneuron population simultaneously than is possible with paired-cell methods, but also in probing the output of the neurons directly, which can be affected by modulatory effects exerted on axons independently of somata (e.g. Bender et al. 2010; Dugladze et al. 2013).
Using two methods of optogenetic silencing, we found that PV cell activity is not required for theta-frequency inhibitory rhythms induced by the activation of muscarinic acetylcholine receptors (mAChRs) in CA1. Selective targeting of non-PV interneurons is often accomplished by the labelling of glutamic acid decarboxylase 2 (Gad2; formerly known as Gad65; e.g. Gulyas et al. 2010; Cea-del Rio et al. 2012), which is not significantly expressed in PV cells (López-Bendito et al. 2004). We found that optogenetic silencing of Gad2+ interneurons severely reduced CCh-induced inhibitory theta rhythms in CA1, supporting the hypothesis that the Gad2 interneurons, not PV interneurons, are the primary generators of these IPSCs. Unexpectedly, even with GABA release from PV cells prevented, the MOR agonist DAMGO still potently inhibited the mAChR-dependent rhythms. In addition, the rhythmic IPSCs induced by optogenetic stimulation of endogenous ACh release in CA1, in the presence of iGluR antagonists, are greatly depressed by either CB1R or MOR activation. Thus ACh-induced rhythms in CA1 are driven principally by Gad2+/CB1R+ cells, but can be inhibited by both CB1Rs and MORs independently of iGluR activation or PV cell output. The possibility of direct regulation of CB1R+ basket cell output by MORs should be re-evaluated as it has direct implications for understanding the control of low-frequency IPSC oscillations. The CB1R+/MOR+ circuit may represent a novel mechanism for interactions between two potent neuromodulatory systems that are targets of therapeutic and abused drugs.
Methods
Ethical approval
All procedures were approved by the Institutional Animal Care and Use Committee of the University of Maryland School of Medicine. Survival surgeries were performed under ketamine [75 mg (kg body weight)−1] anaesthesia supplemented with acepromazine [2.5 mg (kg body weight)−1], injected into the peritoneal cavity. The animal’s head was placed in a stereotactic apparatus, and an incision was made through the skin to reveal the skull and appropriate landmarks (Lambda and Bregma). A dental drill was used to make a small hole (∼1 mm) through the skull at the appropriate coordinates obtained from The Mouse Brain in Stereotaxic Coordinates (Franklin & Paxinos, 1997). A calibrated glass pipette (Wiretrol 1, Drummond Scientific, Broomall, PA, USA), tip diameter pulled to ∼50 μm, was filled with the appropriate adeno-associated virus (AAV) vector by inserting a wire plunger into the back of the pipette, attaching this to an infusion pump (KD Scientific, Holliston, MA, USA) and aspirating through the tip. The tip was lowered slowly into the brain through the craniotomy. A total volume of 0.25–1.5 μl of AAV (∼5 × 10¹² genome copies ml−1) was injected at a rate of 0.1 μl min−1. The pipette was left in place for an additional 3 min after injection to allow for diffusion of the virus away from the tip, and then slowly withdrawn. The hole in the skull was sealed with sterile surgical wax, and the incision was sutured shut. Mice were monitored postoperatively until they were able to ambulate normally before being returned to the animal facility. A total of 141 mice and 14 rats were used for this project. For the preparation of in vitro slices (see below), animals were deeply sedated with isoflurane and decapitated by guillotine.
Cre driver mouse lines
All mouse lines were obtained from The Jackson Laboratory (Bar Harbor, ME, USA), and bred as homozygotes. The lines used were PV-Cre (B6;129P2-Pvalbtm1(cre)Arbr/J, #008069), Gad2-Cre (Gad2<tm2(cre)Zjh>/J, #010802) and ChAT-Cre (B6;129S6-Chattm1(cre)Lowl/J, #006410). Approximately 90% of the cells in these lines express Cre in the target cells (cf. Jaxmice data sheets; cf. Fig. 2D).
Figure 2. Optogenetic silencing of parvalbumin (PV) cells with halorhodopsin (NpHR) does not suppress carbachol (CCh)-induced inhibitory postsynaptic currents (IPSCs).
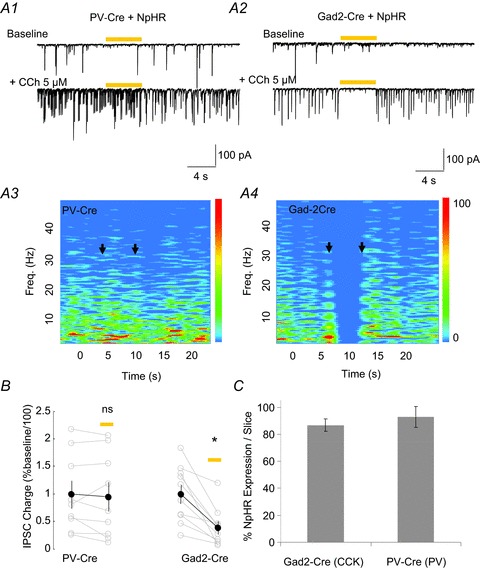
A1, spontaneous IPSCs in a CA1 pyramidal cell during baseline conditions (upper trace) and after application of 5 μm CCh (lower trace) in a PV-NpHR-expressing slice. A 5 s pulse of yellow light (yellow bar) does not alter the CCh-induced spontaneous activity. A2, same experiment as in A1 in a slice from a Gad2-Cre mouse expressing NpHR. In this case, the 5 s yellow light transiently abolished the large CCh-induced IPSCs. A3, A4, spectrograms generated for the traces shown in A1 and A2, respectively. The colour scales are in units of spectral power (pA2 Hz−1). B, group data of total charge carried by IPSCs in 5 s windows immediately before and during NpHR activation for PV-Cre and Gad2-Cre mice. C, expression of NpHR in cholecystokinin (CCK)-immunopositive cells in Gad2-Cre mice, and in PV-immunopositive cells in PV-Cre mice. A total of 58 CCK cells and 30 PV cells were counted in 11 and six slices, respectively. NpHR was expressed in 86.7 ± 4.6% of CCK cells per slice, and in 92.9 ± 7.8% of PV cells per slice. *P< 0.05.
AAV vectors
For the in vivo expression of opsins, we delivered AAV vectors containing channelrhodopsin2 (ChR2), halorhodopsin (NpHR) or archaerhodopsin (Arch) under the control of the flip-excision (FLEX) switch mechanism (Atasoy et al. 2008) to the medial septum/diagonal band or to the hippocampus as appropriate. In each vector, the opsin was fused to a reporter gene [mCherry (ChR2), enhanced yellow fluorescent protein (EYFP) (NpHR) or green fluorescent protein (GFP) (Arch)] for visualization of expression. Vectors had a titre greater than 1012 genome copies ml−1. The serotypes used were AAV 2/1, 2/5 and 2/9, as they have been found to infect neurons quite effectively (Choi et al. 2005). Slices were prepared from animals injected with NpHR or Arch beginning at 11 days post-injection, and generally used within 2 weeks to avoid toxicity. For animals injected with ChR2, at least 4 weeks were allowed to elapse for hippocampal injections, and at least 5 weeks for medial septum/diagonal band injections. ChR2 expression was stable for months. Plasmids used to make the AAV vectors were AAV-EF1.dflox.hChR2(H134R)-mCherry.WPRE.hGH (Addgene, Addgene, Cambridge, MA, USA, #20297), AAV-EF1a.DIO.eNpHR-eYFP.WP.hGH (Addgene #20949) and AAV-flex.CBA.Arch-GFP.WPRE.SV40 vector obtained from E. Boyden via University of Pennsylvania Vector Core. AAV vectors were obtained either from the University of Pennsylvania Vector Core [AAV-ChR2-mCherry, serotypes 2/1 (#V1447), 2/5 (#V1449) and 2/9 (V1534); AAV-NpHR-EYFP, serotype 2/1 (#AV1–20949P); or AAV-Arch-GFP, serotype 2/1 (#AV-1-PV2432)] or from the University of North Carolina Vector Core (AAV-EF1a-DIO-eNpHR-EYFP, serotype 2/5).
Hippocampal slice preparation
For all experiments, transverse hippocampal slices (400 μm thick) were prepared from mice or rats using previously described methods (Nagode et al. 2011; Tang et al. 2011). Animals were deeply anaesthetized with isoflurane, decapitated, and the brain was removed and placed in ice-cold artificial cerebrospinal fluid (ACSF) [consisting of (mm): 125 NaCl, 3 KCl, 2 MgSO4, 2.5 CaCl2, 1 NaH2PO4, 25 NaHCO3, 10 glucose] and was bubbled to pH 7.3 with 95% O2 and 5% CO2 (∼300 mosmol l−1). One or both hippocampi were removed and sliced. Slices were taken from the middle two-thirds of the hippocampus, and incubated at room temperature (∼22°C) at the interface between ACSF and humidified air saturated with 95% O2/5% CO2 in order to maintain necessary oxygenation for neurons without affecting the properties of the rhythms, apart from a slowing of their peak frequencies (e.g. Gulyas et al. 2010). Slices were allowed to incubate for at least 1.5 h before recording. In general, whole-cell recordings could be made from mouse slices for up to 8 h, and from rat slices for up to 10 h, after slicing.
Opsin activation in vitro
Epifluorescence illumination was used to visualize the expression of opsins in acute slices. For opsin activation, light pulses (453–493 nm for ChR2 and 557–597 nm for NpHR and Arch) were delivered through a 40× water-immersion objective of a Nikon Instruments (Melville, NY, USA) E600FN fluorescence microscope, using a Lambda DG-4 high-speed wavelength switcher (Sutter Instruments, Novato, CA, USA) equipped with a 300 W xenon lamp. The pulse and train duration were set by a digital timer (World Precision Instruments, WPI, Sarasota, FL, USA), which was triggered by pClamp 10 software (Molecular Devices, Sunnyvale, CA, USA). Illumination was applied to the entire visual field, and the output intensity at the objective was between 300 and 500 μW.
In vitro electrophysiology
A dual-superfusion chamber (RC-27, Warner Instruments, Hamden, CT, USA) was used to hold the slice during recordings. Recordings were made using room temperature ACSF bubbled with 95% O2/5% CO2. The flow rate of ACSF was 1–2 ml min−1. All drugs were diluted from stock solutions into the ACSF and bath perfused. All recordings were made using an Axopatch 200B amplifier (Molecular Devices, Sunnyvale, CA, USA). Data were filtered at 2 kHz and digitized at 5–10 kHz using Clampex 10 software (Molecular Devices, Sunnyvale, CA, USA). Patch pipettes were pulled from borosilicate glass and had resistances of 2–5 MΩ in the bath. The internal pipette solution contained (in mm): 85 Cs-methanesulfonate, 50 CsCl, 10 Hepes-Na, 3 MgATP, 1 MgCl2, 0.3 TrisGTP, 0.1 CaCl2, 1 BAPTA-Cs4, 5 QX-314, pH 7.2 (290–300 mOsmol l−1). In most experiments the iGluR antagonists, NBQX (5 μm) and CGP37849 (5 μm), were present; however, in three experiments on mouse slices these antagonists were omitted. The CCh-induced IPSC activity did not differ between the two conditions, and the data were combined. In a few experiments, noted in the text, slices were pre-treated for 0.5–1.5 h in the incubation chamber with either ω-conotoxin GVIA (conotoxin, CgTx), the N-type voltage-gated Ca2+ channel (VGCC) blocker, or ω-agatoxin IVA (agatoxin, AgTx), the P/Q-type VGCC blocker. It is well established (Hefft & Jonas, 2005; for a review, see, for example, Freund & Katona, 2007) that the release of GABA from PV interneurons is regulated by P/Q channels and not N-type VGCCs – AgTx prevents evoked GABA release from PV cells, whereas CgTx has no effect. Conversely, CCK interneurons release GABA only via N-type and not P/Q-type VGCCs – their output is blocked by CgTx and unaffected by AgTx. Hence pretreatment with either of these effectively (within the time frame of the experiments) can be used to eliminate the contribution of PV or CCK interneurons. Of course, the output of other types of hippocampal interneurons (as well as principal cells) will be affected by both toxins; nevertheless, the PV and CCK populations supply the perisomatic inhibition that is responsible for the large CCh-induced IPSCs which are the focus of the present investigation. Differential interference contrast (DIC) optics were used to visualize cells in slices, although, given the dense packing of CA1 pyramidal cells, pyramidal cell recordings were usually made ‘blindly’ by advancing the pipette through the layer on the diagonal and monitoring the tip resistance. For whole-cell voltage clamp experiments, access resistance (Ra) was continually monitored with a −5 mV voltage step; if Ra changed by >20% during the experiment, data were discarded.
Immunohistochemistry
After recordings, 400 μm thick slices from Gad2-Cre or PV-Cre mice expressing NpHR were fixed overnight in paraformaldehyde (4%) at 4°C. After rinsing with 0.02 m potassium phosphate-buffered saline (KPBS), slices were embedded in agar and subsectioned at 50 μm intervals using a Leica vibratome (Buffalo Grove, IL, USA; Model VT1200S). The free-floating thin sections were permeabilized with 0.3% Triton-X, 1 : 100 normal serum (same species as secondary antibody) in 0.02 m KPBS for 1 h, and then incubated overnight in primary antibody diluted at 1 : 1000 in 1 : 30 normal serum and 0.3% Triton-X in KPBS. Sections were then washed (3 × 10 min) in KPBS, and incubated in dye-conjugated secondary antibodies for 1 h at room temperature. Sections were washed again in KPBS, and mounted using Vectashield (Vectorlabs, Burlingame, CA, USA) with 4′,6-diamidino-2-phenylindole (DAPI) to identify cell bodies. Colocalization of PV immunopositivity or CCK immunopositivity with NpHR was determined using a Nikon Eclipse 80i equipped with a Hammamatsu (Middlesex, NJ, USA) Orca-ER CCD camera and a structured light illumination device with grid confocal imaging capabilities (Optigrid, Qioptiq, Fairport, NY, USA). Primary antibodies were rabbit anti-CCK (Sigma) and rabbit anti-PV (Calbiochem).
Data analysis
sIPSCs were analysed using Minianalysis software (Synaptosoft, Decatur, GA, USA). Calculation of DSI was performed as described previously (Nagode et al. 2011). Evoked IPSCs and local field potentials (LFPs) were analysed using Clampfit 10 (Molecular Devices, Sunnyvale, CA, USA). All LFPs were bandpass filtered between 1 and 20 Hz prior to analysis. For the analysis of the effects of DAMGO or WIN55212-2 (WIN) on light-evoked (L-)IPSCs/LFPs, three trials were averaged per condition [e.g. control (CON), DAMGO (DAM), naloxone (NAL)] whenever possible for each cell. For the effect of DAMGO on CCh-induced IPSCs in rat slices, 30 s of spontaneous activity (i.e. one trial) was analysed for each condition (baseline, DAM, NAL) for each cell. For the optogenetic silencing of CCh-induced IPSCs, three light trials (30–60 s between trials) were averaged per cell whenever possible. Of the 18 PV cells in which we tested NpHR or Arch, we obtained one trial in four cells and two trials in two cells; of the 16 Gad2 cells we tested with NpHR or Arch, we obtained one trial in four cells and two trials in two cells. For experiments involving optogenetic release of ACh, 3 min elapsed between trials to allow for full recovery of the response back to baseline. For L-IPSC analysis, 10 s of activity at the peak of the response (greatest amplitude, usually the most rhythmic) were analysed for each trial. The same epoch was used to compare control, drug and reversal conditions. For the analysis of LFPs, the same strategy was used, with the exception that a 20 s window of activity was analysed for each trial. For IPSCs generated by CCh application to rat slices, 30 s windows were analysed for baseline, CCh application immediately prior to drug application, during drug perfusion just before reversal and peak of the reversal. The analysis of the silencing effect of IPSCs (NpHR and Arch experiments) used 5 s windows immediately before and during the light pulse. Spectrograms were generated using MATLAB (Mathworks, Natick, MA, USA).
Statistical analysis
Data are reported as mean ±s.e.m. Whenever applicable, one-way repeated-measures ANOVAs followed by pairwise comparisons (Tukey tests) were carried out; the significance level was P < 0.05. Two-way repeated-measures ANOVAs (P < 0.05) followed by Tukey tests were used to evaluate the data in Fig. 6. The results in Fig. 5B2 were analysed by paired t tests with Bonferroni corrections for multiple comparisons (P < 0.05). Generally, for comparisons of two groups, paired t tests were used with a two-tailed P value of <0.05. Kolmogorov–Smirnov tests were used to compare cumulative frequency distributions (P < 0.01). Whenever group data were normalized to control values, each cell was normalized to the group control mean rather than to its own control value, in order to reflect the variability in the population accurately.
Figure 6. Rhythmic inhibitory postsynaptic currents (IPSCs) induced by optogenetic release of endogenous ACh are sensitive to both μ-opioid receptor (MOR) and type 1 cannabinoid receptor (CB1R) activation.
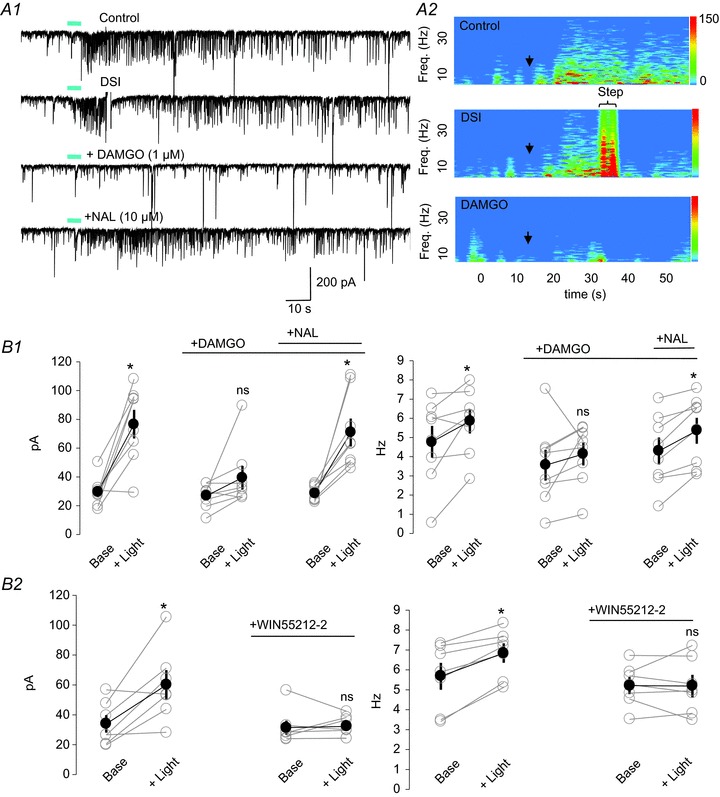
A1, whole-cell recording from a CA1 pyramidal cell from a slice taken from a ChAT-Cre mouse in which channelrhodopsin2 (ChR2) was expressed in septal cholinergic neurons; ionotropic glutamate receptor (iGluR) antagonists, eserine (1 μm) and 4-aminopyridine (4-AP) (5 μm) were present. Trains of blue light (5 Hz for 5 s; blue bars) generated sustained bursts of IPSCs (upper trace), which were transiently suppressed by the induction of depolarization-induced suppression of inhibition (DSI) (second trace), then abolished by the application of DAMGO (third trace) and finally restored by naloxone (NAL, bottom trace). A2, spectrograms generated for traces 1, 2 and 3 in A1. Note the abrupt onset of low-frequency power several seconds after the onset of light stimulation (arrows) in the upper plot, and the prevention of the power increase by DSI (period indicated by the bracket at the top) and DAMGO. The colour scales are in units of pA2 Hz−1. Note that the complex activity during the DSI step reflects a mixture of voltage-gated and synaptic currents, as well as the currents generated by the voltage step itself; it is essentially an artefact. B1, two-way repeated-measures ANOVAs followed by Tukey tests for multiple comparisons were used to analyse the data in B1 (n= 8) and B2 (n= 7). Group data showing effects of DAMGO and naloxone on IPSC amplitude (left plot) and frequency (right plot). Light significantly increased IPSC amplitudes in control (P < 0.001) and naloxone plus DAMGO (P= 0.015), but not in DAMGO alone (P= 0.166). B2, like DAMGO, the CB1R agonist WIN55212–2 (5 μm) prevented the increase in IPSC amplitude (left) and frequency (right). IPSC amplitudes were significantly increased in baseline conditions (P= 0.001), but not in the presence of WIN (P= 0.9). IPSC frequencies were increased by light (P= 0.009) in baseline conditions, but not in the presence of WIN (P= 0.937).
Figure 5. The μ-opioid receptor (MOR) agonist DAMGO suppresses cholinergically induced inhibitory postsynaptic current (IPSC) rhythms.
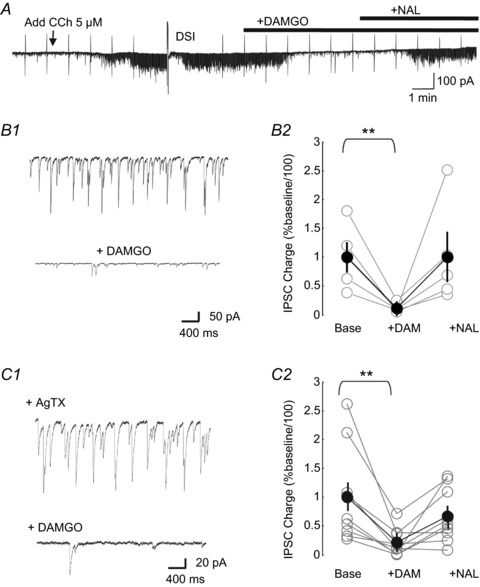
A, example of a continuous whole-cell recording in a CA1 pyramidal cell in a rat hippocampal slice in the presence of ionotropic glutamate receptor (iGluR) antagonists. Application of carbachol (CCh) (arrow) induced a robust increase in rhythmic IPSC activity, which was transiently suppressed by endocannabinoids released by a 2 s voltage command step to 0 mV (depolarization-induced suppression of inhibition, DSI). After recovery from DSI, bath application of DAMGO (1 μm) also abolished the IPSCs, an effect that was reversed by naloxone (NAL). B1, higher magnification of CCh-generated spontaneous IPSC rhythms (upper), and suppressed by DAMGO (lower; different cell from A). B2, group analysis of spontaneous IPSC charge transfer in the presence of CCh before DAMGO, after application of DAMGO and reversal by application of naloxone. Multiple paired t tests followed by Bonferroni corrections confirmed that the effect of DAMGO was significant (P= 0.004, n= 5), but that the apparent reversal by naloxone was not (P= 0.063), when compared with DAMGO. Activity in naloxone was not different from control values. Agatoxin (AgTx) pretreatment was not used in these experiments. C, same experiment repeated in slices pretreated with AgTx (300 nm), which blocks GABA release from parvalbumin (PV) cells. In AgTx-treated slices, CCh induced rhythmic IPSCs (C1, upper) which were abolished by DAMGO and reversed by naloxone (C1, lower; same cell as in A). C2, group data for sIPSC charge transfer (one-way repeated-measures ANOVA, P= 0.008, n= 9; difference between activity in naloxone and activity before DAMGO, n.s., P= 0.105).
Results
Targeted expression of NpHR allows selective silencing of interneuron firing
To determine whether or not selective optogenetic silencing of different classes of interneurons could be accomplished in our hands, we targeted the inhibitory opsin NpHR to either the Gad2-expressing or PV-expressing classes of interneurons as described in Methods. Figure 1A shows an example of NpHR-EYFP expression in PV cells in the hippocampus of PV-Cre mice. Hippocampal slices were taken 11 days after viral injection, and field stimulation with yellow (∼580 nm) light was used to activate NpHR in these cells. As reported previously (Zhang et al. 2007), activation of NpHR with yellow light strongly hyperpolarized the cells (e.g. Fig. 1B, top trace), and abolished their ability to fire action potentials elicited by depolarizing current pulses (e.g. Fig. 1B, middle and lower traces). The same effects were observed in the three cells tested in this way.
Figure 1. Light stimulation of halorhodopsin (NpHR) inhibits action potential firing in interneurons expressing either glutamic acid decarboxylase 2 (Gad2) or parvalbumin (PV).
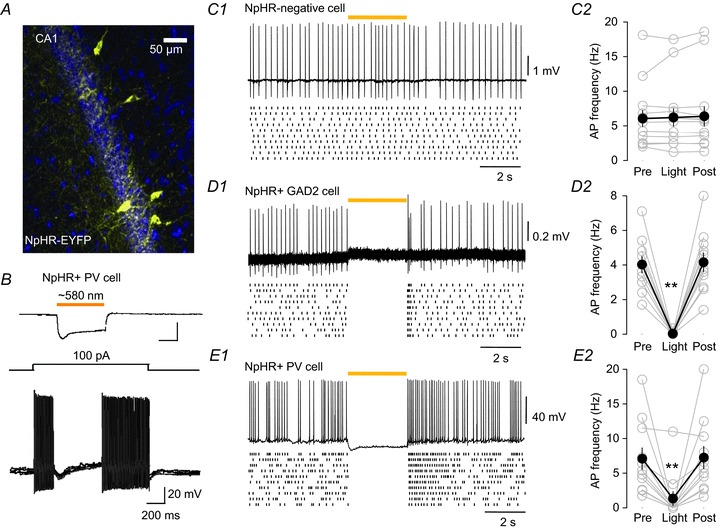
A, expression of NpHR-enhanced yellow fluorescent protein (EYFP) (yellow) in CA1 hippocampus of a PV-Cre mouse injected with adeno-associated virus (AAV)-NpHR-EYFP. B, whole-cell recording from an NpHR-EYFP-positive PV neuron. A 500 ms pulse of yellow light hyperpolarized the cell by >20 mV from its resting membrane potential (−51 mV, top trace) and suppressed current-induced (middle trace) action potential firing (lower traces; five trials overlapped). C1, light stimulation (3 s period indicated by the yellow bar) had no effect on carbachol (CCh)-induced action potentials in a control cell not expressing NpHR. The cell was recorded with a cell-attached patch in current-clamp mode. One example trace is shown at the top, and a dot-raster display (a dot represents the occurrence of a single action potential) of 10 consecutive traces is shown below. The lack of effect of the light is illustrated in both displays as well as in the group data (n= 10) plot in C2. D1, typical recording from a Gad2 cell expressing NpHR; same conventions as in C above; group data (n= 11) in D2. Action potential firing ceased with the onset of the light, and resumed immediately afterwards. Note the brief burst of action potentials that occurs at the end of the light pulse, representing ‘off-spikes’ triggered by the sudden termination of the NpHR-induced membrane hyperpolarization. E1, typical whole-cell current-clamp recording from a PV cell expressing NpHR; conventions as before, group data (n= 11) in E2. A membrane hyperpolarization accompanied the light stimulation, and a burst of off-spikes occurred at light offset. One-way repeated-measures ANOVAs followed by Tukey tests indicated that action potential firing was significantly suppressed during light stimulation for both Gad2 (P < 0.001) and PV (P < 0.002) groups, and that the firing 5–10 s after the light stimulation was not different from firing before the light. Light had no effect on firing in the control group (P= 0.978). **P < 0.01.
Because our goal in this investigation was to determine which interneuron class is responsible for the rhythmic IPSCs that are generated in pyramidal cells when the slices are treated with the muscarinic agonist CCh, it was of particular interest to determine whether action potential firing induced pharmacologically could be inhibited by light activation of NpHR. We therefore recorded action potentials from the somata of 11 NpHR-expressing Gad2 cells, 11 NpHR-expressing PV cells and 10 control (non-NpHR-expressing) cells. Action potentials were induced by bath application of CCh (or, for PV cells, which often did not fire vigorously in CCh alone, a solution containing 10 μm CCh plus 400 nm kainic acid together with a total K+ concentration of 5 mm). All control and Gad2 cells, and six PV cells, were recorded in cell-attached mode; five PV cells were recorded in whole-cell mode. Light stimulation delivered to non-NpHR-expressing cells (n= 10) had no effect on their firing (Fig. 1C, reduction in baseline firing rate of 0.64 ± 3.7%, mean ±s.e.m., n= 10). In contrast, light stimulation of NpHR abruptly and almost completely terminated the induced action potential firing in all Gad2 cells (Fig. 1D, reduction of 99.2 ± 0.8%, n= 11) and in nine of 11 PV cells – of the two remaining PV cells, action potential firing was reduced by 44% in one and unaffected in the other (Fig. 1E, reduction of 85.1 ± 9.5%, n= 11). The example traces from typical cells show interruption of action potential firing in typical Gad2 (Fig. 1D1) and PV (Fig. 1E1) cells. The dot-raster plots beneath the traces depict action potential firing (dots) on 10 consecutive trials each from the illustrated cells. The graphs (Fig. 1C2, D2 and E2) show the group data for each condition; ANOVA confirmed that light-induced suppression of firing was highly significant in both PV (P < 0.002) and Gad2 (P < 0.001) groups, but insignificant (P= 0.978) in the control group (details in figure legend). The bursts of ‘off-spikes’ that occur in NpHR-expressing cells should be noted (e.g. Fig. 1D1 and E1) – the onset of these bursts coincides with the sudden cessation of the light-induced hyperpolarizations (e.g. Fig. 1B and E1), and confirms that the interruption of action potential firing is caused by the change in membrane potential in the given cell, and not by indirect effects.
These experiments demonstrate that we can selectively target the Gad2 or PV cell populations with virally expressed NpHR, and that light stimulation of NpHR essentially eliminates somatic action potential firing activated by bath application of CCh-containing solutions from both interneuron classes. These data do not permit conclusions to be drawn regarding the source of the rhythmic CCh-induced IPSCs that occur in pyramidal cells. Because of the extensive cell-to-cell interactions within interneuronal networks, as well as the existence of numerous inhibitory receptors on interneuronal axons, it is not possible to predict the output of the interneurons simply by examining somatic action potential firing. It is necessary to test the effects of optogenetic silencing methods on the rhythmic IPSCs themselves.
Optogenetic silencing of PV cells does not disrupt CCh-induced IPSC rhythms
To determine whether the inhibition of the IPSCs generated by PV cells would affect IPSC oscillations, we recorded from CA1 pyramidal cells voltage clamped at −70 mV, and bath applied 5 μm CCh in the presence of NBQX and CGP37849 (5 μm each, to block AMPA and NMDA receptors, respectively) to generate rhythmic IPSCs (Pitler & Alger, 1992a b; Martin & Alger, 1999; Reich et al. 2005). If IPSCs originating from PV cells are an integral part of the cholinergically activated inhibitory microcircuit, inhibition of the outputs from these cells should disrupt or even abolish the rhythms. If, however, the PV cell IPSCs are not essential for rhythm generation, inhibition of these IPSCs would have no effect. To test this idea, we applied 5 s pulses of yellow light onto a region (diameter, ∼300 μm) around the recorded cell to activate the NpHR expressed in PV cell projections and to inhibit their ability to release GABA. As shown in the example of Fig. 2A1, activation of NpHR in PV cells did not alter the IPSCs induced by CCh. The spectrograms in Fig. 2A3, constructed using the lower traces in Fig. 2A1, illustrate that the application of CCh to slices taken from PV-Cre mice generates predominantly a low-frequency (∼3 Hz) rhythm. Neither the power nor the peak frequency of the rhythms were changed qualitatively by activation of NpHR (Fig. 2A1 and A3). Group analysis of the total charge crossing the pyramidal cell membrane 5 s before, and again during light stimulation, confirmed that the IPSCs were not significantly disrupted by the activation of NpHR in PV-Cre mice (95.6 ± 27.3% of baseline activity before light stimulation, n= 9, P= 0.485, Fig. 2B). The data suggest that, contrary to the hypothesis, PV cell IPSCs are not an essential component of the rhythms.
To test our alternative hypothesis that CCh-elicited sIPSC rhythms were generated by a different class of interneurons, we also injected AAV-NpHR-EYFP into the hippocampus of Gad2-Cre mice, which express Cre only in interneurons expressing the Gad2 (formerly Gad65) isoform of glutamic acid decarboxylase. The Gad2 interneuron population includes CCK cells, although, importantly, not PV cells, which express primarily the Gad1 (formerly Gad67) isoform (Tricoire et al. 2011). In contrast with the lack of effect of the inhibition of PV cells, silencing of Gad2 interneurons by light stimulation of NpHR reversibly depressed the rhythmic CCh-induced IPSC activity (e.g. Fig. 2A2). The effect of the silencing of Gad2 cells is further illustrated by the spectrogram in Fig. 2A4. Group data confirm that light stimulation significantly reduced the total charge transfer of IPSCs in Gad2-Cre mice (to 39.4 ± 11.5% of baseline levels, n= 10, P= 0.001, Fig. 2B). These results are consistent with the conclusion that the IPSCs originate from the Gad2 population.
In principle, the inability of light to inhibit IPSCs when NpHR is expressed in PV cells could be explained by the weak expression of NpHR in PV cells. To test this possibility, we carried out immunostaining for PV and CCK in PV-Cre and Gad2-Cre mice, respectively, and found that NpHR was expressed equally well in both cases (∼90% of the PV and CCK immunopositive populations of each slice were co-localized with EYFP+ cells, Fig. 2C); therefore the different results in PV-Cre and Gad2-Cre mice cannot be explained by the differential expression of NpHR.
These data suggest that PV cell IPSCs are not a necessary component of the current generator for CCh-induced IPSC rhythms. However, because the total IPSC charge integral within a given epoch depends on both the mean IPSC amplitude and frequency, changes in oscillations themselves, or in the distribution of IPSC amplitude or inter-event intervals, might not have been detected by the analysis. Therefore, we also plotted the cumulative frequency distributions (analysed with Kolmogorov–Smirnov tests, see figure legend for details) for IPSC amplitude and frequency in three pyramidal cells from PV-Cre slices expressing NpHR and in three pyramidal cells from Gad2-Cre slices expressing NpHR which showed similarly robust CCh-induced IPSCs. Light stimulation had no significant effect on IPSC amplitudes when PV cells expressed NpHR (Fig. 3A1, upper). In contrast, when Gad2 cells expressed NpHR, the sIPSC amplitude distribution was shifted significantly to the left by light (Fig. 3A2, upper), indicating that inhibition of Gad2 cells strongly reduced the occurrence of the largest CCh-induced IPSCs recorded in pyramidal cells. Similarly, light stimulation of NpHR had no significant effect on the inter-event interval distribution in pyramidal cells from PV-Cre mice (Fig. 3A1, lower), whereas the same stimulation caused a marked rightward shift (i.e. lower frequency) in the inter-event interval distribution in pyramidal cells from Gad2-Cre mice (Fig. 3A2, lower). These data provide additional support for the conclusion that the persistent large, rhythmic IPSCs in CCh arise overwhelmingly from Gad2 cells rather than PV cells.
Figure 3. Optogenetic silencing of parvalbumin (PV) cells does not alter inhibitory postsynaptic currents (IPSCs) or local field potentials (LFPs) induced by carbachol (CCh).
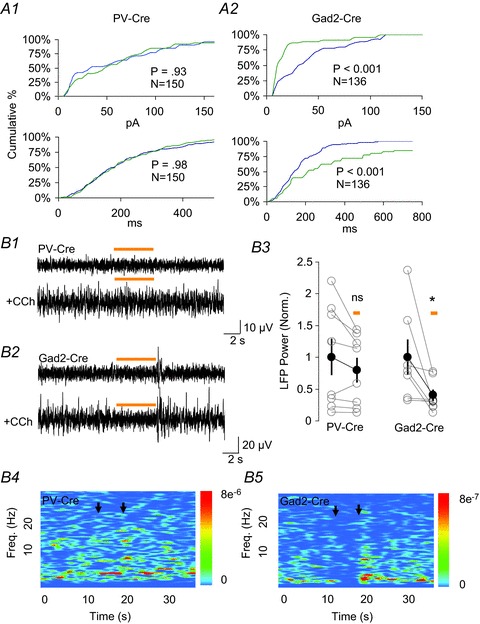
A, cumulative percentage distributions of spontaneous IPSC amplitudes (A1, A2; top plots) and inter-event intervals (A1, A2; bottom plots) in PV-halorhodopsin (NpHR) and glutamic acid decarboxylase 2 (Gad2)-NpHR slices. Each plot was generated from three cells each from PV- or Gad2-Cre mice, using an equal number of events (see graph insets) from each cell. Blue and green traces were taken from 5 s of recording immediately preceding and during NpHR activation, respectively. Kolmogorov–Smirnov tests were used to determine the significance of differences in the distributions. There was no difference between the datasets in A1, top or bottom. The differences in the datasets in A2 (top and bottom) were significant at P < 0.01. B1, B2, representative local inhibitory LFPs under baseline conditions (upper) and after application of CCh (lower) in the CA1 pyramidal layer of PV-Cre mice (B1) or Gad2-Cre mice (B2) injected with adeno-associated virus (AAV)-NpHR-enhanced yellow fluorescent protein (EYFP). Activation of NpHR does not affect the LFP in PV-Cre mice (B1), but reversibly suppresses the LFP in Gad2-Cre mice (B2). B3, group data for effects of PV-NpHR and Gad2-NpHR activation on the summed spectral power from 2–5 Hz of LFPs induced by CCh. The effects of activating NpHR were assessed using paired t tests. In PV-Cre mice there was no significant reduction (to 89.7 ± 6.8% of the control value; P= 0.17), whereas in Gad2-Cre mice the reduction was significant (P= 0.04, reduction to 65.0 ± 11.7% of the control value). The group means and s.e.m. (black symbols and lines) are presented for illustrative purposes only. B4, B5, spectrograms generated for the traces shown in B1 and B2. The colour scales are in units of μV2 Hz−1. Black arrows denote the light pulse.
It is conceivable that, despite the inability of NpHR expressed in PV cells to inhibit CCh-induced IPSCs (cf. Fig. 2A1), a second method of optogenetic silencing might be more effective. Therefore, we repeated the experiments in Fig. 2 using another microbial opsin, Arch, a light-driven proton pump that can also effectively silence neurons both in vitro and in vivo (Chow et al. 2010). We expressed Arch in both PV-Cre and Gad2-Cre mice. However, as with NpHR, activation of Arch in PV interneurons did not have any significant effect on the IPSCs generated by CCh (light reduced sIPSC charge to 94.0 ± 21.0% of pre-light activity levels, n= 9, P= 0.58, data not shown). As was found with NpHR, Arch did reduce the CCh-induced persistent IPSC activity when it was expressed in Gad2 cells (to 61.0 ± 27.0% of pre-light activity levels, n= 6, P= 0.029, data not shown). The similarity of the results obtained with two chemically and functionally distinct inhibitory optogenetic agents strengthens the conclusion that synaptic transmission from PV is not a significant factor in CCh-induced, theta-frequency IPSC rhythms in CA1.
Although CCh-induced IPSCs in pyramidal cells do not seem to originate from PV cells, it could be that the output of these cells onto other cells would influence population activity in the form of the LFPs (cf Ellender & Paulsen, 2010; Oren et al. 2010). To test the possibility of an indirect participation of PV cell IPSCs in rhythm generation, we repeated the light-induced silencing experiment with NpHR, whilst recording LFPs in CA1 stratum pyramidale, still in the presence of iGluR antagonists. Silencing of PV cells did not appear to affect the LFPs, whilst silencing of Gad2+ cells greatly reduced them (Fig. 3B1 and B2). This is further illustrated by the spectrograms in Fig. 3B4 and B5. Group analysis of spectral power shows that light did not significantly reduce the low-frequency (2–5 Hz) LFP in PV-Cre mice (79.6 ± 20.9% of control, n= 8, P= 0.1; Fig. 3B3). By contrast, light did reduce LFP power significantly in Gad2-Cre mice expressing NpHR (to 40.5 ± 10.4% of control, n= 7, P= 0.048, Fig. 3B3). These results fail to provide support for the hypothesis that PV cells have an occult, indirect role in rhythmic, oscillatory inhibitory activity at the CA1 population level.
Finally, we considered alternative explanations for the absence of the effects of optogenetic activation of NpHR or Arch in PV cells on CCh-induced IPSC oscillations. First, cholinergic activation of PV cells during sustained rhythmic activity might be so strong that it could not be overcome by light-induced hyperpolarization, or it may be that insufficient NpHR is expressed in PV cell axon terminals to inhibit GABA release. In order to investigate these possibilities, slices were pretreated with CgTx (500 nm) to block N-type VGCCs, which are essential for GABA release from CCK cells (Hefft & Jonas, 2005; Freund & Katona, 2007). To ensure strong activation of PV cells, a cocktail containing 20 μm CCh, 400 nm kainate and 5 mm K+ (e.g. Buhl et al. 1998) was applied to the bath. This cocktail produced repetitive trains of spontaneous activity lasting 1–2 min in CA1 pyramidal cells, which were significantly reduced (to 66.4 ± 27.1% of control, P= 0.033, n= 5, Fig. 4A) by light stimulation delivered to the NpHR-expressing PV cells. As a further test of the ability of NpHR activation to suppress IPSCs arising from PV cells, we investigated electrically evoked IPSCs again in the presence of CgTx to remove IPSCs originating from CCK and other non-PV interneurons. Light stimulation clearly (to 54 ± 6% of control, P= 0.016, n= 7; data not shown) and reversibly suppressed these electrically evoked IPSCs as well. NpHR can therefore suppress IPSCs arising from PV cells, even when they are strongly activated.
Figure 4. Halorhodopsin (NpHR) activation can effectively silence GABA release from strongly activated parvalbumin (PV) basket cell networks.
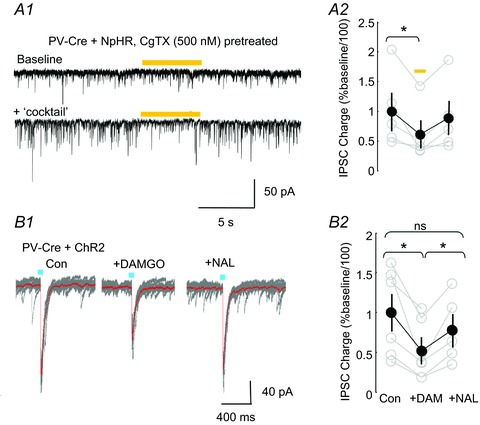
A1, positive control for ability of NpHR to inhibit PV cell GABA release. In a slice in which PV cells were transfected with NpHR, spontaneous inhibitory postsynaptic currents (IPSCs) were evoked by a cocktail containing 20 μm carbachol (CCh), 400 nm kainate, with a total K+ concentration of 5 mm; IPSCs originating from interneurons, including the PV cells that release GABA via activation of presynaptic P/Q-type voltage-gated Ca2+ channels (VGCCs), were isolated with ω-conotoxin-GVIA (CgTx) pretreatment [to block N-type VGCCs and therefore the output of cholecystokinin (CCK) interneurons among others]. Transient NpHR activation with a yellow light pulse reversibly reduced the IPSC activity. A2, group analysis of spontaneous IPSC charge transfer before, during and immediately after NpHR activation in the presence of the stimulatory cocktail shows significant depression of IPSCs (one-way repeated-measures ANOVA, P= 0.033, n= 5), and there was no difference between the activity before and after the light (P= 0.609). B1, B2, adeno-associated virus (AAV) targets a significant proportion of PV- and μ-opioid receptor (MOR)-expressing interneurons. B1, in a slice in which PV cells were transfected with channelrhodopsin2 (ChR2), blue light evoked synchronous IPSCs (L-IPSCs). L-IPSC amplitudes were reduced by the MOR agonist DAMGO (1 μm) and restored by subsequent application of the MOR antagonist naloxone (NAL) (10 μm). Ten consecutive, superimposed traces in grey and averaged trace in red. B2, group data of DAMGO and DAMGO plus naloxone effects on the PV IPSC. DAMGO significantly suppressed the IPSCs (one-way repeated-measures ANOVA, P= 0.004, n= 6), and this was reversed by naloxone (one-way ANOVA showed no difference between activity in naloxone and activity before DAMGO, P= 0.505).
A second possible explanation for the lack of an effect of the silencing of PV cells is that AAV does not transduce PV basket cells as efficiently as it does other PV cells in CA1, or that Cre expression in PV basket cells is weaker than in other PV cells. Axo-axonic cells constitute a prominent class of PV-expressing, but non-basket cell, interneurons (e.g. Freund et al. 2003; Klausberger & Somogyi, 2008). High sensitivity to MOR activation distinguishes PV basket cells from PV axo-axonic cells. The output of PV basket cells is strongly suppressed by MOR agonists, such as DAMGO, whereas the output from axo-axonic cells is not (Gulyas et al. 2010). To determine whether our viral AAV transfection methods were effective in PV basket cells, we injected AAV-ChR2-mCherry into the hippocampus of PV-Cre mice. In six of six pyramidal cells tested, brief blue-light (∼470 nm) pulses generated IPSCs that could then be reduced by DAMGO (from 239.7 ± 59.0 pA to 124.0 ± 40.6 pA, n= 6, P= 0.004; Fig. 4B1–2). These results confirm that a significant proportion of the PV/MOR-expressing interneurons, probably including the PV basket cells, is successfully infected by AAV.
As a final check that the NpHR virus infects, and that light stimulation of NpHR silences, PV basket cells, PV-Cre mice were co-injected with AAV-ChR2-mCherry and AAV-NpHR-EYFP. It is predicted that concurrent activation of both NpHR and ChR2 will result in a smaller ChR2-induced PV IPSC than is produced in the absence of NpHR. The bandwidth of blue light used for ChR2 excitation also activated NpHR by ∼30% of its maximum (normally produced by yellow light) in PV cells (Fig. S1A), as expected from the published excitation spectrum for NpHR (Zhang et al. 2007). Accordingly, blue-light stimulation (5 ms) given to PV cells expressing both ChR2 and NpHR should produce off-setting effects, with the hyperpolarization caused by NpHR partially counteracting the depolarization caused by ChR2. Indeed, blue pulses applied to PV cells expressing both molecules did not generate any IPSCs in three of four cells tested, suggesting that the effect of NpHR was sufficient to prevent action potential firing in these cells. Subsequent bath application of a low concentration (15 μm) of the K+ channel blocker 4-aminopyridine (4-AP) enhanced the effect of ChR2 (Petreanu et al. 2007; Nagode et al. 2011), shifting the excitation/inhibition balance back towards excitation, and allowing the light stimulus to trigger GABA release (Fig. S1B). This confirms that ChR2 was indeed functionally expressed in the ChR2/NpHR-expressing cells, and hence that concurrent NpHR activation blocked ChR2-activated GABA release from PV basket cells.
Taken together, the previous results make a compelling case that PV interneurons, including PV basket cells, have essentially no role in generating CCh-induced, theta-frequency IPSCs, and that instead the oscillations originate from the Gad2+/CB1R+ interneuron population.
MOR activation can suppress cholinergically generated IPSC rhythms independently of PV cells
At first glance, the conclusion from the results in Figs 2–4 obtained in the CA1 region differs from that of previous studies (Oren et al. 2006,2010; Gulyas et al. 2010), i.e. that PV cell firing is required for mAChR-generated inhibitory rhythms in CA3. This might suggest that the CA1 oscillatory circuitry is fundamentally different from that in CA3. However, the two rhythms (theta versus gamma) differ, and there are technical (optogenetics versus pharmacological stimulation) and species (mice versus rats) differences as well, which could also account for the competing conclusions.
Our finding that PV cells are not involved in generating theta-frequency rhythmic IPSCs in mouse CA1 is consistent with previous evidence from studies on mice indicating that these CCh-induced IPSCs are very sensitive to inhibition by endogenous cannabinoids (Nagode et al. 2011), implying that they originate from CB1R+ interneurons. Inasmuch as the vast majority of CB1Rs that are on interneurons in CA1 are on CCK cells, and are notably absent from PV cells (Freund et al. 2003; Freund & Katona, 2007), it is most likely that the CCK population is responsible for the CCh-induced inhibitory rhythms, as argued previously (Reich et al. 2005; Nagode et al. 2011; Yoshino et al. 2011). The question arises as to how else the rhythms might be regulated. As the PV basket cells are heavily invested with MORs, and as we have found no evidence for the participation of PV cells in CCh-induced oscillations, we anticipated that the CCh-induced IPSC oscillations would be unaffected by the MOR agonist DAMGO. To test this prediction, we applied CCh to rat hippocampal slices in the presence of iGluR antagonists. This resulted in a sustained increase in sIPSC activity, which was reversibly suppressed by endocannabinoid release via DSI (cf Wilson & Nicoll, 2001; Fig. 5A). However, contrary to our prediction, subsequent application of DAMGO to the same cell also reversibly abolished the sIPSC activity. Figure 5B further demonstrates the predominant low-frequency rhythmic activity generated by application of CCh and its marked depression by DAMGO. Group analysis showed that DAMGO significantly (multiple paired t tests with Bonferroni corrections, P= 0.004, n= 5) reduced the total charge transfer of CCh-induced IPSCs (to 11.6 ± 3.9% of pre-DAMGO sIPSC charge, Fig. 5B2), although the apparent recovery in naloxone was not significant.
These results are consistent with a MOR+ interneuron population also being required to generate CCh-induced rhythms; yet, the most likely candidate interneurons, the PV basket cells, have been ruled out. Other interneurons in CA1 express MORs to varying degrees, although reportedly not CCK cells (Drake & Milner, 2002). As noted earlier, PV interneurons release GABA solely through the activation of P/Q-type VGCCs (Hefft & Jonas, 2005), whereas GABA release from CCK interneurons is unaffected by the blocking of P/Q-type VGCCs because they release GABA by the activation of N-type VGCCs (Freund et al. 2003; Hefft & Jonas, 2005; Freund & Katona, 2007). The reasons for this dichotomy are not understood, but may be related to the differences between the mechanisms of the tightly coupled ‘synchronous’ GABA release from PV cells, and the ‘loosely coupled’‘asynchronous’ release mechanism that dominates GABA release from CCK cells (Hefft & Jonas, 2005). Modulation of GABA release by DSI (Lenz et al. 1998) and endocannabinoids (Wilson et al. 2001) is fully prevented by blocking N-type VGCCs, but unaffected by blocking P/Q-type VGCCs, which is consistent with the mass of evidence indicating that CCK cells, but not PV cells, express CB1Rs and are the targets of cannabinoids (e.g. Freund et al. 2003; Kano et al. 2009). In slices pretreated with the P/Q-type VGCC blocker AgTx (300 nm), we observed that DAMGO still suppressed the IPSCs (to 21.3 ± 8.4% of control, one-way repeated-measures ANOVA, P= 0.008, n= 9, Fig. 5C). We confirmed that this concentration of AgTx was effective in preventing release from PV cells in mice, because it virtually abolished (reduction to 2.16% of control values) the ChR2-elicited activation of L-IPSCs arising from PV cells: the peak amplitudes of the L-IPSCs were 1201 ± 140 pA in control (n= 6) and 26 ± 4 pA in AgTx-treated (n= 10) slices (P < 0.001; data not shown). AgTx reduces transmission from interneurons other than simply PV cells, of course (e.g. Freund & Katona, 2007; Klausberger & Somogyi, 2008). Nevertheless, the increase in CCh-induced inhibitory charge transfer was up to 7.8 ± 1.1 times baseline level in control slices, and up to 16.6 ± 5.2 times baseline in AgTx-treated slices, i.e. no significant difference (P= 0.25), suggesting that the AgTx-sensitive cells may contribute little to the CCh-induced rhythms. Thus, pharmacological activation of MORs suppresses CCh-induced rhythms in CA1 in rats independently of reducing perisomatic inhibition via PV interneurons.
Rhythmic IPSCs and LFPs activated by endogenous ACh in CA1 pyramidal cells are equally sensitive to CB1R and to MOR activation
The dual sensitivity (to CB1R and MOR agonists) of CCh-induced IPSCs in Fig. 5 could be an artefact of the bath application technique, which should activate all mAChRs on all cells. In order to test for the physiological relevance of these findings, we induced rhythmic low-frequency IPSCs in CA1 pyramidal cells by 5-Hz blue-light stimulation of ChR2-expressing cholinergic fibres in hippocampal slices from ChAT-Cre mice (Bell et al. 2011; Gu & Yakel, 2011; Nagode et al. 2011). All experiments were performed in the presence of glutamate receptor antagonists, plus eserine (1 μm) and 4-AP (5–15 μm; Nagode et al. 2011). As reported, trains of blue-light pulses delivered to the field surrounding the patched pyramidal cell initiated rhythmic bursts of L-IPSCs (Fig. 6A1, upper trace; upper spectrogram in 6A2). Also, as reported, these L-IPSCs were significantly attenuated by DSI (Fig. 6A1, second trace, to 58 ± 10.4% of control, n= 8; cf. Nagode et al. 2011). We now report that bath application of DAMGO (1 μm) also strongly suppressed the L-IPSCs (Fig. 6A1, third trace, lower spectrogram in Fig. 6A2). In the presence of DAMGO, light stimulation no longer caused a significant increase in IPSC amplitude or frequency (Fig. 6A1 and B1, two-way repeated-measures ANOVA, see figure legend). The effects of DAMGO were completely reversed by subsequent application of the MOR antagonist naloxone (10 μm, Fig. 6A1 and B1). We confirmed that the L-IPSCs were indeed CB1R sensitive by applying the CB1R agonist WIN. As shown in Fig. 6B2, WIN (5 μm) application also prevented any significant increase by light of IPSC amplitude or frequency (two-way repeated-measures ANOVA, see figure legend). Thus, IPSC rhythms generated by endogenous ACh are sensitive to both CB1R and MOR agonists.
Although neither IPSC frequency nor amplitude was generally increased by ChR2 activation when CB1Rs or MORs were blocked, in some experiments small changes did seem to occur (cf. Fig. 6B). We therefore determined the reduction in total L-IPSC charge transfer, which takes both frequency and amplitude into account, by DAMGO and WIN. Both DAMGO and WIN could suppress L-IPSC charge by a maximum of ∼80% (Fig. 7A), suggesting that there is a significant amount of overlap between CB1R- and MOR-sensitive L-IPSC populations. To assess this overlap quantitatively, we plotted the degree of sIPSC suppression caused by DSI (y-axis) against the degree of sIPSC suppression caused by DAMGO (x-axis) for each individual pyramidal cell tested in both ways (Fig. 7B). The diagonal line in the graph represents the points at which x+y= 1, i.e. the locus of points at which the two forms of suppression sum linearly. Points to the left of this line could represent cases in which the IPSCs from non-overlapping subsets of the stimulated population of interneurons are suppressed. For these cases, it is possible that the IPSCs are mediated by independent groups of interneurons expressing either CB1Rs or MORs, such that each group accounts for only a fraction of the total IPSC response suppression. Data points falling to the right of the diagonal, however, represent supralinear summation of suppression; activation of either CB1R or MOR causes an IPSC suppression of >50% of the total response. In these cases, the parsimonious explanation is that many of the IPSCs are produced by interneurons expressing both CB1Rs and MORs, such that their output can be reduced by both cannabinoids and opioids. For seven of the eight experiments, the data fell into the supralinear range and, indeed, in four cases diverged from the line by >50% indicating that a substantial group of CB1R+ and MOR+ cells must exist. The mean degree of overlap for the entire group calculated in this way was 42 ± 13% (n= 8). These results imply significant overlap in the ability of cannabinoids and opioids to suppress cholinergically induced sIPSC activity.
Figure 7. Significant overlap between populations of ACh-induced rhythmic inhibitory postsynaptic currents (IPSCs) sensitive to μ-opioid receptor (MOR) and type 1 cannabinoid receptor (CB1R) activation.
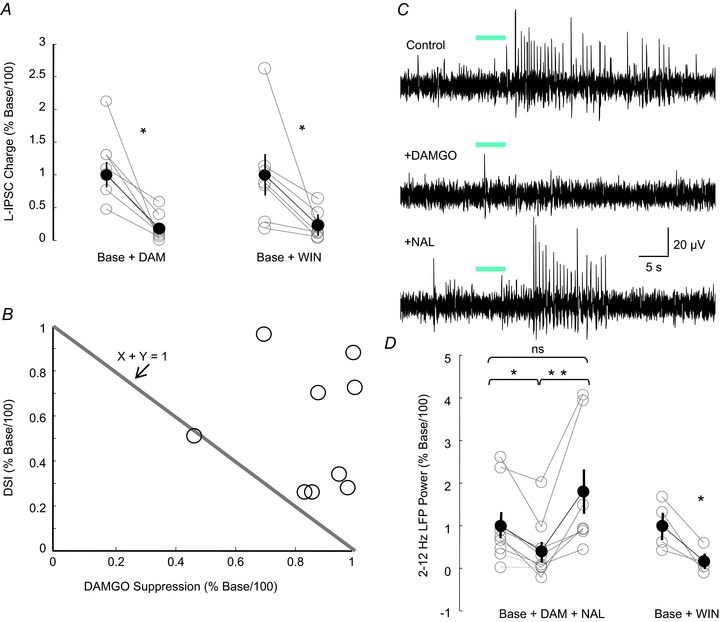
A, group data of the reduction of light-evoked (L-)IPSC charge transfer caused by both DAMGO and WIN55212–2 in ChAT-Cre mice expressing channelrhodopsin2 (ChR2). In two different groups of slices, DAMGO (paired t test, P < 0.05, n= 7) or WIN (paired t test, P < 0.05, n= 7) suppressed the light-induced inhibition by ∼80%, suggesting overlap between MOR-expressing and CB1R-expressing interneuron populations. B, the graph plots the degree of reduction in L-IPSC charge transfer caused by depolarization-induced suppression of inhibition (DSI) versus the degree of reduction caused by DAMGO. The diagonal line is drawn according to x+y= 1, and indicates the locus of points in which the sum of the DAMGO and DSI suppression is linear (on the line), sublinear (to the left of the line) or supralinear (to the right of the line). Data points in the supralinear range are compatible with the conclusion that there is overlap between the populations of MOR-expressing and CB1R-expressing cells generating ACh-induced IPSCs. C, local field potentials (LFPs) induced by release of endogenous ACh are also suppressed by both MOR and CB1R activation. LFP recording from the CA1 pyramidal layer in a slice from a ChAT-Cre mouse expressing ChR2 in cholinergic medial septal axons with ionotropic glutamate receptor (iGluR) antagonists, eserine and 4-aminopyridine (4-AP) present in the artificial cerebrospinal fluid (ACSF). DAMGO reversibly suppresses the light-evoked LFPs. D, as is the case with the ACh-induced IPSCs (B), both DAMGO (left plot, one-way repeated-measures ANOVA, P < 0.001, n= 10) and WIN55212–2 (right plot, paired t test, P < 0.05, n= 4) significantly reduce the LFP power (2–12 Hz).
LFPs are often used as bioassays for the cholinergically activated rhythms (Oren et al. 2006,2010; Gulyas et al. 2010) rather than IPSCs. We have reported that the optogenetically activated L-IPSCs in the presence of iGluR antagonists drive sustained inhibitory LFPs in CA1 (Nagode et al. 2011). We have repeated these observations (Fig. 7C), and now report that, as predicted from the results in the whole-cell recordings, the L-LFPs can be significantly suppressed by DAMGO (one-way repeated-measures ANOVA, P < 0.001, n= 10), as well as by WIN (Fig. 7D). This confirms that our results are not artefacts of the IPSC bioassay for inhibitory rhythms. It also suggests that the inhibitory circuits that drive field potential rhythms in CA1 are highly sensitive to both cannabinoids and opioids, and might therefore contribute to the modification of behaviourally relevant rhythms by these systems.
Discussion
Our results lead to three major conclusions. (1) Despite their prominent roles in many neuronal oscillations, PV interneurons are not required for the generation of cholinergically driven, theta-frequency range inhibitory oscillations in the CA1 region. (2) Rather, such rhythms arise from an intrinsic inhibitory circuit consisting mainly of CB1R+ and Gad2+ cells, probably mainly the CCK cells on which CB1Rs are predominantly expressed (Katona et al. 1999; Marsicano & Lutz, 1999; Freund & Katona, 2007). (3) In addition to being dramatically inhibited by cannabinoid agonists, the output of this circuit is also highly susceptible to suppression by MOR agonists. This was unexpected because PV cells profusely express MORs (Freund & Buzsaki, 1996). Although we have not identified the PV-lacking and MOR-expressing interneurons, the large degree of overlap in susceptibility to both CB1R and MOR agonists, together with previous reports from other laboratories, may be most easily explained if some CB1R+ interneurons that are active during cholinergically induced rhythms are also MOR+ (discussed further below).
Early work on DSI pointed to the existence of a specific subgroup of GABAergic interneurons that were uniquely sensitive to DSI (Pitler & Alger, 1992a, 1994; Martin et al. 2001). These interneurons were identified as CB1R+ when the retrograde signal for DSI was found to be an endocannabinoid (Ohno-Shosaku et al. 2001; Wilson & Nicoll, 2001). It was also known that the P/Q-type VGCC blocker, AgTx, did not reduce DSI (Lenz et al. 1998; Wilson et al. 2001). The CB1R+ cells that released GABA via N-type, but not P/Q-type, VGCCs (presumably the CCK cells) were identified as the DSI targets in the hippocampus (Wilson et al. 2001). The discovery that mAChR agonists also stimulated endocannabinoid release and suppressed IPSCs (Kim et al. 2002; Ohno-Shosaku et al. 2003) pointed to the same interneurons as the likely targets for this form of CB1R-mediated suppression. These observations were extended by paired interneuron–pyramidal cell recordings, which showed that CCh depresses IPSCs from CCK cells in an endocannabinoid-dependent manner (Neu et al. 2007; Gulyas et al. 2010). Gulyas et al. ()2010 suggested that, although CCK cells do fire during CCh-induced oscillations, GABA release from their axon terminals will be muted by the mAChR-induced release of endocannabinoids. However, although this inference is reasonable in the context of the paired-cell recording situation, it leaves unexplained the often repeated and widely accepted observation that large-amplitude, persistent rhythmic IPSC activity stimulated by CCh is extremely sensitive to suppression by DSI and by CB1R activation in general (e.g. Pitler & Alger, 1992a, 1994; Martin & Alger, 1999; Wilson & Nicoll, 2001; Wilson et al. 2001; Kim et al. 2002; Hampson et al. 2003; Fortin et al. 2004; Trettel et al. 2004). If GABA output from CCK cells were entirely muted, this sensitivity would constitute a paradox, or perhaps mean that another prominent population of CB1R-expressing interneurons has been overlooked by the previous neuroanatomical studies (Katona et al. 1999; Marsicano & Lutz, 1999; Freund & Katona, 2007; Kano et al. 2009). This, however, seems very unlikely.
Alternatively, the apparently disparate findings may be reconciled by the recognition that endocannabinoid actions are susceptible to subtle forms of regulation.
The degree of CB1R-mediated suppression of GABA release is inversely related to the firing frequency of the interneuron (Losonczy et al. 2004; Foldy et al. 2006); as the firing frequency rises, suppression of GABA release caused by the CB1R agonist, WIN, declines. We have confirmed that, in paired interneuron–pyramidal cell recordings (2/2), the endocannabinoid-mediated suppression of the unitary IPSC induced by an mAChR agonist is reversibly relieved when the interneuron is driven to fire at ∼20 Hz (A.-H. Tang & B. E. Alger, unpub. obs.). Given that CCh stimulates the firing of CCK interneurons (Cea-del Rio et al. 2010; Gulyas et al. 2010), it is likely that, when the interneurons fire freely, a balance is struck between the degree of CB1R-mediated suppression of release and the relief of this suppression caused by the increased action potential firing. Further increases in endogenous cannabinoid levels produced by the DSI process could transiently tip the balance again towards suppression of the rhythmically occurring IPSCs.
CB1R-mediated depression is subject to regulation of other kinds. For instance, the K+-channel antagonist, 4-AP, at concentrations of 50 or 100 μm, abolishes DSI (Alger et al. 1996; Morishita et al. 1998), as does infusion of K+ channel blockers into the interneuron through the whole-cell recording pipette (Diana & Marty, 2003). The mechanism of action of potassium channel blockers on CB1R-mediated synaptic depression probably involves an increase in intracellular Ca2+ in the interneuron terminal, which can overcome presynaptic inhibition (e.g. Klapstein & Colmers, 1992). mAChR activation suppresses the activity of various K+ channels, and the depression of GABA release normally produced by CB1R activation could be partially offset by competing actions of mAChR activation elsewhere on the interneurons.
Finally, CB1R+ interneurons are electrically coupled to one another (Galarreta et al. 2004) and the CCh-induced rhythmic IPSC activity reflects the output from this circuit onto pyramidal cells. The present results confirm that the Gad2+/CB1R+ interneuron population, including, to a large extent, the CCK cells, is the most likely source for the large, theta-frequency, CCh-induced IPSCs. Perhaps depolarizing interactions among the electrically coupled cells can partially overcome the endocannabinoid-mediated suppression of their output. A major focus of future work must be on mechanisms which can explain these observations and reconciling them with the evidence that CCh suppresses GABA release driven by somatic action potentials in the same cell group. An especially interesting possibility is that regulatory phenomena localized in the interneuronal axons operate to some extent independently of cell somata.
The net effects of CCh-induced endocannabinoid release at the circuit level are no doubt more complex than can be detected in the paired-cell recording configuration, which monitors only the output of one single cell. Recognition that the endocannabinoid system does not act as a simple ‘on–off’ switch, but as a delicate and adjustable regulator of synaptic neurotransmitter release, underscores the rich repertoire of actions in which it can participate.
The proposal that PV cells are not involved in generating certain types of inhibitory oscillations in vitro in the hippocampus might seem controversial; however, it is in fact consistent with recent in vivo studies. For example, optogenetic silencing of PV cells in CA1 in vivo during theta rhythm alters the timing of pyramidal cell spiking, but not the rhythm itself (Royer et al. 2012). The question of what happens to PV cell GABA release during low-frequency ACh-induced rhythms when the PV cells should be activated in CA1 (e.g. Fig. 1E) in vitro remains open. Because NpHR did not abolish action potential firing in all PV cells (e.g. Fig. 1E), a minor contribution of PV cell IPSCs to the CCh-induced IPSC rhythms cannot be ruled out. However, in the CA1 region, CCK cells synapse onto PV cells (Karson et al. 2009) and one possibility is that GABA release from CCK cells inhibits PV cells during ACh-induced rhythms (cf Wulff et al. 2009). Combined with M2 mAChR-mediated suppression of GABA release from PV terminals (Hajos et al. 1998; Gulyas et al. 2010), this could contribute to the reduction in PV cell output during strong cholinergic activation, particularly when glutamate synapses are inhibited. Circuit phenomena, such as gamma rhythms in which PV cells play the dominant role, are strongly dependent on the presence of glutamatergic synaptic signalling (Gillies et al. 2002).
Our finding that low-frequency ACh-induced inhibitory rhythms in CA1 are sensitive to both CB1R and MOR activation is new, and points to a novel circuit mechanism. A model of dual cannabinoid/opioid sensitivity in a mixed excitatory and inhibitory cell circuit has been proposed for gamma oscillations in CA3 (Holderith et al. 2011). In that context, CB1R activation reduces the CCh-induced LFP in CA3 by decreasing excitatory drive onto PV cells. In turn, the release of GABA onto CA3 pyramidal cells is suppressed by DAMGO (Gulyas et al. 2010). Nevertheless, even if this model is generally correct for CA3 gamma rhythms, it cannot explain the ACh-induced inhibitory theta rhythm generation in CA1, which is insensitive to iGluR antagonists or PV cell participation.
If a mixed, excitatory–inhibitory model cannot account for our observations, the question of which cells mediate the opioid sensitivity of the inhibitory theta rhythms in CA1 arises. There are several possibilities. A second, non-PV, but MOR-expressing interneuron population could interact in some way with CCK basket cells, for example via electrical coupling, excitatory neuropeptide release or disinhibition. Potential neuronal candidates would include the Ivy and Neurogliaform cells, which express MORs, and whose output is greatly suppressed by DAMGO (Krook-Magnuson et al. 2011). Ivy cells target proximal dendrites of pyramidal cells, and fire persistently when strongly depolarized (Krook-Magnuson et al. 2011). Ivy cells also express – and presumably release – neuropeptide Y, and are extensively electrically interconnected (Fuentealba et al. 2008). The effect of cholinergic agonists on Ivy/Neurogliaform-expressing cells has not been studied in hippocampus. Somatostatin-containing interneurons, which include the stratum oriens-lacunosum moleculare (O-LM) cells, also show high expression of MORs (Drake & Milner, 2002). O-LM cells exhibit rhythmic bursting in response to cholinergic agonists (Chapman & Lacaille, 1999; Lawrence, 2008). The effect of MOR agonists on O-LM cells has apparently not been investigated and, because these cells target distal dendritic regions (Freund & Buzsaki, 1996), it is unlikely that they would contribute directly to the perisomatic currents generated by ACh.
An intriguing possible explanation for our results is that MOR activation directly modulates GABA release from CCK cells. Although MORs were not found on the somato-dendritic regions of CCK cells in an electron microscopy investigation (Drake & Milner, 2002), in six of 13 whole-cell recordings from CA1 pyramidal cells, DAMGO prevented the expression of CB1R-dependent inhibitory long-term depression (Lafourcade & Alger, 2008), and it was suggested that some CCK interneurons might express both CB1Rs and MORs. This proposal is consistent with data from paired recordings of unitary IPSCs from synaptically coupled CB1R+ cells and pyramidal cells. These studies (Neu et al. 2007; Glickfeld et al. 2008) reported that, in small percentages of the pairs – 25% (2/8) and 11% (1/9), respectively – DAMGO significantly (∼40% reduction), and reversibly depressed unitary IPSC amplitudes. These high-resolution electrophysiological observations directly support the concept that a subpopulation of CB1R+ (presumably CCK) basket cells expresses both MORs and CB1Rs. The electron microscopy study of Drake and Milner ()2002 did not focus on the axon terminal regions of CCK cells, and MORs there might have gone undetected. We have shown that DAMGO potently inhibited GABA release triggered by the application of ACh focally to GABAergic terminal regions (Tang et al. 2011), an effect that would not be easily explained if MORs existed solely on somato-dendritic membranes distant from the axons. In any event, our present data are compatible with a close but thus far under-appreciated association between CB1Rs and MORs in CA1. Intimate connections among MORs and CB1Rs have been observed elsewhere. For instance, CB1Rs have been localized to patches of MORs in rat caudate putamen neurons (Rodriguez et al. 2001), and MORs and CB1Rs form heterodimers in expression systems (e.g. Hojo et al. 2008; but cf. Christie, 2006).
Although details remain to be worked out, our data demonstrate that an MOR- and CB1R-expressing interneuron circuit plays a disproportionately large role in the generation of ACh-dependent theta rhythms. Almost all of the optogenetically activated, CB1R-sensitive IPSCs from ChAT-Cre mice were also very much reduced by DAMGO (e.g. Fig. 6). It is interesting to speculate that, although the involvement of a presently uncharacterized cell group cannot be ruled out, putative MOR+/CB1R+ cells would seem to be the most likely candidates. This conclusion leads to a puzzle: if the fraction of cells jointly expressing MORs and CB1Rs is as small as found by Neu et al. ()2007 and Glickfeld et al. ()2008, the high percentage of IPSCs suppressed by both DAMGO and DSI in our investigation is unexpected. Three possibilities present themselves: (1) the paired-recording procedure is biased against recording from those interneurons that express MORs together with CB1Rs; the low percentages observed in these experiments would not be representative of the entire CB1R+ interneuron population; (2) the whole-cell recording configuration somehow reduces the ability of MOR activation to suppress GABA release in most of the paired-cell cases; and, finally and most interestingly, (3) it is possible that a subgroup of CB1R+ interneurons also expresses MORs and is a preferential target of synaptically released ACh. It will be important to test these hypotheses in future work. The postulated circuit – jointly sensitive to cannabinoids and opioids – could constitute a novel mechanism that might not only contribute to an understanding of theta-frequency inhibitory rhythms in vivo, but could also serve as an integration point for interactions between endogenous opioids and cannabinoids, and even between the therapeutic and abused drugs that target their receptors.
Acknowledgments
We are grateful to Dr Matthias Klugmann (University of New South Wales, Australia) for supplying some of the AAV virus that was used in early experiments.
Glossary
- 4-AP
4-aminopyridine
- AAV
adeno-associated virus
- AChR
ACh receptor
- ACSF
artificial cerebrospinal fluid
- AgTx
agatoxin
- omega-Arch
archaerhodopsin
- CB1R
type 1 cannabinoid receptor
- CCh
carbachol
- CCK
cholecystokinin
- CgTx
omega-conotoxin
- ChR2
channelrhodopsin2
- DSI
depolarization-induced suppression of inhibition
- EYFP
enhanced yellow fluorescent protein
- Gad2
glutamic acid decarboxylase 2
- GFP
green fluorescent protein
- iGluR
ionotropic glutamate receptor
- IPSC
inhibitory postsynaptic current
- KPBS
potassium phosphate-buffered saline
- L-
light-evoked
- LFP
local field potential
- mAChR
muscarinic acetylcholine receptor
- MOR
μ-opioid receptor
- NpHR
halorhodopsin
- O-LM
stratum oriens-lacunosum molecular
- PV
parvalbumin
- sIPSC
spontaneous inhibitory postsynaptic current
- VGCC
voltage-gated Ca2+ channel
Additional information
Competing interests
The authors declare no competing financial interests.
Author contributions
D.A.N. initiated the project and carried out most of the experiments, data analysis and preparation of the figures (most of the work is contained in his unpublished PhD thesis for the University of Maryland Graduate School). A-H.T. participated in some of the experiments, data analysis and preparation of the figures. K.Y. participated in some of the experiments. B.E.A. supervised the project, and provided laboratory space and funding. D.A.N. wrote the first draft of the manuscript; the final version was edited by D.A.N., A-H.T. and B.E.A., and all authors read and approved the final version.
Funding
We are grateful for financial support from the National Institutes of Health (NIH) grants RO1 MH077277 and DA014625 to B.E.A. and F31 NS074880-01 to D.A.N.
Author’s present address
Present address of D.A.N. is Department of Biology, University of Maryland, College Park, MD 20742, USA.
Fig. S1A
References
- Alger BE. Retrograde signalling in the regulation of synaptic transmission: focus on endocannabinoids. Prog Neurobiol. 2002;68:247–286. doi: 10.1016/s0301-0082(02)00080-1. [DOI] [PubMed] [Google Scholar]
- Alger BE, Pitler TA, Wagner JJ, Martin LA, Morishita W, Kirov SA, Lenz RA. Retrograde signalling in depolarization-induced suppression of inhibition in rat hippocampal CA1 cells. J Physiol. 1996;496:197–209. doi: 10.1113/jphysiol.1996.sp021677. [DOI] [PMC free article] [PubMed] [Google Scholar]
- Atasoy D, Aponte Y, Su HH, Sternson SM. A FLEX switch targets channelrhodopsin-2 to multiple cell types for imaging and long-range circuit mapping. J Neurosci. 2008;28:7025–7030. doi: 10.1523/JNEUROSCI.1954-08.2008. [DOI] [PMC free article] [PubMed] [Google Scholar]
- Bartos M, Elgueta C. Functional characteristics of parvalbumin- and cholecystokinin-expressing basket cells. J Physiol. 2012;590:669–681. doi: 10.1113/jphysiol.2011.226175. [DOI] [PMC free article] [PubMed] [Google Scholar]
- Bell KA, Shim H, Chen CK, McQuiston AR. Nicotinic excitatory postsynaptic potentials in hippocampal CA1 interneurons are predominantly mediated by nicotinic receptors that contain alpha4 and beta2 subunits. Neuropharmacology. 2011;61:1379–1388. doi: 10.1016/j.neuropharm.2011.08.024. [DOI] [PMC free article] [PubMed] [Google Scholar]
- Bender KJ, Ford CP, Trussell LO. Dopaminergic modulation of axon initial segment calcium channels regulates action potential initiation. Neuron. 2010;68:500–511. doi: 10.1016/j.neuron.2010.09.026. [DOI] [PMC free article] [PubMed] [Google Scholar]
- Buhl EH, Tamás G, Fisahn A. Cholinergic activation and tonic excitation induce persistent gamma oscillations in mouse somatosensory cortex in vitro. J Physiol. 1998;513:117–126. doi: 10.1111/j.1469-7793.1998.117by.x. [DOI] [PMC free article] [PubMed] [Google Scholar]
- Cea-del Rio CA, Lawrence JJ, Tricoire L, Erdelyi F, Szabo G, McBain CJ. M3 muscarinic acetylcholine receptor expression confers differential cholinergic modulation to neurochemically distinct hippocampal basket cell subtypes. J Neurosci. 2010;30:6011–6024. doi: 10.1523/JNEUROSCI.5040-09.2010. [DOI] [PMC free article] [PubMed] [Google Scholar]
- Cea-del Rio CA, McBain CJ, Pelkey KA. An update on cholinergic regulation of cholecystokinin-expressing basket cells. J Physiol. 2012;590:695–702. doi: 10.1113/jphysiol.2011.225342. [DOI] [PMC free article] [PubMed] [Google Scholar]
- Chapman CA, Lacaille JC. Cholinergic induction of theta-frequency oscillations in hippocampal inhibitory interneurons and pacing of pyramidal cell firing. J Neurosci. 1999;19:8637–8645. doi: 10.1523/JNEUROSCI.19-19-08637.1999. [DOI] [PMC free article] [PubMed] [Google Scholar]
- Choi VW, McCarty DM, Samulski RJ. AAV hybrid serotypes: improved vectors for gene delivery. Curr Gene Ther. 2005;5:299–310. doi: 10.2174/1566523054064968. [DOI] [PMC free article] [PubMed] [Google Scholar]
- Chow BY, Han X, Dobry AS, Qian X, Chuong AS, Li M, Henninger MA, Belfort GM, Lin Y, Monahan PE, Boyden ES. High-performance genetically targetable optical neural silencing by light-driven proton pumps. Nature. 2010;463:98–102. doi: 10.1038/nature08652. [DOI] [PMC free article] [PubMed] [Google Scholar]
- Christie MJ. Opioid and cannabinoid receptors: friends with benefits or just close friends. Br J Pharmacol. 2006;148:385–386. doi: 10.1038/sj.bjp.0706756. [DOI] [PMC free article] [PubMed] [Google Scholar]
- Cobb SR, Davies CH. Cholinergic modulation of hippocampal cells and circuits. J Physiol. 2005;562:81–88. doi: 10.1113/jphysiol.2004.076539. [DOI] [PMC free article] [PubMed] [Google Scholar]
- Diana MA, Marty A. Characterization of depolarization-induced suppression of inhibition using paired interneuron–Purkinje cell recordings. J Neurosci. 2003;23:5906–5918. doi: 10.1523/JNEUROSCI.23-13-05906.2003. [DOI] [PMC free article] [PubMed] [Google Scholar]
- Drake CT, Milner TA. Mu opioid receptors are in discrete hippocampal interneuron subpopulations. Hippocampus. 2002;12:119–136. doi: 10.1002/hipo.1107. [DOI] [PubMed] [Google Scholar]
- Dugladze T, Schmitz D, Whittington MA, Vida I, Gloveli T. Segregation of axonal and somatic activity during fast network oscillations. Science. 2013;336:1458–1461. doi: 10.1126/science.1222017. [DOI] [PubMed] [Google Scholar]
- Ellender TJ, Paulsen O. The many tunes of perisomatic targeting interneurons in the hippocampal network. Front Cell Neurosci. 2010;4:1–11. doi: 10.3389/fncel.2010.00026. [DOI] [PMC free article] [PubMed] [Google Scholar]
- Fisahn A, Pike FG, Buhl EH, Paulsen O. Cholinergic induction of network oscillations at 40 Hz in the hippocampus in vitro. Nature. 1998;394:186–189. doi: 10.1038/28179. [DOI] [PubMed] [Google Scholar]
- Foldy C, Neu A, Jones MV, Soltesz I. Presynaptic, activity-dependent modulation of cannabinoid type 1 receptor-mediated inhibition of GABA release. J Neurosci. 2006;26:1465–1469. doi: 10.1523/JNEUROSCI.4587-05.2006. [DOI] [PMC free article] [PubMed] [Google Scholar]
- Fortin DA, Trettel J, Levine ES. Brief trains of action potentials enhance pyramidal neuron excitability via endocannabinoid-mediated suppression of inhibition. J Neurophysiol. 2004;92:2105–2112. doi: 10.1152/jn.00351.2004. [DOI] [PubMed] [Google Scholar]
- Franklin K, Paxinos G. The Mouse Brain in Stereotaxic Coordinates. Academic Press; 1997. [Google Scholar]
- Freund TF, Buzsaki G. Interneurons of the hippocampus. Hippocampus. 1996;6:347–470. doi: 10.1002/(SICI)1098-1063(1996)6:4<347::AID-HIPO1>3.0.CO;2-I. [DOI] [PubMed] [Google Scholar]
- Freund TF, Katona I. Perisomatic inhibition. Neuron. 2007;56:33–42. doi: 10.1016/j.neuron.2007.09.012. [DOI] [PubMed] [Google Scholar]
- Freund TF, Katona I, Piomelli D. Role of endogenous cannabinoids in synaptic signalling. Physiol Rev. 2003;83:1017–1066. doi: 10.1152/physrev.00004.2003. [DOI] [PubMed] [Google Scholar]
- Fuentealba P, Begum R, Capogna M, Jinno S, Marton LF, Csicsvari J, Thompson A, Somogyi P, Klausberger T. Ivy cells: a population of nitric-oxide-producing, slow-spiking GABAergic neurons and their involvement in hippocampal network activity. Neuron. 2008;57:917–929. doi: 10.1016/j.neuron.2008.01.034. [DOI] [PMC free article] [PubMed] [Google Scholar]
- Galarreta M, Erdélyi F, Szabó G, Hestrin S. Electrical coupling among irregular-spiking GABAergic interneurons expressing cannabinoid receptors. J Neurosci. 2004;24:9770–9778. doi: 10.1523/JNEUROSCI.3027-04.2004. [DOI] [PMC free article] [PubMed] [Google Scholar]
- Gillies MJ, Traub RD, LeBeau FE, Davies CH, Gloveli T, Buhl EH, Whittington MA. A model of atropine-resistant theta oscillations in rat hippocampal area CA1. J Physiol. 2002;543:779–793. doi: 10.1113/jphysiol.2002.024588. [DOI] [PMC free article] [PubMed] [Google Scholar]
- Glickfeld LL, Atallah BV, Scanziani M. Complementary modulation of somatic inhibition by opioids and cannabinoids. J Neurosci. 2008;28:1824–1832. doi: 10.1523/JNEUROSCI.4700-07.2008. [DOI] [PMC free article] [PubMed] [Google Scholar]
- Gu Z, Yakel JL. Timing-dependent septal cholinergic induction of dynamic hippocampal synaptic plasticity. Neuron. 2011;71:155–165. doi: 10.1016/j.neuron.2011.04.026. [DOI] [PMC free article] [PubMed] [Google Scholar]
- Gulyas AI, Szabo GG, Ulbert I, Holderith N, Monyer H, Erdelyi F, Szabo G, Freund TF, Hajos N. Parvalbumin-containing fast-spiking basket cells generate the field potential oscillations induced by cholinergic receptor activation in the hippocampus. J Neurosci. 2010;30:15134–15145. doi: 10.1523/JNEUROSCI.4104-10.2010. [DOI] [PMC free article] [PubMed] [Google Scholar]
- Hajos N, Papp EC, Acsady L, Levey AI, Freund TF. Distinct interneuron types express m2 muscarinic receptor immunoreactivity on their dendrites or axon terminals in the hippocampus. Neuroscience. 1998;82:355–376. doi: 10.1016/s0306-4522(97)00300-x. [DOI] [PubMed] [Google Scholar]
- Hampson RE, Zhuang SY, Weiner JL, Deadwyler SA. Functional significance of cannabinoid-mediated, depolarization-induced suppression of inhibition (DSI) in the hippocampus. J Neurophysiol. 2003;90:55–64. doi: 10.1152/jn.01161.2002. [DOI] [PubMed] [Google Scholar]
- Hefft S, Jonas P. Asynchronous GABA release generates long-lasting inhibition at a hippocampal interneuron–principal neuron synapse. Nat Neurosci. 2005;8:1319–1328. doi: 10.1038/nn1542. [DOI] [PubMed] [Google Scholar]
- Holderith N, Nemeth B, Papp OI, Veres JM, Nagy GA, Hajos N. Cannabinoids attenuate hippocampal gamma oscillations by suppressing excitatory synaptic input onto CA3 pyramidal neurons and fast spiking basket cells. J Physiol. 2011;589:4921–4934. doi: 10.1113/jphysiol.2011.216259. [DOI] [PMC free article] [PubMed] [Google Scholar]
- Hojo M, Sudo Y, Ando Y, Minami K, Takada M, Matsubara T, Kanaide M, Taniyama K, Sumikawa K, Uezono Y. mu-Opioid receptor forms a functional heterodimer with cannabinoid CB1 receptor: electrophysiological and FRET assay analysis. J Pharmacol Sci. 2008;108:308–319. doi: 10.1254/jphs.08244fp. [DOI] [PubMed] [Google Scholar]
- Jones S, Yakel JL. Functional nicotinic ACh receptors on interneurones in the rat hippocampus. J Physiol. 1997;504:603–610. doi: 10.1111/j.1469-7793.1997.603bd.x. [DOI] [PMC free article] [PubMed] [Google Scholar]
- Kano M, Ohno-Shosaku T, Hashimotodani Y, Uchigashima M, Watanabe M. Endocannabinoid-mediated control of synaptic transmission. Physiol Rev. 2009;89:309–380. doi: 10.1152/physrev.00019.2008. [DOI] [PubMed] [Google Scholar]
- Karson MA, Tang AH, Milner TA, Alger BE. Synaptic cross talk between perisomatic-targeting interneuron classes expressing cholecystokinin and parvalbumin in hippocampus. J Neurosci. 2009;29:4140–4154. doi: 10.1523/JNEUROSCI.5264-08.2009. [DOI] [PMC free article] [PubMed] [Google Scholar]
- Katona I, Sperlagh B, Sik A, Kafalvi A, Vizi ES, Mackie K, Freund TF. Presynaptically located CB1 cannabinoid receptors regulate GABA release from axon terminals of specific hippocampal interneurons. J Neurosci. 1999;19:4544–4558. doi: 10.1523/JNEUROSCI.19-11-04544.1999. [DOI] [PMC free article] [PubMed] [Google Scholar]
- Kim J, Isokawa M, Ledent C, Alger BE. Activation of muscarinic acetylcholine receptors enhances the release of endogenous cannabinoids in the hippocampus. J Neurosci. 2002;22:10182–10191. doi: 10.1523/JNEUROSCI.22-23-10182.2002. [DOI] [PMC free article] [PubMed] [Google Scholar]
- Klapstein GJ, Colmers WF. 4-Aminopyridine and low Ca2+ differentiate presynaptic inhibition mediated by neuropeptide Y, baclofen and 2-chloroadenosine in rat hippocampal CA1 in vitro. Br J Pharmacol. 1992;105:470–474. doi: 10.1111/j.1476-5381.1992.tb14277.x. [DOI] [PMC free article] [PubMed] [Google Scholar]
- Klausberger T, Somogyi P. Neuronal diversity and temporal dynamics: the unity of hippocampal circuit operations. Science. 2008;321:53–57. doi: 10.1126/science.1149381. [DOI] [PMC free article] [PubMed] [Google Scholar]
- Krook-Magnuson E, Luu L, Lee SH, Varga C, Soltesz I. Ivy and neurogliaform interneurons are a major target of muopioid receptor modulation. J Neurosci. 2011;31:14861–14870. doi: 10.1523/JNEUROSCI.2269-11.2011. [DOI] [PMC free article] [PubMed] [Google Scholar]
- Lafourcade CA, Alger BE. Distinctions among GABAA and GABAB responses revealed by calcium channel antagonists, cannabinoids, opioids, and synaptic plasticity in rat hippocampus. Psychopharmacology. 2008;198:539–549. doi: 10.1007/s00213-007-1040-4. [DOI] [PMC free article] [PubMed] [Google Scholar]
- Lawrence J. Cholinergic control of GABA release: emerging parallels between neocortex and hippocampus. Trends Neurosci. 2008;31:317–327. doi: 10.1016/j.tins.2008.03.008. [DOI] [PubMed] [Google Scholar]
- Lenz RA, Wagner JJ, Alger BE. N- and L-type calcium channel involvement in depolarization-induced suppression of inhibition in rat hippocampal CA1 cells. J Physiol. 1998;512:61–73. doi: 10.1111/j.1469-7793.1998.061bf.x. [DOI] [PMC free article] [PubMed] [Google Scholar]
- López-Bendito G, Sturgess K, Erdélyi F, Szabó G, Molnár Z, Paulsen O. Preferential origin and layer destination of GAD65-GFP cortical interneurons. Cereb Cortex. 2004;14:1122–1133. doi: 10.1093/cercor/bhh072. [DOI] [PubMed] [Google Scholar]
- Losonczy A, Biró AA, Nusser Z. Persistently active cannabinoid receptors mute a subpopulation of hippocampal interneurons. Proc Natl Acad Sci USA. 2004;101:1362–1367. doi: 10.1073/pnas.0304752101. [DOI] [PMC free article] [PubMed] [Google Scholar]
- Mann EO, Tominaga T, Ichikawa M, Greenfield SA. Cholinergic modulation of the spatiotemporal pattern of hippocampal activity in vitro. Neuropharmacology. 2005;48:118–133. doi: 10.1016/j.neuropharm.2004.08.022. [DOI] [PubMed] [Google Scholar]
- Marsicano G, Lutz B. Expression of the cannabinoid receptor CB1 in distinct neuronal subpopulations in the adult mouse forebrain. Eur J Neurosci. 1999;11:4213–4225. doi: 10.1046/j.1460-9568.1999.00847.x. [DOI] [PubMed] [Google Scholar]
- Martin LA, Alger BE. Muscarinic facilitation of the occurrence of depolarization-induced suppression of inhibition in rat hippocampus. Neuroscience. 1999;92:61–71. doi: 10.1016/s0306-4522(98)00745-3. [DOI] [PubMed] [Google Scholar]
- Martin LA, Wei DS, Alger BE. Heterogeneous susceptibility of GABA(A) receptor-mediated IPSCs to depolarization-induced suppression of inhibition in rat hippocampus. J Physiol. 2001;532:685–700. doi: 10.1111/j.1469-7793.2001.0685e.x. [DOI] [PMC free article] [PubMed] [Google Scholar]
- McQuiston AR, Madison DV. Muscarinic receptor activity has multiple effects on the resting membrane potentials of CA1 hippocampal interneurons. J Neurosci. 1999a;19:5693–5702. doi: 10.1523/JNEUROSCI.19-14-05693.1999. [DOI] [PMC free article] [PubMed] [Google Scholar]
- McQuiston AR, Madison DV. Nicotinic receptor activation excites distinct subtypes of interneurons in the rat hippocampus. J Neurosci. 1999b;19:2887–2896. doi: 10.1523/JNEUROSCI.19-08-02887.1999. [DOI] [PMC free article] [PubMed] [Google Scholar]
- Morishita W, Kirov SA, Alger BE. Evidence for metabotropic glutamate receptor activation in the induction of depolarization-induced suppression of inhibition in hippocampal CA1. J Neurosci. 1998;18:4870–4882. doi: 10.1523/JNEUROSCI.18-13-04870.1998. [DOI] [PMC free article] [PubMed] [Google Scholar]
- Nagode DA, Tang A-H, Karson MA, Klugmann M, Alger BE. Optogenetic release of ACh induces rhythmic bursts of perisomatic IPSCs in hippocampus. PloS One. 2011;6:e27691. doi: 10.1371/journal.pone.0027691. [DOI] [PMC free article] [PubMed] [Google Scholar]
- Neu A, Foldy C, Soltesz I. Postsynaptic origin of CB1-dependent tonic inhibition of GABA release at cholecystokinin-positive basket cell to pyramidal cell synapses in the CA1 region of the rat hippocampus. J Physiol. 2007;578:233–247. doi: 10.1113/jphysiol.2006.115691. [DOI] [PMC free article] [PubMed] [Google Scholar]
- Ohno-Shosaku T, Maejima T, Kano M. Endogenous cannabinoids mediate retrograde signals from depolarized postsynaptic neurons to presynaptic terminals. Neuron. 2001;29:729–738. doi: 10.1016/s0896-6273(01)00247-1. [DOI] [PubMed] [Google Scholar]
- Ohno-Shosaku T, Matsui M, Fukudome Y, Shosaku J, Tsubokawa H, Taketo MM, Manabe T, Kano M. Postsynaptic M1 and M3 receptors are responsible for the muscarinic enhancement of retrograde endocannabinoid signalling in the hippocampus. Eur J Neurosci. 2003;8:109–116. doi: 10.1046/j.1460-9568.2003.02732.x. [DOI] [PubMed] [Google Scholar]
- Oren I, Hajos N, Paulsen O. Identification of the current generator underlying cholinergically induced gamma frequency field potential oscillations in the hippocampal CA3 region. J Physiol. 2010;588:785–797. doi: 10.1113/jphysiol.2009.180851. [DOI] [PMC free article] [PubMed] [Google Scholar]
- Oren I, Mann EO, Paulsen O, Hajos N. Synaptic currents in anatomically identified CA3 neurons during hippocampal gamma oscillations in vitro. J Neurosci. 2006;26:9923–9934. doi: 10.1523/JNEUROSCI.1580-06.2006. [DOI] [PMC free article] [PubMed] [Google Scholar]
- Petreanu L, Huber D, Sobczyk A, Svoboda K. Channelrhodopsin-2-assisted circuit mapping of long-range callosal projections. Nat Neurosci. 2007;10:663–668. doi: 10.1038/nn1891. [DOI] [PubMed] [Google Scholar]
- Pitler TA, Alger BE. Cholinergic excitation of GABAergic interneurons in the rat hippocampal slice. J Physiol. 1992a;450:127–142. doi: 10.1113/jphysiol.1992.sp019119. [DOI] [PMC free article] [PubMed] [Google Scholar]
- Pitler TA, Alger BE. Postsynaptic spike firing reduces synaptic GABAA responses in hippocampal pyramidal cells. J Neurosci. 1992b;12:4122–4132. doi: 10.1523/JNEUROSCI.12-10-04122.1992. [DOI] [PMC free article] [PubMed] [Google Scholar]
- Pitler TA, Alger BE. Depolarization-induced suppression of GABAergic inhibition in rat hippocampal pyramidal cells: G protein involvement in a presynaptic mechanism. Neuron. 1994;13:1447–1455. doi: 10.1016/0896-6273(94)90430-8. [DOI] [PubMed] [Google Scholar]
- Reich CG, Karson MA, Karnup SV, Jones LM, Alger BE. Regulation of IPSP theta rhythm by muscarinic receptors and endocannabinoids in hippocampus. J Neurophysiol. 2005;94:4290–4299. doi: 10.1152/jn.00480.2005. [DOI] [PubMed] [Google Scholar]
- Robbe D, Montgomery SM, Thome A, Rueda-Orozco PE, McNaughton BL, Buzsaki G. Cannabinoids reveal importance of spike timing coordination in hippocampal function. Nat Neurosci. 2006;9:1526–1533. doi: 10.1038/nn1801. [DOI] [PubMed] [Google Scholar]
- Rodriguez JJ, Mackie K, Pickel VM. Ultrastructural localization of the CB1 cannabinoid receptor in mu-opioid receptor patches of the rat caudate putamen nucleus. J Neurosci. 2001;21:823–833. doi: 10.1523/JNEUROSCI.21-03-00823.2001. [DOI] [PMC free article] [PubMed] [Google Scholar]
- Royer S, Zemelman BV, Losonczy A, Kim J, Chance F, Magee JC, Buzsaki G. Control of timing, rate and bursts of hippocampal place cells by dendritic and somatic inhibition. Nat Neurosci. 2012;15:769–775. doi: 10.1038/nn.3077. [DOI] [PMC free article] [PubMed] [Google Scholar]
- Tang AH, Karson MA, Nagode DA, McIntosh JM, Uebele VN, Renger JJ, Klugmann M, Milner TA, Alger BE. Nerve terminal nicotinic acetylcholine receptors initiate quantal GABA release from perisomatic interneurons by activating axonal T-type (Cav3) Ca2+ channels and Ca2+ release from stores. J Neurosci. 2011;31:13546–13561. doi: 10.1523/JNEUROSCI.2781-11.2011. [DOI] [PMC free article] [PubMed] [Google Scholar]
- Trettel J, Fortin DA, Levine ES. Endocannabinoid signalling selectively targets perisomatic inhibitory inputs to pyramidal neurones in juvenile mouse neocortex. J Physiol. 2004;556:95–107. doi: 10.1113/jphysiol.2003.058198. [DOI] [PMC free article] [PubMed] [Google Scholar]
- Tricoire L, Pelkey KA, Erkkila BE, Jeffries BW, Yuan X, McBain CJ. A blueprint for the spatiotemporal origins of mouse hippocampal interneuron diversity. J Neurosci. 2011;31:10948–10970. doi: 10.1523/JNEUROSCI.0323-11.2011. [DOI] [PMC free article] [PubMed] [Google Scholar]
- Widmer H, Ferrigan L, Davies CH, Cobb SR. Evoked slow muscarinic acetylcholinergic synaptic potentials in rat hippocampal interneurons. Hippocampus. 2006;16:617–628. doi: 10.1002/hipo.20191. [DOI] [PubMed] [Google Scholar]
- Wilson RI, Kunos G, Nicoll RA. Presynaptic specificity of endocannabinoid signalling in the hippocampus. Neuron. 2001;31:453–462. doi: 10.1016/s0896-6273(01)00372-5. [DOI] [PubMed] [Google Scholar]
- Wilson RI, Nicoll RA. Endogenous cannabinoids mediate retrograde signalling at hippocampal synapses. Nature. 2001;410:588–592. doi: 10.1038/35069076. [DOI] [PubMed] [Google Scholar]
- Wulff P, Ponomarenko AA, Bartos M, Korotkova TM, Fuchs EC, Bähner F, Both M, Tort AB, Kopell NJ, Wisden W, Monyer H. Hippocampal theta rhythm and its coupling with gamma oscillations require fast inhibition onto parvalbumin-positive interneurons. Proc Natl Acad Sci USA. 2009;106:3561–3566. doi: 10.1073/pnas.0813176106. [DOI] [PMC free article] [PubMed] [Google Scholar]
- Yoshino H, Miyamae T, Hansen G, Zambrowicz B, Flynn M, Pedicord D, Blat Y, Westphal RS, Zaczek R, Lewis DA, Gonzalez-Burgos G. Postsynaptic diacylglycerol lipase mediates retrograde endocannabinoid suppression of inhibition in mouse prefrontal cortex. J Physiol. 2011;589:4857–4884. doi: 10.1113/jphysiol.2011.212225. [DOI] [PMC free article] [PubMed] [Google Scholar]
- Zhang F, Wang LP, Brauner M, Liewald JF, Kay K, Watzke N, Wood PG, Bamberg E, Nagel G, Gottschalk A, Deisseroth K. Multimodal fast optical interrogation of neural circuitry. Nature. 2007;446:633–639. doi: 10.1038/nature05744. [DOI] [PubMed] [Google Scholar]
Associated Data
This section collects any data citations, data availability statements, or supplementary materials included in this article.