Abstract
The current Dana Point classification system (2009) divides elevation of pulmonary artery pressure into Pulmonary Arterial Hypertension (PAH) and Pulmonary Hypertension (PH). Fortunately, pulmonary arterial hypertension (PAH) is not a common disease. However, with the aging of the first world’s population, heart failure is now an important cause of pulmonary hypertension with up to 9% of the population involved. PAH is usually asymptomatic until late in the disease process. While there are indirect features of PAH found on noninvasive imaging studies, the diagnosis and management still requires right heart catheterization. Imaging features of PAH include: 1. Enlargement of the pulmonary trunk and main pulmonary arteries, 2. Decreased pulmonary arterial compliance, 3. Tapering of the peripheral pulmonary arteries, 4. Enlargement of the inferior vena cava, and 5. Increased mean transit time. The chronic requirement to generate high pulmonary arterial pressures measurably affects the right heart and main pulmonary artery. This change in physiology causes the following structural and functional alterations that have been shown to have prognostic significance: Relative area change of the pulmonary trunk, RVSVindex, RVSV, RVEDVindex, LVEDVindex, and baseline RVEF <35%. All of these variables can be quantified non-invasively and followed longitudinally in each patient using MRI to modify the treatment regimen. Untreated PAH frequently results in a rapid clinical decline and death within 3 years of diagnosis. Unfortunately, even with treatment, less than 1/2 of these patients are alive at four years.
Keywords: Hypertension, Pulmonary, Magnetic Resonance Angiography, Multidetector Computed Tomography, Thromboembolism, Heart Catheterization
Introduction
Pulmonary arterial hypertension (PAH) is a relatively rare phenomenon occurring with a prevalence estimated to be between 1/2,000 – 1/50,000 adults. (1) It is rare for a radiologist to first make the diagnosis of this disease. One of the few times that a radiologist is expected to comment on the possibility for PAH, or other causes of pulmonary hypertension (PH), is when a routine chest x-ray is performed prior to ventilation/perfusion (V/Q) scanning for pulmonary embolism in patients with severe emphysema or Chronic Thromboembolic Pulmonary Hypertension (CTEPH). The purpose of the CXR in this instance is to determine if the dose of 99mTc-MAA should be reduced because of severe underlying lung disease.
While physicians have the opportunity to screen for systemic arterial hypertension (SAH or “high blood pressure”) with a blood pressure cuff, there is no routine screening test for elevated pulmonary artery pressure (PAP). Just as the renal arterioles show pruning and amputation of the capillary bed in longstanding systemic arterial hypertension resulting in renal failure; similarly with chronic elevation of PAP, the pulmonary arterioles must endure hypertensive induced smooth muscle hypertrophic narrowing resulting in limiting flow by narrowing the vessel and increasing the perfusion pressures. At the time of the first presentation of PAH, irreversible damage has often occurred to the vascular bed of the patient’s lungs resulting in dyspnea. Instituting medical treatment after symptoms have begun has only a modest role in forestalling death related to Cor pulmonale. (2)
The terminology used for the many diseases responsible for causing elevated pulmonary artery pressures is somewhat confusing. The two general categories of pathology that cause an elevation in pulmonary arterial pressure are roughly divided in to pre-capillary and post- capillary causes. If the disorder is primarily of the precapillary pulmonary arteries, the classification of Pulmonary Arterial Hypertension (PAH) is generally used and conversely if it is post capillary the term pulmonary hypertension (PH) is employed. While the humble fluid mechanics diagram shown in Figure 1 is an oversimplification; it can act as a heuristic device to group these two major causes of elevated PAP into pre and post capillary causes. The Dana Point Classification (2009) (Table 1) is the most current clinical system for the categorization of these disorder. (3) The aim of this new classification system is to shift from a strictly causative one based on pathophysiology, to a treatment based scheme, that sorts the many diseases that cause an elevated PAP into similar treatment options.
Figure 1. Simplified fluid mechanics model for understanding the differences between Pulmonary arterial Hypertension and Pulmonary Hypertension.
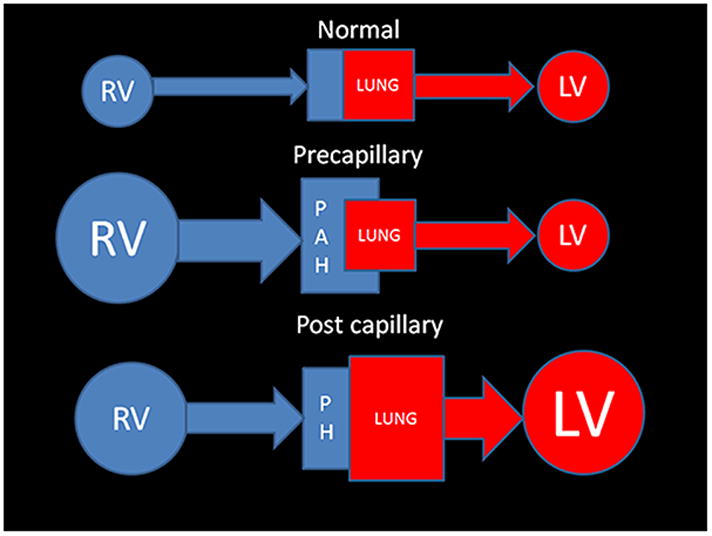
Normal physiology: The Qp (pulmonary blood flow) matches the Qs (systemic blood flow), thus the amount of blood entering the lungs is equal to the amount leaving the aorta.
Pre capillary: Pulmonary Arterial hypertension (PAH): There is a problem in getting either normal flow (or volume) to the last order arteriole. PAH leads to back pressure which reverberates retrograde into the right ventricle. Curiously pulmonary veno- occlusive disease (which is post capillary) is categorized as a precapillary cause of PAH- 1′.
Post capillary: Pulmonary Hypertension (PH): There is a limitation to the oxygenated blood’s flow from the larger pulmonary veins all the way to the aortic valve that requires an increased capillary wedge pressure. This is typically associated with left heart dysfunction and enlargement. There is secondary enlargement of the right heart and pulmonary arteries that occurs late in this form of PH.
(Abbreviation Key: RV- right heart including the ventricle, atrium, and systemic veins LV- left heart including the atrium and ventricle, PAH- Pulmonary arterial hypertension, PH-Pulmonary hypertension).
Table 1. Updated Clinical Classification of Pulmonary Arterial Hypertension and the other causes of Pulmonary Hypertension.
(Dana Point 2009) (3)
| 1. | PAH | |||
| 1.1 Idiopathic | ||||
| 1.2 Heritable | 1.2.1 BMPR2 | |||
| 1.2.2 ALK1, endoglin | ||||
| 1.2.3 Unknown | ||||
| 1.3 Drug and toxin induced | ||||
| 1.4 Associated with | 1.4.1 Connective tissue diseases 1.4.2 HIV Infection 1.4.3 Portopulmonary hypertension 1.4.4 Congenital heart disease (shunts) 1.4.5 Schistosomiasis 1.4.6 Chronic hemolytic anemia |
|||
| 1.5 Persistent Pulmonary Hypertension of the newborn | ||||
| 1.′ | Pulmonary veno-occlusive disease (PVOD) and/or Pulmonary Capillary Hemangiomatosis (PCH). | |||
| 2. | PH from Left heart Disease | |||
| 2.1 Systolic Dysfunction | ||||
| 2.2 Diastolic Dysfunction | ||||
| 2.3 Valvular Ds | ||||
| 3. | PH from lung ds and/or hypoxia | |||
| 3.1 Chronic Obstructive Pulmonary Disease | ||||
| 3.2 Idiopathic Pulmonary Fibrosis | ||||
| 3.3 Other pulmonary disease with mixed restrictive and obstructive pattern | ||||
| 3.4 Sleep disordered breathing | ||||
| 3.5 Alveolar hypoventilation disorder | ||||
| 3.6 Chronic Exposure to High Altitude | ||||
| 3.7 Developmental anomalies | ||||
| 4. | Chronic Thromboembolic Pulmonary Hypertension (CTEPH) | |||
| 5. | PH unclear cause | |||
| 5.1 Hematologic | Splenectomy, Myeloproliferative Disorders | |||
| 5.2 Systemic Ds | Sarcoidosis Pulmonary Langerhans cell histiocytosis, Lymphangiomyomatosis, Neurofibromatosis, Vasculitis | |||
| 5.3 Metabolic disorders | Glycogen Storage disease, Gaucher’s Ds, Thyroid disorders | |||
| 5.4 Others | Tumoral Obstruction, Fibrosing mediastinitis, Chronic Renal Failure on Dialysis | |||
By definition PAH, and other types of PH, are diagnoses that are invasively established after right heart catheterization (RHC). The three current invasive criteria by which this diagnosis can be made are as follows: a. Mean pulmonary artery pressure (mPAP) of >25 mmHg at rest, b. Pulmonary capillary wedge pressure (PCWP) <15 mmHg, or c. Pulmonary vascular resistance (PVR) of > 3 Wood units (300 dyn•s•cm−5). (4) Acutely the right heart is not able to generate systolic Pulmonary Arterial Pressure (sPAP) > 40 mm Hg. (5) Therefore, any sPAP of > 40 mm Hg implies chronic PAH. The severity level of PAH is categorized by the invasive measurement of mean pulmonary artery pressure (mPAP) at rest supine during RHC: Severe PAH > 50 mmHg, Moderate PAH =30–50 mmHg, and Mild PAH= >25 mmHg < 30 mmHg.
The number of newly diagnosed cases of PAH pales in comparison to the frequency of the many diseases that cause PH: ischemic cardiomyopathy with left heart failure, COPD, asthma, pneumonia, lung cancer, pulmonary embolism, and living at very high altitudes (Table 2). The prevalence (proportion of the population with PAH) of this disease is probably underestimated in both developed countries and developing countries, as the definitive diagnosis is usually made late in the disease course when patients already have severe dyspnea. (1,6) PAH is one of the few vascular diseases that more commonly occurs in females (1.7:1). (7) The REVEAL study of PAH found that females in the United States were involved 80% of the time. (8) This disorder can be inherited and has been linked to genetic mutations. While it is difficult to know for sure, it has been estimated that there are more than 100,000 persons in the United States with PAH, and there is one estimate as high as 1:2,000 individuals. (9) Other countries have similar estimates of PAH prevalence with 2.6 cases/100,000 individuals in the Scottish Isles and 1.5 cases/100,000 individuals in France. (10) In the French registry data, the relative frequency of diseases causing PAH was shown to be: 39.2% idiopathic (Dana point 1.1), 15.3% connective tissue diseases (Dana point 1.4.1), 11.3% congenital heart disease (Dana point 1.4.4), 10.4% portal hypertension (Dana point 1.4.3), 9.5% anorexigen (Dana point 1.3), and 6.2% HIV associated (Dana Point 1.4.2). (1,6)
Table 2.
Comparative Analysis of Diagnostic Imaging tests for the evaluation of Common imaging findings associated with early Cor Pulmonale using a nominal scale for efficacy (0-not useful, 1-occasionally useful, 2-minimally useful, 3-moderately useful, and 4-very useful).
| Structure | Finding | NC CT | CTA* | MRI |
|---|---|---|---|---|
| Subcutaneous fat | Morbid Obesity | 1 | 1 | 2 |
| SVC | Enlarged | 4 | 4 | 4 |
| Azygous Vein | Reflux of contrast | 0 | 4 | 4 |
| Large | 1 | 1 | 1 | |
| IVC | Large | 1 | 2 | 3 |
| Contrast Reflux | 0 | 4 | 3 | |
| RA | Large | 2 | 2 | 4 |
| RA Pressure | >4 mmHg | 1 | 1 | 2 |
| Interatrial Septum | Bowing From right to left | 1 | 2 | 4 |
| Open PFO | 0 | 1 | 2 | |
| ASD | 1 | 1 | 3 | |
| TV | TR Jet velocity | 0 | 0 | 4 |
| TR Volume | 0 | 0 | 4 | |
| TAPSE | 0 | 0 | 3 | |
| e to a ratio | 0 | 0 | 3 | |
| RV | RVH | 2 | 2 | 4 |
| Enlarged RV | 2 | 2 | 4 | |
| Abnl RV motion | 0 | 1 | 4 | |
| Mass in grams | 0 | 0 | 4 | |
| Abnl RV minor axis | 2 | 3 | 4 | |
| RVEDV Index | 0 | 0 | 4 | |
| RVEF | 0 | 0 | 4 | |
| RVSV Index | 0 | 0 | 4 | |
| McConnell sign | 0 | 0 | 3 | |
| IV Septum | “D” Shape | 1 | 1 | 4 |
| DCE | 0 | 1 | 4 | |
| VSD | 1 | 1 | 4 | |
| Eisenmenger Syndrome | 2 | 2 | 4 | |
| PV | PR (+/−) | 0 | 0 | 4 |
| PR volume | 0 | 0 | 4 | |
| PA | Enlarged PT | 4 | 4 | 4 |
| PAP > 25 mm Hg at rest | 0 | 0 | 2 | |
| Acute Embolism | 1 | 4 | 3 | |
| Chronic Embolism | 1 | 4 | 2 | |
| Compliance | 0 | 0 | 3 | |
| Pulmonary Flow (Qp) | 1 | 1 | 4 | |
| Oxygen Saturation | 0 | 0 | 0 | |
| Right to Left shunt fraction | 0 | 0 | 4 | |
| PA branches | Enlarged Inter-lobar arteries | 4 | 4 | 4 |
| Pruning of PA’s | 3 | 3 | 3 | |
| Mean Transit time | 0 | 1 | 3 | |
| Pulmonary Perfusion | 0 | 1 | 3 | |
| PDA | 1 | 3 | 4 | |
| Capillary Obstruction | Microvasculature Emboli (CTEPH) | 1 | 1 | 1 |
| PCH | 4 | 4 | 0 | |
| Microvasculature capillary shunts | Hepato-Pulmonary syndrome | 0 | 0 | 0 |
| Pulmonary Veins | PVOD | 4 | 4 | 0 |
| Wedge Pressure | 0 | 0 | 0 | |
| Oxygen Partial Pressure | 0 | 0 | 0 | |
| PAPVR | 2 | 3 | 4 | |
| Left heart | Left Atrial fibrillation | 0 | 0 | 1 |
| Large | 2 | 2 | 4 | |
| Mitral Valve disease | 2 | 2 | 4 | |
| Left Ventricular failure | 2 | 2 | 4 | |
| LVEDV Index | 0 | 0 | 4 | |
| LVESV Index | 0 | 0 | 4 | |
| LVSV | 0 | 0 | 4 | |
| Aorta | AV Stenosis | 2 | 2 | 4 |
| Aortic Flow (Qs) | 0 | 0 | 4 | |
| Shunt Fraction (Qp/Qs) | 0 | 0 | 4 | |
| Lung Parenchyma | Ventilation | 1 | 1 | 4 |
| Air Trapping | 4@ | 2 | 4# | |
| Mosaic Pattern | 4 | 3 | 0 | |
| Fibrosis | 4 | 4 | 1 |
Abbreviations key: NC CT-Non contrast computed tomography of the chest, CTA*-Computed tomographic angiography not cardiac gated, MRI-Magnetic Resonance Imaging, SVC-Superior vena cava, IVC-Inferior vena Cava, RA-Right Atrium, PFO-Patent Foramen Ovale, TV-tricuspid valve, TAPSE-Tricuspid valve annular plane excursion, e to a ratio-atrial filling pattern on right heart catheterization pressure volume loop, RV-Right ventricle, RVH-Right ventricular hypertrophy, RVEDV-Right ventricular end diastolic index, RVEF-Right ventricular ejection fraction, RVSV index-Right ventricle stroke volume index, IV Septum-Interventricular Septum, PV-Pulmonic Valve, PA-Pulmonary Artery, PT-Pulmonary trunk, Abnl-Abnormal, PV-Pulmonary Valve, PAP-Pulmonary artery pressure, mm Hg-Millimeters of Mercury pressure, CTEPH-Chronic thromboembolic pulmonary hypertension, PVOD-Pulmonary veno-occlusive disease, PCH-Pulmonary capillary hemangiomatosis, LVEDVindex-Left ventricular end diastolic volume index, LVESVindex-Left ventricle systolic volume index, LVSV-LV stroke volume, #-MRI ventilation using Hyperpolarized gas, 4@-Xenon CT ventilation, (Morbid obesity may be associated with the metabolic syndrome, diabetic cardiomyopathy and sleep disordered breathing)
Initial Clinical Presentation
PAH is an insidious disease that relentlessly diminishes the patient’s cardiopulmonary reserve at an occult rate. The progression of disease remains below the threshold of symptoms for many years. The clinical presentation is variable with the following findings found in decreasing order of frequency: dyspnea, positive antinuclear antibody, syncope, fatigue, and Raynaud’s phenomenon. Individuals present about two years after the onset of symptoms, with a mean age of onset of 36 years (+/− 15 years). In the USA, recent data shows that the average age at diagnosis is now much older at 50.1 years. (8)
The incidence of other diseases that cause PH is much larger than those that cause PAH. This is because diseases that affect the left heart are included as causes of PH. When transthoracic echocardiography (TTE) is performed at the time of the initial diagnostic workup, it typically yields advanced disease as evidenced by the following echocardiographic findings: 1. right ventricular hypertrophy, 2. tricuspid regurgitation, and 3. elevated right atrial pressure. In an echocardiographic study of PH performed in Australia by Strange and colleagues in of a cohort of 10,314 patients using the jet of tricuspid regurgitation to estimate pulmonary arterial systolic pressure-(ePASP) of > 40 mm Hg, the combined incidence of elevated pulmonary arterial pressure was found to be 9.1% (95% C.I, 8.6%-9.7%) of their study population. Thus, this is really not such a rare disease after all They found the overall “indicative” prevalence for all forms of elevated PAP (as measured by ePASP) to be 326/100,000 inhabitants, with left heart disease-associated PH the most common form with an “indicative” prevalence of 250 cases/100,000. (2) In their series there were 15 cases of PAH/100,000 inhabitants. (2) This echocardiographic determination of PAP by (ePASP) yields 10x the frequency of the French registry numbers (1.5/100,000) which were established by RHC. (1,6) Fully 15% of the cases of PH identified using ePASP by Strange et al in Australia (144 individuals) had no identifiable cause for their PH. (2) Thus, if we are strict, and only use RHC data for the determination of PAH, the incidence is around 15 cases/million. On the other hand if the definition for the determination of elevated PAP is broadened to include the ePASP by echocardiography, the incidence of all causes of elevated PAP (both PAH+PH) rises to a minimum of 3,260/million. (2)
In the United States the number of deaths and hospitalizations attributable to PAH have increased. (11) While there are some causes of elevated PAP that are amenable to surgical therapy (Chronic Thromboembolic Pulmonary Hypertension (CTEPH) and left to right shunts-PH), whatever the cause, chronically elevated PAP frequently leads to early death. In the non-selected cohort of patients in Australia followed by Strange et al with ePASP of >40mmHg they found a mean time to death of 4.1 years (95% CI 3.9 to 4.3 years). (2) The death rate from PAH was found to be proportional to the severity of the disease as estimated from the ePASP, with severe pulmonary arterial hypertension shortening lifespan by an average of 1.1 years as compared with mild PAH. (2) For their patients, PAH increased all-cause mortality, but patients with PH secondary to left heart disease had the worst prognosis. (2) Curiously, those patients with idiopathic PAH, receiving disease-specific treatment had a slightly better prognosis than patients with post capillary disease. (2)
Currently there are three clinically derived variables that are associated with survival in PAH: (1) 6-minute walking test, (2) New York Heart Association class, and (3) the mixed venous oxygen saturation level. Without treatment, the mean survival after diagnosis of PAH is a very short 2.8 years. (12) The biomarkers that have been found to have prognostic value in patient with PAH include: brain natriuretic peptide, N-terminal pro-brain natriuretic peptide, cardiac troponin T, Serum Creatinine, uric acid, and the diffusing capacity of carbon monoxide. The hemodynamic features known to have prognostic importance for PAH survival include: mean Pulmonary artery pressure, Right Atrial Pressure, Cardiac Index, Pulmonary Vascular Resistance, Pulmonary artery capacitance, mixed venous oxygen saturation level, systolic blood pressure, and heart rate. The mean treated survival time for PAH is now estimated to be 3.6 years. (7)
Acute PH
The most common cause of acute PH is related to pulmonary embolism (PE). (13) If enough of the patient’s cardiopulmonary reserve has been compromised, these events can prove to be fatal; particularly if there is associated systemic hypotension (Qs) caused by massive pulmonary artery obstruction from PE resulting in a lack of life sustaining pulmonary perfusion (Qp). This disorder has a very high mortality rate (18%) for hospital in-patients. (14) The findings of acute PH related to PE are similar for both MRA and CTA. These changes in the cardiopulmonary physiology and their associated imaging correlates as demonstrated on non-contrast CT, CTA and MRI are fully detailed in Table 2.
The use of CTA has revolutionized the non-invasive diagnosis of pulmonary embolism and is now the gold standard test by which all others are judged. (15,16) There are many cases of acute PH caused by massive amount of embolic clot that may show the following findings: interventricular septal bowing (VSB), increased pulmonary artery/Aorta ratio (AD/AoD), increased superior vena cava diameter, enlargement of the pulmonary trunk, enlargement of the right and left pulmonary arteries, pulmonary infarction, pleural effusion, enlargement of the right ventricle, increased short axis of the right ventricle (larger than the short axis of the left ventricle, right ventricular and left ventricular ratio, pulmonary obstruction index (POI) (16), enlargement of the right atrium, and venous contrast reflux into the hepatic venous system or azygous vein (Table 3). In a recent retrospective multivariate regression analysis of 152 patients with acute PE by Heyer and colleagues, they showed that of the many variables assessed on CTA exams in patients with acute pulmonary embolism, the most significant for determining if the patient would require mechanical ventilation was hepatic venous reflux in to the IVC (p value <.008) (Table 4). (17) In that series, using a univariate linear regression model, mortality was significantly associated with the short axis RV/LV ratio, diameter of the SVC, Venous contrast reflux into the azygous vein, and venous contrast reflux into the SVC (respective p values: <.001,<0.015, <0.03, <0.015) (Table 4). (18,19) The presence of right heart enlargement in its major and minor axis without associated hypertrophy can be an important discriminator in distinguishing acutely elevated pulmonary artery pressures from more chronic causes. In chronic PH there will typically be an enlarged right ventricle demonstrating hypertrophy (until the right ventricle fails) with associated enlargement of the main pulmonary artery, such that its diameter will be greater than the aorta at the same level. (20)
Table 3.
Efficacy of Pulmonary artery measurements from non-contrastCT scans for predictingthe presence of pulmonaryarterial hypertension.
| Author Reference | PAH cases | Normal Controls | PT size -Abnl -Cut off -normal |
P value | Sensitivity | Specificity | MPA x abnl/normals | p value |
|---|---|---|---|---|---|---|---|---|
| Kuriyama (31) | 32 | 26 | - 28.6 - |
.001 | ||||
| Frank (32) | 23 | 8 | .02 | 18±3 12±1 |
<.008 | |||
| Murray (33) | 12 | 8 | 36±8mm - 29±3mm |
.02 | 28±7mm 17±2mm |
<.0001 | ||
| Edwards (34) | 12 | 100 | 35±3mm 33 27±3mm |
<.01 | .58 | .95 | ||
| Sanal (35) | 51 (Echo) | 139 | - 28.6mm - |
.75 | .75 | |||
| Beiderlinden (36) | 95 Acute PH | 8 | - 29±4mm - |
<.001 | .54 | .63 | ||
| Zisman (37) | 65 PAH | 257 | 33±3.7 - 31±3.7 |
.19 | 18±3mm 17±3mm |
<.29 | ||
| Ghanem (38) | 19 PAH | 18 | 27±9mm - 25±8mm |
.39 | ||||
| Linguraru (39) | 20 (SCD) | 20 | 34±7mm - 27±3mm |
<.001 | ||||
| Tan (40) | 36 | 9 | 35±6mm mm 29 27±2mm |
.87 | .89 |
Key for abbreviations: Abnl-Abnormal, -MPAindex-Main pulmonary artery Index, PAH-Pulmonary arterial hypertension, Echo-Echocardiography, PH-pulmonary hypertension, SCD-Sickle Cell Disease
Table 4.
Imaging biomarkers predictive of mortality using a univariate analysis in patients with elevated pulmonary artery pressures
| Author | Clinical population | Imaging method | Image based biomarker | p value |
|---|---|---|---|---|
| Heyer (17) | Acute PH Pulmonary Embolism | CTA | RV/LV Ratio | .001 |
| SVC diameter | .015 | |||
| Azygous vein Contrast reflux | .03 | |||
| SVC Contrast reflux | .015 | |||
| Van de Veerdonk(18) | PAH | MRI | RVSV <35% @baseline | .001 |
| ΔRVEF | .014 | |||
| RVEDV ≥ 84mL/m2 | .011 | |||
| Van Wolferen(19) | PAH | MRI | RVSV index | .006 |
| RVEF | .015 | |||
| RVEDV index | .037 | |||
| LVEDV index | .019 | |||
| Mathai(54) | PAH Scleroderma | TTE | TAPSE | <.01 |
| Gan(55) | PAH | MRI | RAC | <.001 |
Abbreviations key: PAH-Pulmonary arterial hypertension, TTE-Transthoracic ultrasound, RVEF-Right ventricular ejection fraction, TAPSE-Tricuspid Annular Plane Excursion, RVSV-Right ventricular systolic volume, RVEDVindex-Right ventricular end diastolic volume index, MRI-Cardiovascular Magnetic Resonance Imaging PVR-Pulmonary Vascular Resistance Woods Units, LVEDV-, Left ventricular end diastolicvolume, RAC-Relative area change of the Pulmonary artery, RV/LV ratio-short axis of right ventricle in mm/short axis of left ventricle in mm measured at largest portion of RV on axial imaging ( not an angled four chamber view), SVC-Superior vena cava
The use of MRA as a solitary imaging acquisition in the setting of acute PE has been thoroughly investigated and found to be of lower efficacy for the diagnosis of PE than CTA (Figure 2). (21,22) The PIOPED III investigators found a sensitivity of 78% (67–86; 95% C.I.) with a specificity of 99% (96–100; 95% C.I) for MRA in the diagnosis of PE (when compared with a contemporaneous CTA). The PIOPED III investigators concluded that MRA for the primary diagnosis of pulmonary embolism should be reserved for those sites with significant technical experience with this modality, and that MRA can be considered as an alternative test for PE in those patients with anaphylactic reactions to iodinated contrast material. (21) The IRM-EP study also showed modest efficacy for the diagnosis of acute pulmonary embolism with MRI, mirroring the results of the PIOPED III study. (21,22)
Figure 2.
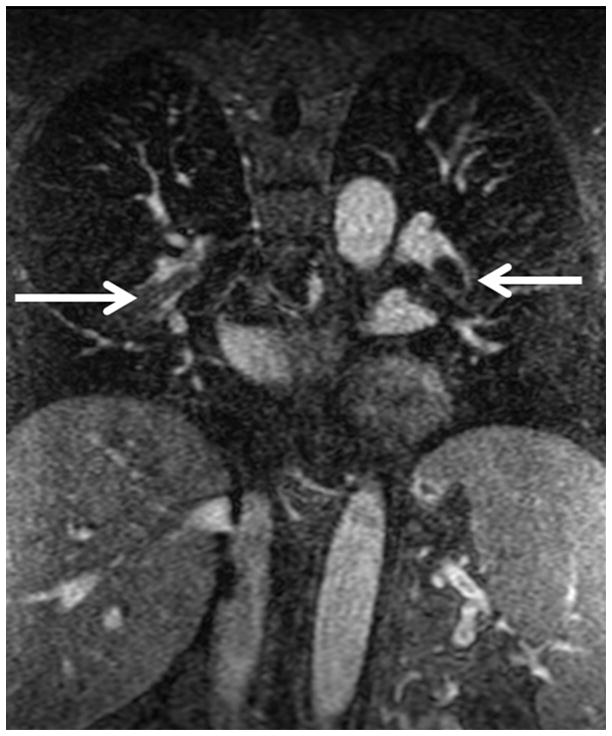
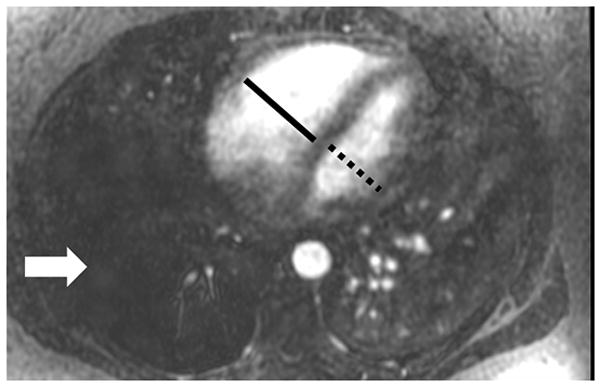
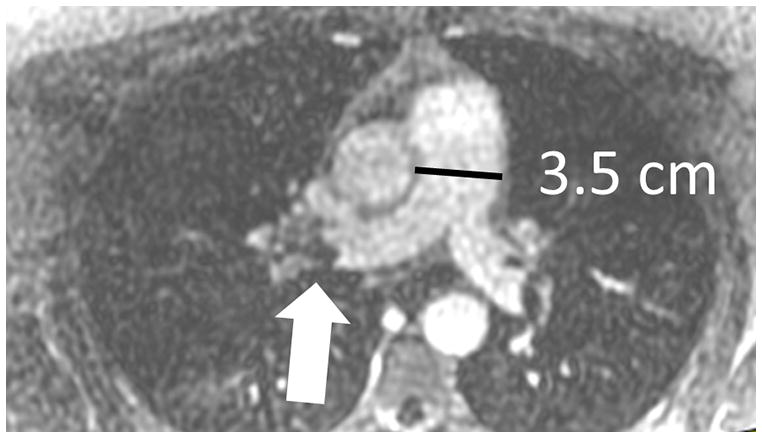
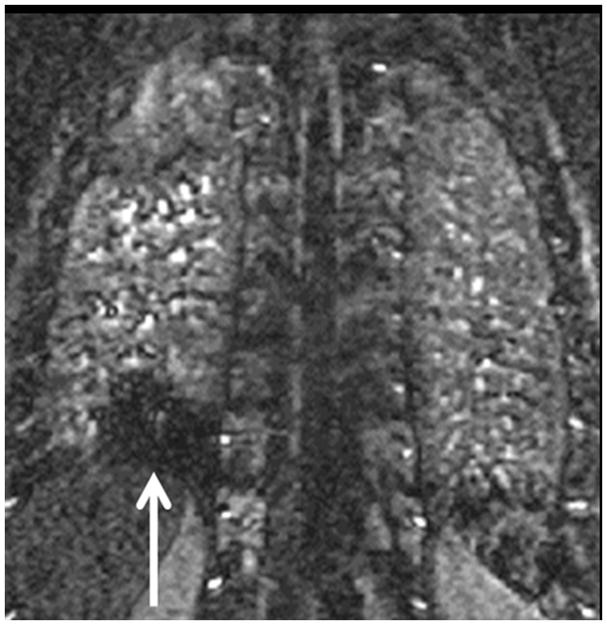
Pulmonary embolism as a cause of Acute pulmonary arterial hypertension: (A) Coronal MRA showing bilateral pulmonary emboli (white arrows); (B) Right heart strain as seen on non-gated single 17 sec breath hold MRA with an increase in the short axis of the Right Ventricle (RV) as compared with the Left Ventricle (LV) and decreased perfusion of the right lower lobe (RLL); (C) Increased size of pulmonary trunk in acute PH caused by PE, Pulmonary artery diameter measurements of > 3.0 cm have some utility in suggesting the possible presence of elevated PAP; however, not all enlarged pulmonary arteries are associated with increased PAP. The pulmonary artery diameter indexed to body surface area has better sensitivity and specificity for the presence of abnormal PAP. (D) Another patient with small RLL perfusion defect from a subsegmental PE.
The clinical adoption of MRA methods for the primary diagnosis of PE has been hampered by its inability to find subsegmental PE. This is due to the fact that the lack of signal intensity of the normal lung provides little to no background signal intensity by which to observe these occluded small vessels. The final result is a low signal intensity occluded vessel which is indistinguishable from the surrounding low signal intensity lung. (22) This problem is somewhat mitigated when perfusion imaging is used. Alternatively routine dextro-phase MRA acquisitions can show dorsal perfusion defects associated with a PE (Figure 2). Kalb and colleagues have recently reported their experience using a combined approach with MRI, MRA and MR perfusion angiography for the diagnosis of PE. (23) In their series of 22 patients using a triad of MR imaging sequences (3D gradient recalled echo, MRA and true FISP) all read in combination with one another; the overall sensitivity and specificity for the diagnosis of individual pulmonary emboli was 84% and 100% respectively. (23)
Our group has been performing MRA for the primary diagnosis of PE since September of 2007 (Figure 2). To date, we have successfully performed over five hundred MRA examinations in dyspneic patients, and it is part of the clinical imaging paradigm for this disorder at our institution. We primarily employ this test for young women, children and patients with contrast allergies. We have recently completed a retrospective review of our data. With 3 months of electronic medical record follow-up, in 167 patients, we found the following respective test effectiveness values (95%, C.I.) for accuracy, sensitivity, specificity, positive predictive value (PPV) and negative predictive value (NPV): 97% (92–99), 82% (64–97), 100% (96–100), 100%(83–100), 97% (92–99). (24) This effectiveness data is very similar to the efficacy data found by PIOPED III. (21) The key number from this MRA effectiveness study is the NPV of 97%, which is near the 99% NPV value found for CTA. (15)
The reader should ask a critical question at this juncture, “Is finding sub-segmental PE clinically significant?” There is recent data from Carrier et al showing that the death rate from PE has not decreased with the use of CTA-PE, and as such, they have concluded that: “the diagnosis of subsegmental PE may not be clinically significant.” (25) Stated in another way, for those individuals without pro-coagulant conditions, the body is able to safely thrombolyse subsegmental PE’s without intervention. Therefore, as corroborated by outcome data, even though MRA-PE is less sensitive for the detection of subsegmental PE, it is still an acceptable alternative test to CTA-PE, as this small amount of clot burden has here-to-fore not been shown to be clinically significant for patient survival. There are however many clinicians that will actively anti-coagulate patients with a single subsegmental PE. The risks and benefits of anticoagulation for PE needs to be carefully considered, particularly for older individuals, as anticoagulation therapy can be associated with significant morbidity and even death.
The lack of medical radiation to the chest is one of the key advantages of pulmonary MRA. In younger individuals there is a higher degree of radiation sensitivity. It would be beneficial to have a non-ionizing alternative to CTA and Nuclear medicine V/Q scanning for younger patients and female patients, for whom the possible diagnosis of PE needs to be evaluated. Pijpe and colleagues have recently shown that even a mammogram in those patients with BRACA1/2 mutations has a measurable effect on the induction of breast malignancy. (26) They have found the hazard ratio (HR) to be 1.63 in this group after only 0.002 Gy of medical radiation. They also have demonstrated a dose response relationship between the induction of malignancy and the amount of medical radiation used. This indicates that for this distinct population of at risk patients (BRCA1/2), there is no Linear Dose Threshold for the induction of malignancy using medical radiation. Additionally, these authors have found some preliminary evidence that exposure to computed tomography before the age of 30, was associated with an increased risk of breast cancer - HR 2.36 (95% C.I. 0.71–7.88). (26) In the emergency situation, the status of a particular patient’s BRCA1/2 genotype is frequently unknown. From a medical radiation safety perspective, one can certainly make the argument that at those sites with sufficient technical expertise, MRA-PE exams should at least be offered as an alternative to CTA for young women and children with a positive D-dimer and clinical risk factors for PE.
Chronic PAH leads to death from Cor Pulmonale
There is a common fatal pathway for all patients with chronic PAH -Cor pulmonale (Figure 3). (27) Over time, this elevated pulmonary arterial afterload induces right ventricular hypertrophy (RVH). While in the short term the RV is able to compensate for the demands of increased PAP; ultimately, failure occurs when the RV is no longer able to keep up with the insatiable need for more PAP as the PVR continues to worsen. The downward death spiral continues unabated as PAH progresses due to less blood returning from the lungs to the left heart resulting in loss of cardiac output and coronary perfusion. A second major problem develops from the back pressure due to worsening central venous hypertension. As major organs fill up with interstitial fluid, tissue perfusion suffers and there is an increased demand for even higher systemic pressures of oxygenated blood. This in turn activates the adrenal axis of renin and angiotensin to raise systemic systolic blood pressure- the last thing a left ventricle needs is more demand to generate pressure in the face of diminishing cardiopulmonary reserve and less coronary artery flow. For a while, the right and left ventricles are able adapt to the demands of these new pressure volume loops. However, the good news is short lived in the setting of progressive PAH because the right ventricle is not able to keep up with the ratcheting up of demands for increased pressure (increasing load) from worsening of the mPAP. Thus, the beginning of end starts for the patient, as their body is no longer able to sustain the basic needs of tissue oxygenation and waste (nitrogen and CO2) disposal. It is for this reason that death occurs so rapidly in these patients.
Figure 3.
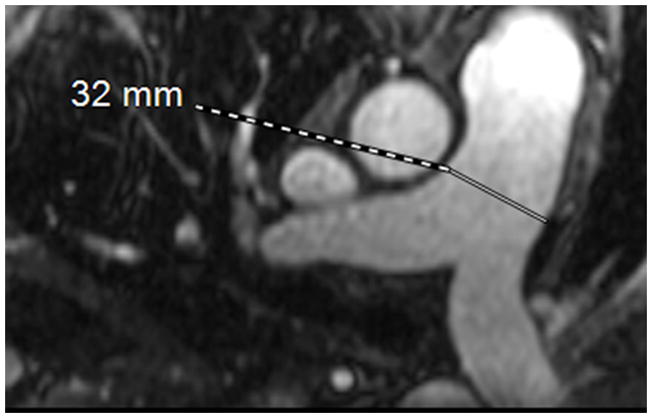
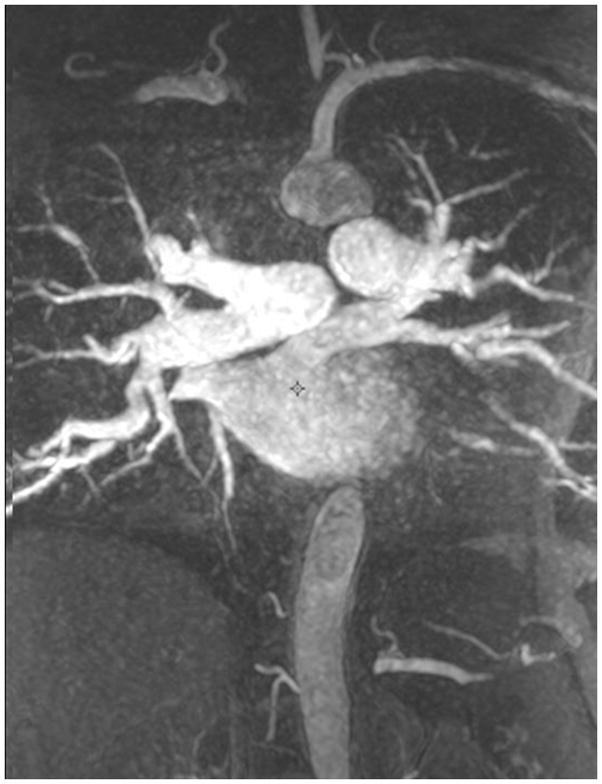
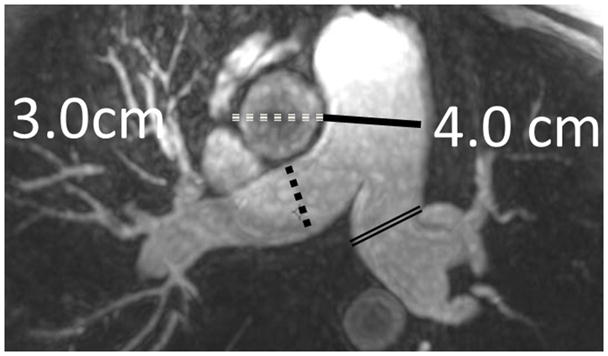
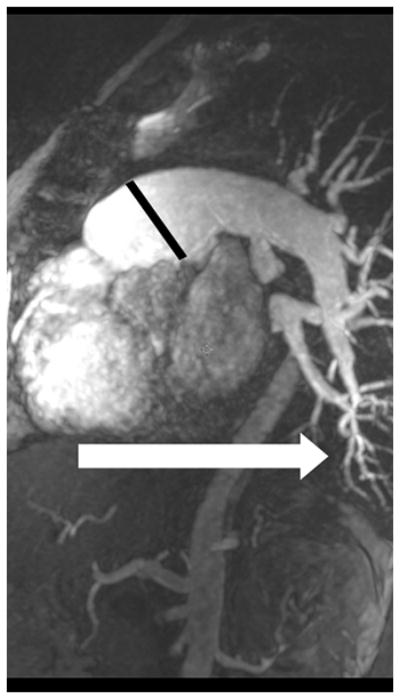
MRA of chronic pulmonary arterial hypertension from Systemic sclerosis (A) Single 1.2 mm slice Axial 3D MRA of slightly enlarged pulmonary trunk in the setting of mild chronic PAH from Scleroderma, (B) Coronal thick slab MRA MIP of advanced PAH from Systemic sclerosis, axial thick slab MIP of advanced PAH from systemic sclerosis, (c) thick slab MIP axial MRA of advance PAH from Systemic sclerosis showing an enlarged pulmonary trunk (thick black line) at 4 cm, and a normal sized ascending aorta (dashed white line), with enlargement of both the right (dashed black line) and left main pulmonary artery(double thin black lines) (d) Sagittal thick slab double oblique thick slab MIP angled to the left lower lobe pulmonary artery (black line) of advanced PAH from systemic sclerosis showing vessel amputation and a corkscrew path (arrow) to the lung periphery.
Right Ventricular changes induced by chronically elevated PAP
There is an essential commonality to all of the imaging findings of RV in the setting of elevated PAP that simply reflects the underlying biomechanics of this “piggy back” ventricle straining to generate higher than normal pressures. Specifically, the three primary findings indicative of right heart strain are: 1) Dyskinesia at the RV free wall next to the atrioventricular groove seen at echocardiography or SSFP cardiac gated MRI (“McConnell’s Sign”) (28); 2) Straightening of the interventricular septum indicating higher RV pressure than LV pressure at that point in the cardiac cycle (CTA, MRA); and/or 3) Bowing of the interventricular septum from right ventricle towards the left ventricle at systole indicating that RV pressure (or volume) > LV pressure (or volume) at that point in the cardiac cycle. This interventricular septal bowing can also be seen in diseases that do not have increased pulmonary artery pressures; such as with constrictive pericarditis during inspiration, where the diastolic inflow volume of the RV exceeds the diastolic inflow volume of the LV simply resulting in bowing the septum towards the LV during diastolic filling. There are also secondary signs of right ventricular strain: A) velocity of the tricuspid regurgitation (TR) jet increases proportionally with the severity of PAP elevation; (29) B) progressive right ventricular hypertrophy (RVH); C) increasing right ventricular dilation (larger minor and major axes); and (D) increasing in right ventricular end- diastolic volume index (RVEDVindex); and E) occasionally a pericardial effusion. (30) The amount of RVH (millimeters of wall thickening) is dependent on the chronicity of the elevated PAP and how much excess volume is present at end diastole. Just as in left ventricular failure associated with diseases causing severe afterload; as the RV begins to fail from the increased afterload of chronically elevated mPAP, the RVH gives way to dilation with an overall increase in the RVEDVindex (Table 2).
Non contrast CT findings of elevated PAP
The standard non-contrast CT without cardiac gating of the chest contains a wealth of information about the cardiopulmonary system (Tables 2 and 3). (31–39) Over the last 20 years there are two areas in the mediastinum that have garnered a great deal of attention in those patients suspected of having PAH: the pulmonary trunk and the right and left main pulmonary arteries. (34) These have been measured in many conditions and have been found to be larger in PAH (Table 4). (31–40) Devaraj and colleagues have recently shown that the right and left pulmonary artery diameters exceeding 1.8 cm are the best predictor of mortality in patients with bronchiectasis; as these CT findings are considered to be a biomarker for elevated PAP. (41) There are some authors that have recently proposed using the ratio of the pulmonary artery diameter to the aortic diameter (PAD/AoD) as a proxy for pulmonary arterial enlargement. (20) The PAD/AoD ratio is limited by many factors not the least of which is the great deal of variability in aortic size which is independent of pulmonary arterial pressures. However, most of the studies evaluating pulmonary arterial size (pulmonary trunk and the right and left main pulmonary arteries) in patients with PAH (and other causes of PH) on non-contrast CT are not prospectively case controlled; very few correct for male and female sex differences, few relate the size of these vessels to the body mass index, and there is no agreed upon standard way to measure these vessels (Table 4). Given these many important problems, it is a wonder that any of these arterial measurements have shown even modest efficacy for the determination of elevated PAP.
CT can be definitive for the diagnosis pulmonary veno-occlusive disease (PVOD) which is a rare but clinically important cause of PAH. (42) This disorder can occur at any age; however, it is more common in children and young adults. This is a very uncommon disease with an incidence reported to be approximately 0.1–0.2/106 persons. PVOD tends to have a rapid onset of symptoms with little right ventricular hypertrophy. This is one of the few causes of PAH that occurs on the “post capillary” side of flow of fluid through the lungs. In the 6/7 patients in Frazier’s series from the Armed Forces Institute of Pathology demonstrated evidence for longstanding PAH on CT: 1) Right heart enlargement, 2) Pulmonary artery > 3cm in size, 3) Pericardial effusion, 4) Reflux of contrast into the hepatic veins. (42) The imaging findings on CT that can help distinguish PVOD from the other more common causes of PAH include patchy ground-glass opacities (GGO), poorly-defined centrilobular nodules in a random lung zonal distribution, smooth interlobular septal thickening, pleural effusions, and lymphadenopathy as these features are not typical of precapillary causes of PAH.
CT is also very helpful in suggesting the diagnosis another very rare disease that can cause PAH: pulmonary capillary hemangiomatosis (PCH). (42) Up to 30% of these patients may present with hemoptysis. The CT findings of PCH are similar to PVOD in that there is an enlarged pulmonary trunk with a normal sized left atrium. There are however some distinct differences between these two entities. In contrast to PVOD, there are fewer smoothly thickened interlobular septae and there are more ground glass opacities that are either geographic or nodular (related to plexiform angiopathy) seen in PCH. The imaging diagnosis is of critical importance for both PVOD and PCH patients. This is because if vasodilators medical therapy is instituted, the outcome can be fatal. The reason for this complication is interesting physiologically. With the pharmaceutically induced pulmonary arterial vasodilation a rapid pressure drop occurs in the pulmonary arteries. However, these arteries still must pump blood against the fixed high pressure of the pulmonary capillaries (PCH) or post capillary venules (PVOD). This new pressure differential results in a transudate of fluid into the alveoli that can critically flood the alveolar spaces. The hallmark of both of these disorders (PCH and PVOD) is the presence of normal pulmonary wedge pressures with PAH.
Liver disease may affect the pulmonary circulation
There are two conditions of the pulmonary circulation that are directly related to liver disease: portopulmonary hypertension and hepatopulmonary syndrome. (43,44) In portopulmonary hypertension the cause of PAH is related to excessive pulmonary arterial vasoconstriction eventually leading to Cor pulmonale. Hepatic cirrhosis and the presence of portal hypertension (esophageal varicies) can be an important clue as the possible presence of this important complication of liver disease. The CT findings in portopulmonary hypertension are of pulmonary arterial enlargement, right heart dysfunction associated with liver disease. At many liver transplant centers this is a frequently undiagnosed comorbid condition in those patients awaiting liver transplant and can lead to rapid death. There has been a single report with up to 50% mortality rate at six months in this disease.
The second condition that can be seen in this population is hepatopulmonary syndrome which is caused by many small intrapulmonary shunts (right to left shunt as blood bypasses the alveolus) at the capillary level results in an admixture lesion leading to peripheral hypoxemia that can be difficult to treat. (43) This entity can also be demonstrated with an echocardiographic contrast study (micro-bubbles in the left atrium) or a V/Q scan (99mTc-MAA in the organs). Patients with hepatopulmonary syndrome may have abnormal CT scans with vessels extending to the lung periphery without fibrosis. Secondary findings of portal venous hypertension such as ascites, esophageal varicies, and hepatic cirrhosis may also be apparent.
Computed Tomographic Angiography of elevated PAP
The prototype disease for the demonstration of chronic PH is chronic pulmonary thromboembolic disease (CTEPH) (Figures 4 and 5). The diagnosis of this is disease is traditionally established with V/Q scanning and Right heart catheterization CTA however can also be useful in the diagnosis and follow-up of these patients. (45,46) The underlying histopathology of this disease has to do with the chronic deposition of thrombi and cytokine-mediated scarring leading to increasing PAP. This can be seen even after one episode of PE. The increased PAP induces smooth muscle cell hypertrophy of the small pulmonary arterioles. This vicious cycle repeats itself again and again; finally leading to death from Cor pulmonale.
Figure 4. CTAfindings in pulmonary hypertension.
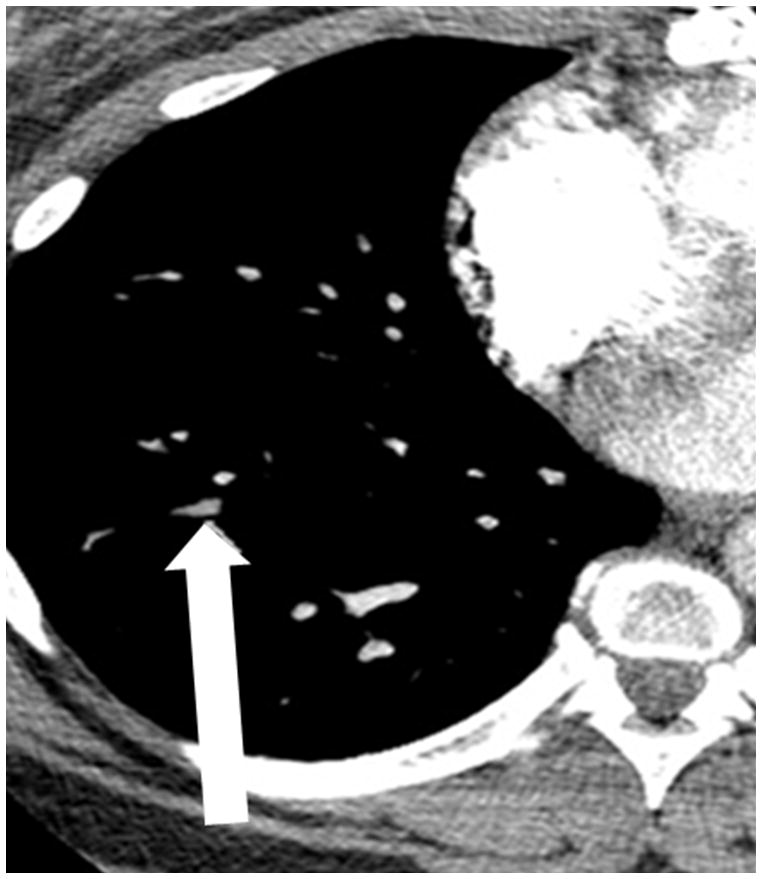
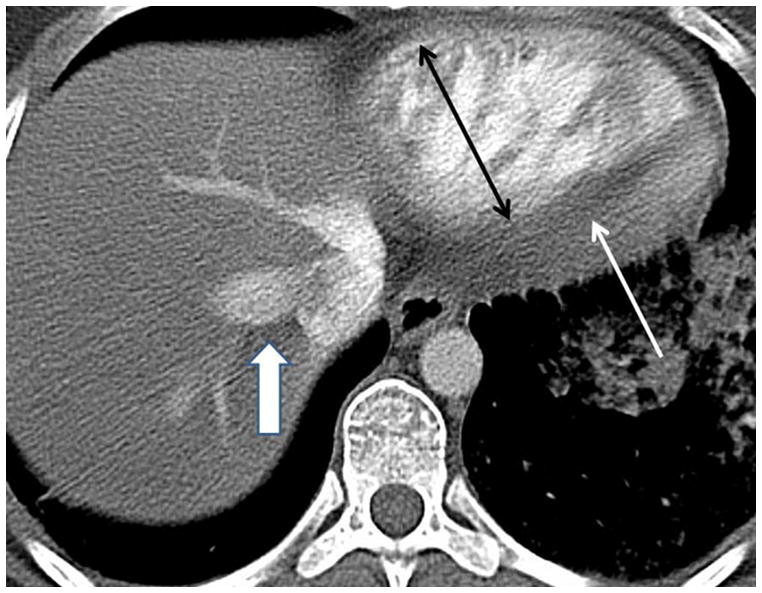
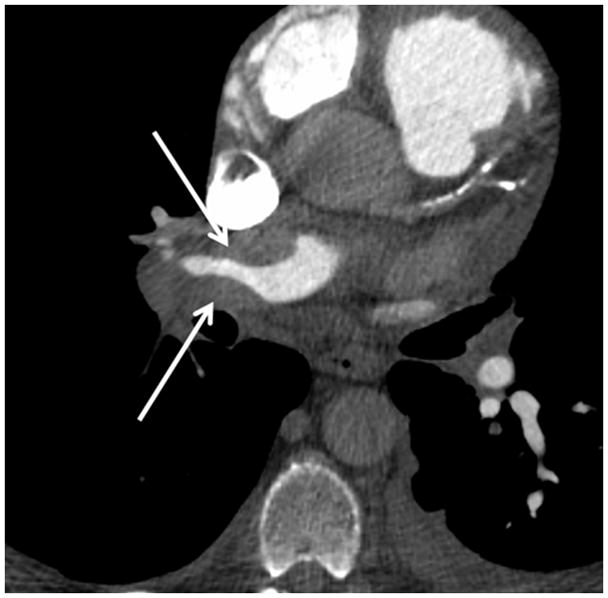
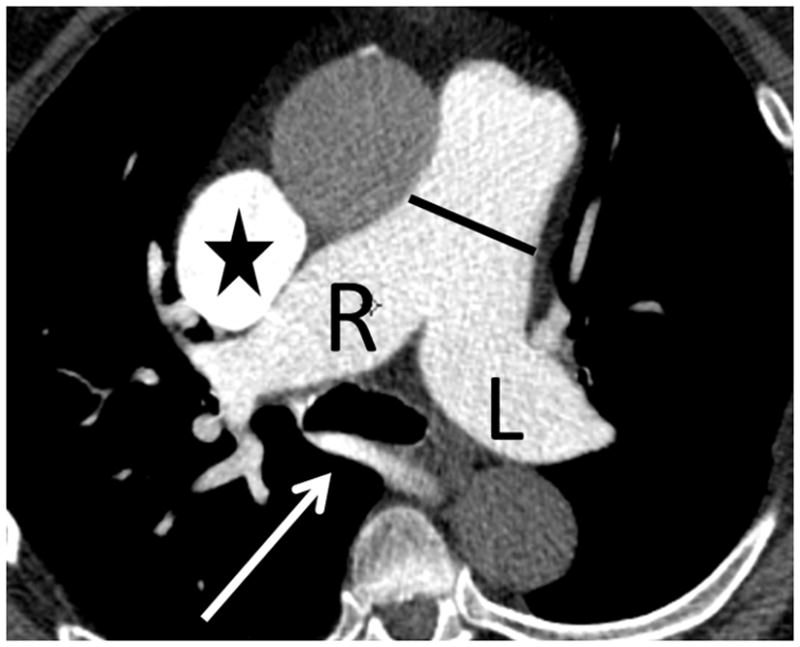
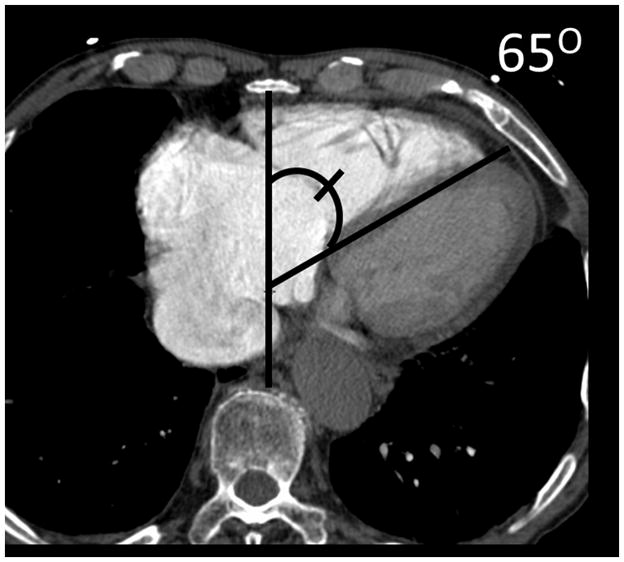
(a) Chronic thromboembolic pulmonary hypertension (CTEPH) with an embolus (arrow) in a subsegmental branch of the lateral segment of the right lower lobe, (b) Elevated pulmonary arterial pressure can be inferred with septal straightening (white arrow) and enlargement of the right ventricle (black arrows). There is reflux into the hepatic veins (white arrow) and inferior vena cava which is an imaging feature of elevated central venous pressure, (c) CTA from a patient with CTEPH showing circumferential chronic clot in the right main pulmonary artery (arrows). This can be removed surgically (pulmonary thromboembolectomy) with a postsurgical lowering of the mean pulmonary arterial pressure. This surgery results in an improved life expectancy for these patients, (d) Dextro- phase CTA showing an enlargement of the superior vena cava (star), pulmonary trunk (black line) and the right (R) and left (L) main pulmonary arteries with reflux into the azygous vein (white arrow), (e) CTA of pulmonary hypertension showing an increased ventricular septal angle at 65 °.
Figure 5. Cardiac MRI of pulmonary hypertension.
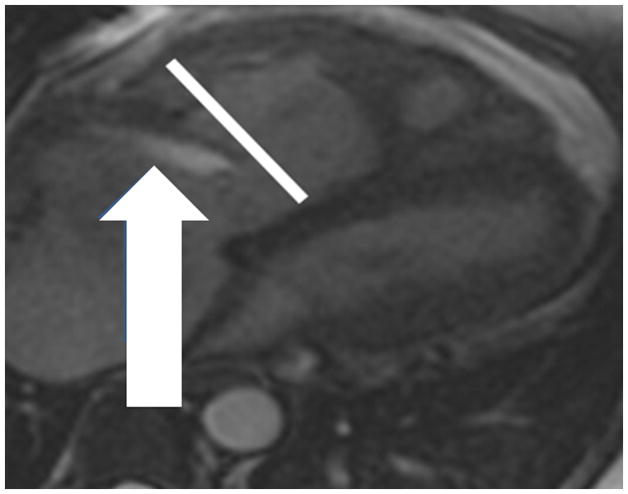
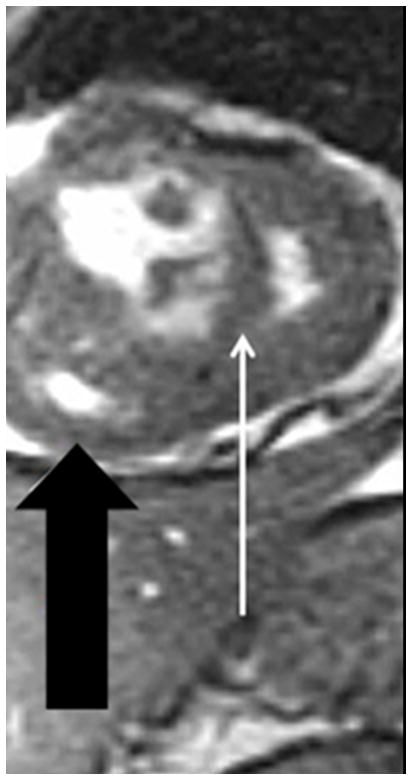
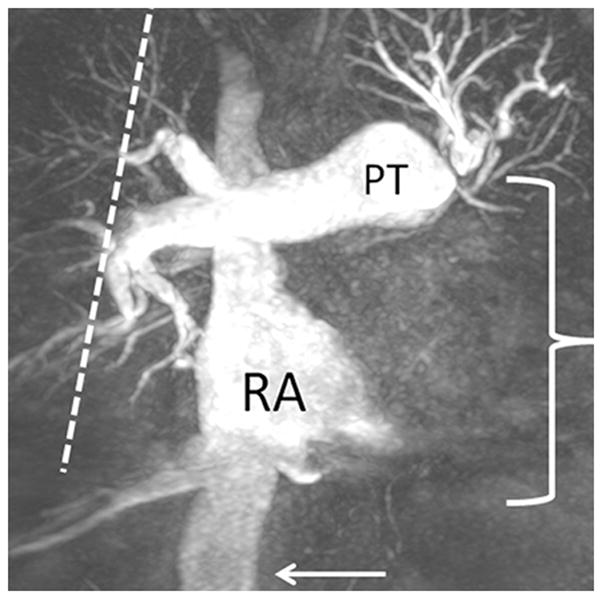
(a) Chronic thromboembolic pulmonary hypertension (CTEPH) four-chamber SSFP showing a jet of tricuspid regurgitation (TR) parallel to the anterior leaflet of the tricuspid valve (arrow). The jet velocity and total flow of TR can be quantified with phase contrast MR methodology using an offline workstation. The TR jet velocity is proportional to the mean pulmonary artery pressure. The short axis of the right ventricle is increased in size (line), (b) Chronic thromboembolic pulmonary hypertension (CTEPH) short-axis SSFP showing right ventricular hypertrophy (fat arrow) and bowing of the interventricular septum (small arrow). This bowing indicates that the pressure in the right ventricle exceeds the pressure in the left ventricle at that specific time point in the cardiac cycle., (c) Dextro phase MRA showing reflux into the inferior vena cava (arrow), enlarged pulmonary trunk (PT), occlusion of left lower lobe pulmonary artery with a total lack of perfusion to the left lower lobe (bracket), and pruning of the right lung peripheral pulmonary arterial vasculature (dashed arrows).
The CTA findings of CTEPH can be divided into three main categories: pulmonary artery findings, pulmonary parenchymal findings and other cardiovascular findings. The pulmonary artery findings for CTEPH include: a) eccentric and/or circumferential thrombus that rarely calcifies, b) intravascular webs, c) beading of the vessels, d) vessel truncation and e) thready vessels and f) enlargement of the pulmonary trunk. The other cardiovascular findings include: a) right ventricular hypertrophy and b) bronchial artery hypertrophy. The primary lung parenchymal finding is the “mosaic pattern” of decreased lung parenchymal attenuation from the chronic loss of perfusion. (47) Note that the “mosaic pattern” can be differentiated from air trapping by use of “end expiratory” NCCT imaging. In cases where there is air trapping, the “mosaic pattern” will not normalize. Another parenchymal finding includes bronchiectasis which is defined as enlargement of the bronchus and lack of normal tapering. This last finding (bronchiectasis) is important because simple comparison with the vessel size can be misleading as the vessel may be small from chronic embolic disease.
The coexistence of multiple of these findings is usually related to CTEPH and the patient is likely to be symptomatic.
There are other causes of bronchial artery enlargement besides CTEPH that may be seen in chronic PH; these include the following related conditions: bronchiectasis (most notably cystic fibrosis), fibrosing mediastinitis (Dana Point Category 5) and congenital heart disease with Eisenmenger physiology. These bronchial arteries can be challenging to see on routine transverse images, yet often explain hemoptysis in PH. They are often better seen on coronal images. Thin section coronal maximum intensity projections (4–7mm) are especially useful highlighting bronchial arteries.
Fractal analysis of Vessel pruning in PAH
The pulmonary arterial tree in patients with chronically elevated PAP shows pruning as the central elastic pulmonary arterial vessels expand due to La Place’s law, while the smaller peripheral pulmonary arteries resist pressure induced enlargement by smooth muscle hypertrophy in their media. Recognition of this response by the pulmonary vascular bed to chronically elevated PAP can be exploited by analyzing the MIP data of the pulmonary arterial tree using a mathematical method called fractal analysis. Recently Haitao and colleagues have shown some utility in this approach wherein the fractal dimension (FD) for patients with PH is determined. (48) Briefly, when employing the box counting method, the FD is defined as the slope of the log of the number of boxes plotted against the log of 1/box size. In their investigation using CTA data from 14 PH patients and 17 normals, the FD calculated was found to be correlated with PAP (r= 0.82; p value <.05). (48) This method may prove to have some merit in the clinical setting as it is a mathematical construct of that patient’s pulmonary arterial branching pattern and volume, which may prove to be more useful than simple arterial size measurements. The observation of important vessel pruning may be found in any of the diseases listed in the Dana Point Category 1(PAH). The severity of pruning tends to be far less in the Dana Point Categories 2–5 (PH).
CTA Biomarkers for elevated PAP
Currently, when CTA is used for PH assessment, a non-gated PE protocol is used with images manipulated on a 3D workstation. Assessment of the RV for enlargement and hypertrophy is combined with evaluation of the lung parenchyma for diffuse disease. The pulmonary arteries are assessed for caliber, and filling defects. MIPs are used to look for bronchial arteries and further evaluate any diffuse parenchymal disease. When combined (lung parenchyma; evaluation with RV assessment) the CTA can be highly useful for PH characterization.
Another finding that may be appreciated on CTA for PH is calcification of an eccentric thrombus. Although this rarely happens in CTEPH, this finding is more commonly seen in other causes of pulmonary hypertension, including mitral disease and Eisenmenger syndrome. Calcification of the pulmonary artery and enlargement of the right ventricle: a sign of congenital heart disease. Eisenmenger syndrome--pulmonary hypertension, increased pulmonary resistance, and reversal of blood flow. Care must be taken to avoid assuming that all eccentric calcified thrombus is due to CTEPH.
The use of cardiac gating with CTA is helpful as centerline measurements, double oblique short axis measurements, and/or volume measurements can help to more accurately characterize the size of the pulmonary trunk and right and left main pulmonary arteries. A recent publication in patients without known pulmonary disease determined that the normal end diastolic double oblique short axis mean measurement for the main pulmonary artery diameter was 2.5 cm with a has a very broad range (1.89 cm – 3.03 cm ± 2 S.D), and corrected for body surface area the mean pulmonary artery diameter was 1.2 (0.94–1.7). The current normograms for aortic size have taken into account age, sex, and body mass index. However, there are no normograms for the pulmonary trunk that take age and sex into account nor is there an agreed upon a standard way to measure it. There are only a few publications that have indexed their pulmonary artery diameter measurements to body surface area (32,33,37). Wells et al have shown that the pulmonary artery/aorta ratio is associated with COPD exacerbations; presumably because the pulmonary artery is larger in those patients with more severe pulmonary hypertension. (49) The use of cardiac gating, centerline measurements or double oblique short axis measurements, and or volume measurements can help to more accurately characterize the size of the pulmonary trunk and right and left main pulmonary arteries. A recent publication in patients without known pulmonary disease determined the normal end diastolic double oblique short axis mean measurement for the main pulmonary artery diameter was 2.5 cm and has a very broad range (1.89 cm – 3.03 cm ± 2 S.D). When this was corrected for body surface area, the mean pulmonary artery diameter was 1.2 (0.94–1.7) (Table 3). The current normograms for aortic size have taken into account age, sex, and body mass index. However, there are no normograms for the pulmonary trunk that take age and sex into account, nor is there an agreed upon a standard way to measure it. There are only a few publications that have indexed their pulmonary artery diameter measurements to body surface area. (32,33,37,50) In addition, this added work has not been demonstrated to improve the accuracy of CT for PH detection. (51) One benefit of CT is that it reliably allows for comparison of the segmental and lobar arteries with their corresponding bronchi. The bronchi cannot be reliably measured on MRI; although the use of ultrashort Time to echo (UTE) shows some promise for the visualization of lung structure. (52) Studies have shown that the degree of enlargement of the segmental artery bronchus ratio corresponds with the severity of PH and is highly reproducible. (51) Gated studies may have a role in the assessment of RV volumes when the patient is unable to undergo MR. This use of CTA for the calculation of right or left ventricular function is often limited in clinically due to medical radiation concerns related to the acquisition of both end systolic and end-diastolic phases. This limitation may not be as important an issue in the future as dose reduction methods are more fully explored for this purpose.
Septal Angle is increased in patients with elevated PAP
The use of cardiac gating has allowed investigators to determine right ventricular functional parameters from CTA. Currently, most CTA in the evaluation of PH is not performed with ECG-gating. This method however does rely on retrospective gating which increases the radiation dose, so this method has some important drawbacks. Liu and colleagues(53) have recently demonstrated the efficacy of using the septal angle as a CTA derived parameter of the position of the interventricular septum (IVS) in relation to the anterior posterior axis determined by the mid sternum and mid vertebral body at the level of the IVS. They found that the septal angle in patients with CTEPH correlated with the PVR (p < .001).
Limited Standardization of CTA measurements in PAH is a problem
The specialties of thoracic radiology and pulmonary medicine would be advanced by agreeing on how to measure the pulmonary artery. Similar to the extensive literature that is now available for the ascending aorta and its propensity for aortic dissection based on size, our specialty could create normograms of the pulmonary artery that take the following features into account: (1) cardiac phase, (2) sex, (3) age and (4) index to BMI for all chest exams. It is likely that these precisely defined and indexed measurements of the pulmonary artery would have a better correlation with elevated pulmonary pressures and be predictive of early death.
Echocardiography remains the noninvasive test of choice for elevated PAP
Despite the many advantages favoring the use of MRI, echocardiography still remains the exam of choice for PAH (and other causes of PH) diagnosis and follow up prior to right heart catheterization. This fact may be related to the convenience of echocardiography, as it can be performed at the bedside on very sick patients. (27)
MR imaging of elevated pulmonary artery pressure
Of all the non-invasive methods now available for the diagnosis and follow up of patients with PAH, and other causes of PH, Magnetic resonance imaging (MRI) has the brightest future (Figures 6 and 7). The use of MRI in the setting of known or suspected pulmonary hypertension can be a helpful adjunct to the currently available tests (right heart catheterization, TTE, TEE, V/Q scanning, and pulmonary function tests) because of its highly accurate and reproducible analysis of RVEF (Table 4). (17–19,54,55) MRI and Magnetic Resonance Angiography (MRA) are more accurate for the morphological assessment of right ventricular morphology and function, has better reproducibility for the determination of ventricular mass, RVEF, RVSV, RVEDV, RVEDVindex, Right and left atrial size, regurgitant jet velocity and volume, myocardial scaring, flow patterns of interventricular bulk flow, pulmonary venous anatomy, LVSV, LVEDV, LVEDVindex and LVESVindex. (56,57)
Figure 6. 4D flow MRI of Pulmonary arterial hypertension from partial anomalous pulmonary venous return (Dana point 1.4.4).
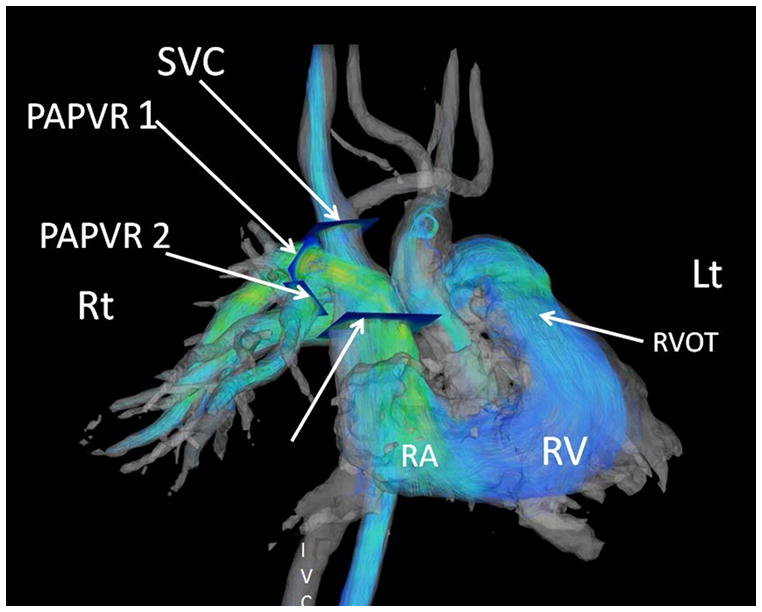
Images were post processed from a respiratory gated Phase Contrast Vastly Undersampled Isotropic Projection Reconstruction (PC-VIPR). These streamlines are color coded for velocity information. The individual contributions of each anomalous vein can be derived from an off line workstation with tools that convert the phase shift information to flow over the cardiac cycle for each manually selected cut-plane. The separate cut planes for the superior vena cava (SVC) and the two anomalous pulmonary veins (PAPVR1 and PAPVR2) are shown by arrows. (Post processing using Encyte™ performed by Phillip Kilgas and Elizabeth Nett, PhD) (Key to abbreviations: IVC- inferior vena cava, RA- right atrium, RVOT- right ventricular outflow tract).
Figure 7. Pulmonary perfusion in a normal volunteer.
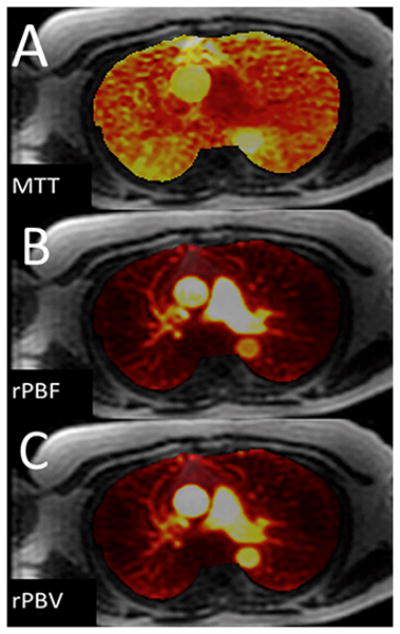
(images were not corrected for the arterial input function): (A) Approximate Mean transit time (MTT); (B) Relative pulmonary blood flow; (C) Relative pulmonary blood volume. (Images courtesy of Scott Nagle, M.D., PhD, and Laura Bell, M.S.)
Survival in patients with elevated PAP is directly related to RV function
As recently shown by van de Veerdonk and colleagues in patients undergoing medical therapy for PAH, an improvement in RVEF was found to be highly correlated with survival (p value <0.014) while changes in PVR were not (p value <0.8) (Table 4). (18) These authors concluded that if the right ventricle does not recover function with medical therapy, despite the lowering of PVT, the inevitable cascade of events leading to early death from Cor pulmonale will occur. (18)
The quantitative aspects of MRI are becoming more important for the study of patients with elevated PAP as these measurements can provide non-invasive biomarkers for this disease that may facilitate surgical management or medical treatment decisions. (33,58–60) The various types of quantification available with MRI are: 1) Morphological- Chamber and vessel size throughout the cardiac cycle for right and left ventricular ejection fractions, ventricular mass, and end-diastolic and end systolic mass indices, 2) Flow throughout the cardiac cycle (velocity, direction, and acceleration) which is very helpful in the quantification of: (a) tricuspid valve regurgitation and/or pulmonic regurgitation, (b) early “e” and late “a” atrial wave net flows into the right atrium, (c) vessel wall compliance, and (d)wall sheer stress.
MR in CTEPH
In patients with CTEPH, MRA is similar to CTA in showing the detail of the central pulmonary arteries and can also show subsegmental vessels as well using parallel imaging and breath-holding techniques (Figure 5). (58,61) Survival in patients with PH from CTEPH is better when RVEF is preserved, while the combination of elevated mPAP and diminished RVEF portends a very poor prognosis. (19) It has recently been shown that delayed contrast enhancement (DCE) in the myocardium is common in patients with elevated PAP. (60) The severity of PAP was found to be the primary determinant of this finding. (60) As is commonly seen at Transthoracic echocardiography (TTE) and/or Trans esophageal echocardiography (TEE) the presence of systemic (or greater) right ventricular pressures/volume overload are shown on cine MRI on short axis imaging by observing bowing of the interventricular septum towards the left ventricle. (56,62) The shift in the position of the interventricular septum from convex to concave is directly proportional to the mPAP and PVR. The reasons for this bowing in the setting of congenital heart disease with a right to left shunt can be related to pulmonary arterial pressures greater than systemic such as is found in Eisenmenger Syndrome. In the acute setting of elevated PAP due to pulmonary embolus the RV cannot generate systemic pressures >40mmHg and in the chronic state the mPAP is often still less than systemic pressures- thus another explanation is needed for septal bowing; this finding represents a change in the ventricular coupling. The concept of interventricular septal (IVS) bowing in both acute and chronic elevation of the PAP is explained by mechanical asynchrony (uncoupling) wherein the elongation of the right ventricular contraction and under filled left ventricle concert to allow for bowing from right to left of the IVS. (62)
Combining structural and functional analysis improves efficacy for MRI CTEPH
MRI has an evolving role to play in the workup of CTEPH. Using CTA as the gold standard, the active pulmonary hypertension group in Sheffield, United Kingdom has recently shown that by combining non contrast MRI (proton density), MRA, and perfusion MRA that there is an improvement in the ability to diagnose CTEPH over simply using MRA images alone. (76) Utilizing CTA as the gold standard in their study of 53 CTEPH patients (and 36 controls) they found that MRA showed excellent results for the diagnosis of this disorder (98% sensitivity and 94% specificity). Each patient had three MR series performed: (1) pre-contrast steady state free procession (SSFP) acquisition, (2) time resolved contrast enhanced MRA (TRICKS), and (3) high resolution contrast enhanced MRA. The contrast enhanced MRA alone showed 92% sensitivity for the diagnosis of chronic thromboembolism. (61) For the centrally based disease of chronic clot in the main pulmonary arteries, use of the SSFP images was very helpful. Of interest was the fact that the CE-MRA found more disease than the CTA in the following situations: more stenosis 29/18, more post stenotic dilation 23/7, and more occlusions 37/29. (61) These areas of better performance are not well demonstrated using the statistical method that assumes CTA is the gold standard. Thus MRA would appear to underperform CTA from a simple sensitivity and specificity point of view, when in fact it has performed better. As could be expected, CTA was better at determining the presence of (a) webs and bands from resolving clot and (b) adherent wall thrombi. Analysis of the lung parenchyma for nodules or evidence of PCH or PVOD is also a known weakness of MRA. The authors did not address the issue of how well mosaic perfusion was seen by the time resolved MRA vs. CTA in their patients with CTEPH.
MR measurement of Shunt fraction (Qp/Qs)
The calculation of shunt fractions (Qp/Qs) in patients with congenital heart disease is an important application of MRA phase contrast flow methodology. (63) The shunt fraction and how it changes over the life of the patient can be monitored non- invasively. Of note, however, is that unlike RHC, oxygen saturation in the chambers of the heart cannot be measured using MRI. Typically patients with left to right shunts will be considered for operative management when the shunt fraction (Qp/Qs) is > 1.5.
MR measurement of Tricuspid and Pulmonic Valvular Regurgitation
For the quantification of valvular regurgitation standard steady state free procession (SSFP) images are not as useful as echocardiography or phase contrast methods for the detection of mild regurgitant jets. (64) The regurgitant fraction for each valve can be determined which is a major advantage of this method. (64) The issue of estimating the mPAP from tricuspid regurgitant jet velocity measurements with phase contrast MRA is not that the jet velocity can’t be measured, so much as it is that the modified Bernoulli equation itself has limitations for PAP estimation as has been previously discussed.
Non Contrast Perfusion and ventilation MRI
The use of non-contrast Fourier decomposition (FD) has been recently introduced as a new method to visualize lung ventilation and perfusion (65,66). While this method is not currently ready for clinical use, it offers the following benefits for future research in pulmonary functional imaging: (a) no IV contrast, (b) no inhaled contrast, (c) no radiation, and (d) no need for breath-hold. The pulse uses a 2D balanced SSFP pulse sequence to acquire a few coronal (typically 4–6) 2D images of the chest at a temporal resolution of 3–4 frames/sec. The data is processed to separate the contributions of respiratory motion (“ventilation”) and cardiac pulsatility (“perfusion”) to the observed signal changes on a pixel-by-pixel basis. This post-processing involves first using non-rigid image registration to remove bulk motion from the time-series of images, followed by time-domain Fourier analysis, taking advantage of the fact that the frequency of respiratory motion is different from that of cardiac pulsatility. This method is in the validation stage now, but given its safety profile and low cost, this holds important promise for the future of functional lung imaging.
4D flow allows for volumetric sampling of phase contrast information
There has been the recent introduction of a new MRA method for the quantification of flow (Figure 6). This has velocity encoding that can be either prospectively or retrospectively cardiac gated and is volumetric. This has been given the name of “Four D flow” imaging. This allows for multi-directional flow visualization with either particle traces or stream lines in the heart and large vessels (Figure 4C). (67–69) However, this is only made possible after extensive post processing using advanced visualization tools on a workstation using data from a respiratory and cardiac gated, volumetric, phase contrast acquisition at a defined amount of velocity encoding using a non-Cartesian reconstruction of the k-space data. This is a promising new visualization technique that may have some utility for pulmonary arterial flow analysis within the larger pulmonary arteries in patients with PAH. (56) Reiter and colleagues found that normal individuals demonstrate flow towards the distal pulmonary arteries throughout the cardiac cycle. (70) In those patients with both early (latent) and known PAH there were flow vortices directed in a retrograde fashion identified in the main pulmonary artery. (70) The time period that these vortices existed directly correlated with the mPAP at rest (r=0.94; 95% C.I 0.85–0.97) (70). This is a quantitative visualization method by which one is able to determine what exactly happens to the right ventricular stroke volume (RVSV) which is known to have an increased residence time in the proximal pulmonary arterial circuit due to an increased pulmonary vascular resistance (PVR).
MR Measurement of diminished Pulmonary Perfusion in PAH
MRI perfusion methods have been used successfully in PH patients demonstrating, as could be suspected, a delayed transit time in patients versus normals (Figure 7). (57,71) Calculation of perfusion parameters, including mean transit time (MTT), time to peak (TTP), blood volume (PBV) can in theory be performed using well-established methodology based upon indicator dilution theory (72) and the following formulas:
| Equation 1 |
| Equation 2 |
| Equation 3 |
where CVOI(t) is the contrast agent concentration in the volume of interest and CAIF(t) is the contrast agent concentration in the pulmonary artery (“arterial input function - AIF”), and R(t) is the fraction of contrast agent remaining at time (t). However, these calculations require post processing on a workstation that is not routinely available to most imagers. As can been seen, all of these derived values are critically dependent on first obtaining the arterial input function (AIF), which is typically obtained by measuring the signal intensity as a function of time in the pulmonary trunk. (71)
Ley and colleagues evaluated 20 patients with PH and 5 normal volunteers and determined the mean transit time (MTT), time to peak (TTP), blood volume (PBV) (Figure 6) using a 3D FLASH method after the infusion of 0.1mMolGd-DTPA/kg (57). They found that for the variables measured, only the dorsal transit times showed any significant difference between the PH patients and the normals (p value 0.04). (57)
Perfusion of the lung is influenced by the presence and severity of PAH. This can be demonstrated by using a 3D MRA first pass contrast enhanced MRA perfusion acquisition. As shown by Ohno and colleagues (71) there was a significant difference between the MTT and pulmonary blood volume between patients with PAH and normal patients (71). With the normal patients in their study having almost twice the blood flow (13 L/min vs. 7 L/min) and a slightly more rapid of the mean transit time (5 seconds vs. 8 seconds) than the patients with PAH. (71) There remain some important problems with quantitative pulmonary perfusion MRI. Most importantly, unlike iodinated contrast agents where concentration scales linearly and can be directly measured using CT Hounsfield units, gadolinium based contrast agents (GBCA) MR signal intensity scales as a non-linear function of GBCA concentration and therefore cannot be measured directly on MR images. Therefore, the measured signal intensity from a single MRA voxel (VOI) does not convert to an absolute concentration of GABA. At high contrast concentrations (such as those often seen in the pulmonary artery), saturation effects can blunt the measured AIF, causing underestimation of the contrast concentration at higher concentrations. This problem can result in an erroneous AIF profile. Simply decreasing the administered contrast dose can decrease these errors in determining the AIF. However this solution results in very low lung tissue signal-to-noise, making the perfusion parameter calculations (performed at low dose) very sensitive to noise. There have been two strategies employed to mitigate these problems: (1) a low-dose method (73) and (2) a dual bolus method (74). An additional, often overlooked source of error between reported “quantitative” MRI perfusion measurements is the lack of correction for the patient’s hematocrit level in all pulmonary blood flow measurements. Blood plasma is known to flow more slowly than erythrocytes in the blood. (75) Since gadolinium is principally dissolved in plasma, raw uncorrected flow measures are more related to plasma flow than to the more physiologically important, and faster, erythrocyte flow. There are known methods for correcting for this difference(72) but these require measurement of hematocrit in the pulmonary vasculature, which can differ from peripheral venous hematocrit. The picture becomes even more complex when one considers that each GBCA has a unique amount of albumin binding, and many GBCA are not strictly intravascular. Suffice it to say, that while great progress has been made towards quantitative pulmonary perfusion, significant work remains to be done.
Pulmonary arterial compliance decreases in pulmonary hypertension
Pulmonary arterial compliance in the large elastic vessels of the proximal pulmonary arterial tree diminishes with chronically elevated PAP. First described by Otto Frank in 1899, the “Windkessel” is a heuristic device wherein the effect of varying arterial compliance can be modeled mathematically (lumped model) to help explain how changes in elasticity of large vessels affects blood pressure and the pulse wave velocity. (76–78) This loss of elasticity (stiffening) coupled with increased pulmonary vascular resistance is problematic for RV function. (77) This change results in an increased afterload on the RV as it has no easy reservoir (pressure relief) to deliver its stroke volume to, and must directly pump into increased the pulmonary vascular resistance of the hypertrophied muscular arterial system of the branch pulmonary arteries. Stated in another way, chronic PAH robs the right heart of this natural reservoir (compliant/elastic pulmonary arteries) to store the energy (pressure) and volume delivered (flow) to the proximal pulmonary arteries. The lack of this energy storage (in the now non-compliant pulmonary arterial system) weakens the right ventricle by forcing it to hypertrophy in the face in increasing afterload of the pulmonary circulation.
One interesting feature of MRI is its ability to help quantify pulmonary artery stiffness when combined with RHC (79). In animal models of PH, pulmonary arterial wall stiffness has been shown to increase with PH progression. (80) Clinically, pulmonary artery stiffness, and its non-invasively measured surrogate, the relative area change (RAC = maximum systolic area-minimum diastolic area/maximum systolic area) have been shown to be independent predictors of mortality in PAH. (55) Recently, in a canine model of acute PH, both the arterial stiffness coefficient β (β=ln(systolic PAP/diastolic PAP/2RAC)) and the RAC were found to correlate with the overall pulmonary vascular compliance measured as the ratio of stroke volume to pulse pressure(SV/PP). (79) Stiffness of the pulmonary arterial system has many important implications for the right ventricle; specifically the afterload of the RV is increased from the oscillatory work of the RV due to the lack of compliance in both the proximal and distal pulmonary arteries. Several indexes of pulmonary artery stiffness are able to be calculated in humans (elasticity, distensibility, capacitance, stiffness constant (β) and pulse pressure) from combined RHC and MRI data. (80) Stevens et al. recently demonstrated that elevated PA stiffness was associated with lower RVEF, more right ventricular hypertrophy and dilation. In addition, and more importantly, alterations in PA elasticity appear to have occurred earlier than RV performance changes. (80)
Summary
This has been a review of how the known structural and functional changes associated with elevated pulmonary artery pressures (PAH and PH) can be studied with Magnetic Resonance Imaging and Computed Tomography. By understanding the dynamic relationship that exists between the heart and lungs in this heterogeneous group of diseases, the severity of this disease process can often be inferred. MRI is a promising non-invasive and non-ionizing modality that can be used to study the many diseases that cause PAH and PH in a longitudinal fashion. In the future, this method could be used to sequentially track the many parameters proven to have a direct relationship to survival: Relative area change (RAC) of the pulmonary trunk, RVSVindex, RVSV, RVEDVindex, LVEDVindex, and baseline RVEF <35%. This may allow for a better degree of personalization of the treatment regimen without having to resort to repeated right heart catheterizations for the longitudinal assessment of those unfortunate patients, valiantly struggling to survive, with this relentlessly progressive disease.
Learning Objectives.
After completion of this activity, physicians should be better able to:
Identify the defining characteristics of pulmonary hypertension
Identify MRI techniques best suited for evaluation of patients with known or suspected pulmonary hypertension
Diagnose pulmonary hypertension using various imaging techniques
Footnotes
Disclosure Statement:
Mark L. Schiebler, M.D. - No disclosures relevant to this manuscript
Sanjeev Bhalla, M.D. - No disclosures relevant to this manuscript
Scott K. Nagle, M.D., PhD. No disclosures relevant to this manuscript
James Runo, M.D. - No disclosures relevant to this manuscript
Nizar Jarjour, M.D. - No disclosures relevant to this manuscript
Alejandro Roldan, PhD - No disclosures relevant to this manuscript
Naomi Chesler, PhD - No disclosures relevant to this manuscript
Christopher J. François, M.D. - No disclosures relevant to this manuscript
References
- 1.Humbert M. The burden of pulmonary hypertension. The European respiratory journal : official journal of the European Society for Clinical Respiratory Physiology. 2007;30(1):1–2. doi: 10.1183/09031936.00055407. [DOI] [PubMed] [Google Scholar]
- 2.Strange G, Playford D, Stewart S, et al. Pulmonary hypertension: prevalence and mortality in the Armadale echocardiography cohort. Heart. 2012 doi: 10.1136/heartjnl-2012-301992. [DOI] [PMC free article] [PubMed] [Google Scholar]
- 3.Simonneau G, Robbins IM, Beghetti M, et al. Updated clinical classification of pulmonary hypertension. Journal of the American College of Cardiology. 2009;54(1 Suppl):S43–54. doi: 10.1016/j.jacc.2009.04.012. [DOI] [PubMed] [Google Scholar]
- 4.Galie N, Hoeper MM, Humbert M, et al. Guidelines for the diagnosis and treatment of pulmonary hypertension: the Task Force for the Diagnosis and Treatment of Pulmonary Hypertension of the European Society of Cardiology (ESC) and the European Respiratory Society (ERS), endorsed by the International Society of Heart and Lung Transplantation (ISHLT) European heart journal. 2009;30(20):2493–2537. doi: 10.1093/eurheartj/ehp297. [DOI] [PubMed] [Google Scholar]
- 5.Chin KM, Kim NH, Rubin LJ. The right ventricle in pulmonary hypertension. Coronary artery disease. 2005;16(1):13–18. doi: 10.1097/00019501-200502000-00003. [DOI] [PubMed] [Google Scholar]
- 6.Humbert M, Sitbon O, Chaouat A, et al. Pulmonary arterial hypertension in France: results from a national registry. American journal of respiratory and critical care medicine. 2006;173(9):1023–1030. doi: 10.1164/rccm.200510-1668OC. [DOI] [PubMed] [Google Scholar]
- 7.Rich S, Dantzker DR, Ayres SM, et al. Primary pulmonary hypertension. A national prospective study. Annals of internal medicine. 1987;107(2):216–223. doi: 10.7326/0003-4819-107-2-216. [DOI] [PubMed] [Google Scholar]
- 8.Badesch DB, Raskob GE, Elliott CG, et al. Pulmonary arterial hypertension: baseline characteristics from the REVEAL Registry. Chest. 2010;137(2):376–387. doi: 10.1378/chest.09-1140. [DOI] [PubMed] [Google Scholar]
- 9.Thenappan T, Shah SJ, Rich S, Gomberg-Maitland M. A USA-based registry for pulmonary arterial hypertension: 1982–2006. The European respiratory journal : official journal of the European Society for Clinical Respiratory Physiology. 2007;30(6):1103–1110. doi: 10.1183/09031936.00042107. [DOI] [PubMed] [Google Scholar]
- 10.Peacock AJ, Murphy NF, McMurray JJ, Caballero L, Stewart S. An epidemiological study of pulmonary arterial hypertension. The European respiratory journal : official journal of the European Society for Clinical Respiratory Physiology. 2007;30(1):104–109. doi: 10.1183/09031936.00092306. [DOI] [PubMed] [Google Scholar]
- 11.Hyduk A, Croft JB, Ayala C, Zheng K, Zheng ZJ, Mensah GA. Pulmonary hypertension surveillance--United States, 1980–2002. Morbidity and mortality weekly report Surveillance summaries. 2005;54(5):1–28. [PubMed] [Google Scholar]
- 12.D’Alonzo GE, Barst RJ, Ayres SM, et al. Survival in patients with primary pulmonary hypertension. Results from a national prospective registry Annals of internal medicine. 1991;115(5):343–349. doi: 10.7326/0003-4819-115-5-343. [DOI] [PubMed] [Google Scholar]
- 13.Huili G. The management of acute pulmonary arterial hypertension. Cardiovascular therapeutics. 2011;29(3):153–175. doi: 10.1111/j.1755-5922.2009.00095.x. [DOI] [PubMed] [Google Scholar]
- 14.van Beek EJ, Kuijer PM, Buller HR, Brandjes DP, Bossuyt PM, ten Cate JW. The clinical course of patients with suspected pulmonary embolism. Archives of internal medicine. 1997;157(22):2593–2598. doi: 10.1001/archinte.157.22.2593. [DOI] [PubMed] [Google Scholar]
- 15.Goodman LR, Lipchik RJ, Kuzo RS, Liu Y, McAuliffe TL, O’Brien DJ. Subsequent pulmonary embolism: risk after a negative helical CT pulmonary angiogram--prospective comparison with scintigraphy. Radiology. 2000;215(2):535–542. doi: 10.1148/radiology.215.2.r00ma23535. [DOI] [PubMed] [Google Scholar]
- 16.Qanadli SD, El Hajjam M, Vieillard-Baron A, et al. New CT index to quantify arterial obstruction in pulmonary embolism: comparison with angiographic index and echocardiography. AJR American journal of roentgenology. 2001;176(6):1415–1420. doi: 10.2214/ajr.176.6.1761415. [DOI] [PubMed] [Google Scholar]
- 17.Heyer CM, Lemburg SP, Knoop H, Holland-Letz T, Nicolas V, Roggenland D. Multidetector-CT angiography in pulmonary embolism-can image parameters predict clinical outcome? European radiology. 2011;21(9):1928–1937. doi: 10.1007/s00330-011-2125-3. [DOI] [PubMed] [Google Scholar]
- 18.van de Veerdonk MC, Kind T, Marcus JT, et al. Progressive right ventricular dysfunction in patients with pulmonary arterial hypertension responding to therapy. Journal of the American College of Cardiology. 2011;58(24):2511–2519. doi: 10.1016/j.jacc.2011.06.068. [DOI] [PubMed] [Google Scholar]
- 19.van Wolferen SA, Marcus JT, Boonstra A, et al. Prognostic value of right ventricular mass, volume, and function in idiopathic pulmonary arterial hypertension. European heart journal. 2007;28(10):1250–1257. doi: 10.1093/eurheartj/ehl477. [DOI] [PubMed] [Google Scholar]
- 20.Ng CS, Wells AU, Padley SP. A CT sign of chronic pulmonary arterial hypertension: the ratio of main pulmonary artery to aortic diameter. Journal of thoracic imaging. 1999;14(4):270–278. doi: 10.1097/00005382-199910000-00007. [DOI] [PubMed] [Google Scholar]
- 21.Stein PD, Chenevert TL, Fowler SE, et al. Gadolinium-enhanced magnetic resonance angiography for pulmonary embolism: a multicenter prospective study (PIOPED III) Annals of internal medicine. 2010;152(7):434–443. W142–433. doi: 10.1059/0003-4819-152-7-201004060-00008. [DOI] [PMC free article] [PubMed] [Google Scholar]
- 22.Revel MP, Sanchez O, Couchon S, et al. Diagnostic accuracy of magnetic resonance imaging for an acute pulmonary embolism: results of the ‘IRM-EP’ study. Journal of thrombosis and haemostasis : JTH. 2012;10(5):743–750. doi: 10.1111/j.1538-7836.2012.04652.x. [DOI] [PubMed] [Google Scholar]
- 23.Kalb B, Sharma P, Tigges S, et al. MR imaging of pulmonary embolism: diagnostic accuracy of contrast-enhanced 3D MR pulmonary angiography, contrast-enhanced low-flip angle 3D GRE, and nonenhanced free-induction FISP sequences. Radiology. 2012;263(1):271–278. doi: 10.1148/radiol.12110224. [DOI] [PubMed] [Google Scholar]
- 24.Schiebler ML, Nagle SK, Francois CJ, et al. Effectiveness of MR Angiography for the Primary Diagnosis of Acute Pulmonary Embolism: Clinical Outcomes at 3 Months and 1 Year. Journal of magnetic resonance imaging : JMRI. 2013 doi: 10.1002/jmri.24057. In Press. [DOI] [PMC free article] [PubMed] [Google Scholar]
- 25.Carrier M, Righini M, Wells PS, et al. Subsegmental pulmonary embolism diagnosed by computed tomography: incidence and clinical implications. A systematic review and meta-analysis of the management outcome studies. Journal of thrombosis and haemostasis : JTH. 2010;8(8):1716–1722. doi: 10.1111/j.1538-7836.2010.03938.x. [DOI] [PubMed] [Google Scholar]
- 26.Pijpe A, Andrieu N, Easton DF, et al. Exposure to diagnostic radiation and risk of breast cancer among carriers of BRCA1/2 mutations: retrospective cohort study (GENE-RAD-RISK) Bmj. 2012;345:e5660. doi: 10.1136/bmj.e5660. [DOI] [PMC free article] [PubMed] [Google Scholar]
- 27.Saggar R, Sitbon O. Hemodynamics in pulmonary arterial hypertension: current and future perspectives. The American journal of cardiology. 2012;110(6 Suppl):S9–S15. doi: 10.1016/j.amjcard.2012.06.011. [DOI] [PubMed] [Google Scholar]
- 28.Sosland RP, Gupta K. Images in cardiovascular medicine: McConnell’s Sign. Circulation. 2008;118(15):e517–518. doi: 10.1161/CIRCULATIONAHA.107.746602. [DOI] [PubMed] [Google Scholar]
- 29.Benza RL, Miller DP, Gomberg-Maitland M, et al. Predicting survival in pulmonary arterial hypertension: insights from the Registry to Evaluate Early and Long-Term Pulmonary Arterial Hypertension Disease Management (REVEAL) Circulation. 2010;122(2):164–172. doi: 10.1161/CIRCULATIONAHA.109.898122. [DOI] [PubMed] [Google Scholar]
- 30.Cho EJ, Jiamsripong P, Calleja AM, et al. Right ventricular free wall circumferential strain reflects graded elevation in acute right ventricular afterload. American journal of physiology Heart and circulatory physiology. 2009;296(2):H413–420. doi: 10.1152/ajpheart.00923.2008. [DOI] [PubMed] [Google Scholar]
- 31.Kuriyama K, Gamsu G, Stern RG, Cann CE, Herfkens RJ, Brundage BH. CT-determined pulmonary artery diameters in predicting pulmonary hypertension. Investigative radiology. 1984;19(1):16–22. doi: 10.1097/00004424-198401000-00005. [DOI] [PubMed] [Google Scholar]
- 32.Frank H, Globits S, Glogar D, Neuhold A, Kneussl M, Mlczoch J. Detection and quantification of pulmonary artery hypertension with MR imaging: results in 23 patients. AJR American journal of roentgenology. 1993;161(1):27–31. doi: 10.2214/ajr.161.1.8517315. [DOI] [PubMed] [Google Scholar]
- 33.Murray TI, Boxt LM, Katz J, Reagan K, Barst RJ. Estimation of pulmonary artery pressure in patients with primary pulmonary hypertension by quantitative analysis of magnetic resonance images. Journal of thoracic imaging. 1994;9(3):198–204. doi: 10.1097/00005382-199422000-00016. [DOI] [PubMed] [Google Scholar]
- 34.Edwards PD, Bull RK, Coulden R. CT measurement of main pulmonary artery diameter. The British journal of radiology. 1998;71(850):1018–1020. doi: 10.1259/bjr.71.850.10211060. [DOI] [PubMed] [Google Scholar]
- 35.Sanal S, Aronow WS, Ravipati G, Maguire GP, Belkin RN, Lehrman SG. Prediction of moderate or severe pulmonary hypertension by main pulmonary artery diameter and main pulmonary artery diameter/ascending aorta diameter in pulmonary embolism. Cardiology in review. 2006;14(5):213–214. doi: 10.1097/01.crd.0000181619.87084.8b. [DOI] [PubMed] [Google Scholar]
- 36.Beiderlinden M, Kuehl H, Boes T, Peters J. Prevalence of pulmonary hypertension associated with severe acute respiratory distress syndrome: predictive value of computed tomography. Intensive care medicine. 2006;32(6):852–857. doi: 10.1007/s00134-006-0122-9. [DOI] [PubMed] [Google Scholar]
- 37.Zisman DA, Karlamangla AS, Ross DJ, et al. High-resolution chest CT findings do not predict the presence of pulmonary hypertension in advanced idiopathic pulmonary fibrosis. Chest. 2007;132(3):773–779. doi: 10.1378/chest.07-0116. [DOI] [PMC free article] [PubMed] [Google Scholar]
- 38.Ghanem MK, Makhlouf HA, Agmy GR, Imam HM, Fouad DA. Evaluation of recently validated non-invasive formula using basic lung functions as new screening tool for pulmonary hypertension in idiopathic pulmonary fibrosis patients. Annals of thoracic medicine. 2009;4(4):187–196. doi: 10.4103/1817-1737.56013. [DOI] [PMC free article] [PubMed] [Google Scholar]
- 39.Linguraru MG, Pura JA, Van Uitert RL, et al. Segmentation and quantification of pulmonary artery for noninvasive CT assessment of sickle cell secondary pulmonary hypertension. Medical physics. 2010;37(4):1522–1532. doi: 10.1118/1.3355892. [DOI] [PMC free article] [PubMed] [Google Scholar]
- 40.Tan RT, Kuzo R, Goodman LR, Siegel R, Haasler GB, Presberg KW. Utility of CT scan evaluation for predicting pulmonary hypertension in patients with parenchymal lung disease. Medical College of Wisconsin Lung Transplant Group. Chest. 1998;113(5):1250–1256. doi: 10.1378/chest.113.5.1250. [DOI] [PubMed] [Google Scholar]
- 41.Devaraj A, Wells AU, Meister MG, Loebinger MR, Wilson R, Hansell DM. Pulmonary hypertension in patients with bronchiectasis: prognostic significance of CT signs. AJR American journal of roentgenology. 2011;196(6):1300–1304. doi: 10.2214/AJR.10.5221. [DOI] [PubMed] [Google Scholar]
- 42.Frazier AA, Franks TJ, Mohammed TL, Ozbudak IH, Galvin JR. From the Archives of the AFIP: pulmonary veno-occlusive disease and pulmonary capillary hemangiomatosis. Radiographics : a review publication of the Radiological Society of North America, Inc. 2007;27(3):867–882. doi: 10.1148/rg.273065194. [DOI] [PubMed] [Google Scholar]
- 43.McAdams HP, Erasmus J, Crockett R, Mitchell J, Godwin JD, McDermott VG. The hepatopulmonary syndrome: radiologic findings in 10 patients. AJR American journal of roentgenology. 1996;166(6):1379–1385. doi: 10.2214/ajr.166.6.8633451. [DOI] [PubMed] [Google Scholar]
- 44.Porres-Aguilar M, Altamirano JT, Torre-Delgadillo A, Charlton MR, Duarte-Rojo A. Portopulmonary hypertension and hepatopulmonary syndrome: a clinician-oriented overview. European respiratory review : an official journal of the European Respiratory Society. 2012;21(125):223–233. doi: 10.1183/09059180.00007211. [DOI] [PMC free article] [PubMed] [Google Scholar]
- 45.Dartevelle P, Fadel E, Mussot S, et al. Chronic thromboembolic pulmonary hypertension. The European respiratory journal : official journal of the European Society for Clinical Respiratory Physiology. 2004;23(4):637–648. doi: 10.1183/09031936.04.00079704. [DOI] [PubMed] [Google Scholar]
- 46.Willemink MJ, van Es HW, Koobs L, Morshuis WJ, Snijder RJ, van Heesewijk JP. CT evaluation of chronic thromboembolic pulmonary hypertension. Clinical radiology. 2012;67(3):277–285. doi: 10.1016/j.crad.2011.09.012. [DOI] [PubMed] [Google Scholar]
- 47.Rossi A, Attina D, Borgonovi A, et al. Evaluation of mosaic pattern areas in HRCT with Min-IP reconstructions in patients with pulmonary hypertension: could this evaluation replace lung perfusion scintigraphy? European journal of radiology. 2012;81(1):e1–6. doi: 10.1016/j.ejrad.2010.09.032. [DOI] [PubMed] [Google Scholar]
- 48.Haitao S, Ning L, Lijun G, Fei G, Cheng L. Fractal dimension analysis of MDCT images for quantifying the morphological changes of the pulmonary artery tree in patients with pulmonary hypertension. Korean journal of radiology : official journal of the Korean Radiological Society. 2011;12(3):289–296. doi: 10.3348/kjr.2011.12.3.289. [DOI] [PMC free article] [PubMed] [Google Scholar]
- 49.Wells JM, Washko GR, Han MK, et al. Pulmonary arterial enlargement and acute exacerbations of COPD. The New England journal of medicine. 2012;367(10):913–921. doi: 10.1056/NEJMoa1203830. [DOI] [PMC free article] [PubMed] [Google Scholar]
- 50.Lin FY, Devereux RB, Roman MJ, et al. The right sided great vessels by cardiac multidetector computed tomography: normative reference values among healthy adults free of cardiopulmonary disease, hypertension, and obesity. Academic radiology. 2009;16(8):981–987. doi: 10.1016/j.acra.2009.02.013. [DOI] [PubMed] [Google Scholar]
- 51.Devaraj A, Wells AU, Meister MG, Corte TJ, Wort SJ, Hansell DM. Detection of pulmonary hypertension with multidetector CT and echocardiography alone and in combination. Radiology. 2010;254(2):609–616. doi: 10.1148/radiol.09090548. [DOI] [PubMed] [Google Scholar]
- 52.Johnson KM, Fain SB, Schiebler ML, Nagle S. Optimized 3D ultrashort echo time pulmonary MRI. Magnetic resonance in medicine : official journal of the Society of Magnetic Resonance in Medicine/Society of Magnetic Resonance in Medicine. 2012 doi: 10.1002/mrm.24570. [DOI] [PMC free article] [PubMed] [Google Scholar]
- 53.Liu M, Ma ZH, Guo XJ, et al. A septal angle measured on computed tomographic pulmonary angiography can noninvasively estimate pulmonary vascular resistance in patients with chronic thromboembolic pulmonary hypertension. Journal of thoracic imaging. 2012;27(5):325–330. doi: 10.1097/RTI.0b013e3182541142. [DOI] [PubMed] [Google Scholar]
- 54.Mathai SC, Sibley CT, Forfia PR, et al. Tricuspid annular plane systolic excursion is a robust outcome measure in systemic sclerosis-associated pulmonary arterial hypertension. The Journal of rheumatology. 2011;38(11):2410–2418. doi: 10.3899/jrheum.110512. [DOI] [PubMed] [Google Scholar]
- 55.Gan CT, Lankhaar JW, Westerhof N, et al. Noninvasively assessed pulmonary artery stiffness predicts mortality in pulmonary arterial hypertension. Chest. 2007;132(6):1906–1912. doi: 10.1378/chest.07-1246. [DOI] [PubMed] [Google Scholar]
- 56.Bradlow WM, Gibbs JS, Mohiaddin RH. Cardiovascular magnetic resonance in pulmonary hypertension. Journal of cardiovascular magnetic resonance : official journal of the Society for Cardiovascular Magnetic Resonance. 2012;14:6. doi: 10.1186/1532-429X-14-6. [DOI] [PMC free article] [PubMed] [Google Scholar]
- 57.Ley S, Mereles D, Risse F, et al. Quantitative 3D pulmonary MR-perfusion in patients with pulmonary arterial hypertension: correlation with invasive pressure measurements. European journal of radiology. 2007;61(2):251–255. doi: 10.1016/j.ejrad.2006.08.028. [DOI] [PubMed] [Google Scholar]
- 58.Oberholzer K, Romaneehsen B, Kunz P, Kramm T, Thelen M, Kreitner KF. Contrast-enhanced 3D MR angiography of the pulmonary arteries with integrated parallel acquisition technique (iPAT) in patients with chronic-thromboembolic pulmonary hypertension CTEPH -sagittal or coronal acquisition? RoFo : Fortschritte auf dem Gebiete der Rontgenstrahlen und der Nuklearmedizin. 2004;176(4):605–609. doi: 10.1055/s-2004-812998. [DOI] [PubMed] [Google Scholar]
- 59.Ghio S, Gavazzi A, Campana C, et al. Independent and additive prognostic value of right ventricular systolic function and pulmonary artery pressure in patients with chronic heart failure. Journal of the American College of Cardiology. 2001;37(1):183–188. doi: 10.1016/s0735-1097(00)01102-5. [DOI] [PubMed] [Google Scholar]
- 60.Sanz J, Dellegrottaglie S, Kariisa M, et al. Prevalence and correlates of septal delayed contrast enhancement in patients with pulmonary hypertension. The American journal of cardiology. 2007;100(4):731–735. doi: 10.1016/j.amjcard.2007.03.094. [DOI] [PubMed] [Google Scholar]
- 61.Rajaram S, Swift AJ, Capener D, et al. Diagnostic accuracy of contrast-enhanced MR angiography and unenhanced proton MR imaging compared with CT pulmonary angiography in chronic thromboembolic pulmonary hypertension. European radiology. 2012;22(2):310–317. doi: 10.1007/s00330-011-2252-x. [DOI] [PubMed] [Google Scholar]
- 62.Marcus JT, Gan CT, Zwanenburg JJ, et al. Interventricular mechanical asynchrony in pulmonary arterial hypertension: left-to-right delay in peak shortening is related to right ventricular overload and left ventricular underfilling. Journal of the American College of Cardiology. 2008;51(7):750–757. doi: 10.1016/j.jacc.2007.10.041. [DOI] [PubMed] [Google Scholar]
- 63.Debl K, Djavidani B, Buchner S, et al. Quantification of left-to-right shunting in adult congenital heart disease: phase-contrast cine MRI compared with invasive oximetry. The British journal of radiology. 2009;82(977):386–391. doi: 10.1259/bjr/18500608. [DOI] [PubMed] [Google Scholar]
- 64.Sommer G, Bremerich J, Lund G. Magnetic resonance imaging in valvular heart disease: clinical application and current role for patient management. Journal of magnetic resonance imaging : JMRI. 2012;35(6):1241–1252. doi: 10.1002/jmri.23544. [DOI] [PubMed] [Google Scholar]
- 65.Lederlin M, Bauman G, Eichinger M, et al. Functional MRI using Fourier decomposition of lung signal: Reproducibility of ventilation-and perfusion-weighted imaging in healthy volunteers. European journal of radiology. 2013 doi: 10.1016/j.ejrad.2012.12.003. [DOI] [PubMed] [Google Scholar]
- 66.Bauman G, Scholz A, Rivoire J, et al. Lung ventilation-and perfusion-weighted Fourier decomposition magnetic resonance imaging: In vivo validation with hyperpolarized (3) He and dynamic contrast-enhanced MRI. Magnetic resonance in medicine : official journal of the Society of Magnetic Resonance in Medicine/Society of Magnetic Resonance in Medicine. 2013;69(1):229–237. doi: 10.1002/mrm.24236. [DOI] [PubMed] [Google Scholar]
- 67.Kilner PJ, Yang GZ, Mohiaddin RH, Firmin DN, Longmore DB. Helical and retrograde secondary flow patterns in the aortic arch studied by three-directional magnetic resonance velocity mapping. Circulation. 1993;88(5 Pt 1):2235–2247. doi: 10.1161/01.cir.88.5.2235. [DOI] [PubMed] [Google Scholar]
- 68.Kilner PJ, Yang GZ, Wilkes AJ, Mohiaddin RH, Firmin DN, Yacoub MH. Asymmetric redirection of flow through the heart. Nature. 2000;404(6779):759–761. doi: 10.1038/35008075. [DOI] [PubMed] [Google Scholar]
- 69.Markl M, Kilner PJ, Ebbers T. Comprehensive 4D velocity mapping of the heart and great vessels by cardiovascular magnetic resonance. Journal of cardiovascular magnetic resonance : official journal of the Society for Cardiovascular Magnetic Resonance. 2011;13:7. doi: 10.1186/1532-429X-13-7. [DOI] [PMC free article] [PubMed] [Google Scholar]
- 70.Reiter G, Reiter U, Kovacs G, et al. Magnetic resonance-derived 3-dimensional blood flow patterns in the main pulmonary artery as a marker of pulmonary hypertension and a measure of elevated mean pulmonary arterial pressure. Circulation Cardiovascular imaging. 2008;1(1):23–30. doi: 10.1161/CIRCIMAGING.108.780247. [DOI] [PubMed] [Google Scholar]
- 71.Ohno Y, Hatabu H, Murase K, et al. Primary pulmonary hypertension: 3D dynamic perfusion MRI for quantitative analysis of regional pulmonary perfusion. AJR American journal of roentgenology. 2007;188(1):48–56. doi: 10.2214/AJR.05.0135. [DOI] [PubMed] [Google Scholar]
- 72.Meier P, Zierler KL. On the theory of the indicator-dilution method for measurement of blood flow and volume. Journal of applied physiology. 1954;6(12):731–744. doi: 10.1152/jappl.1954.6.12.731. [DOI] [PubMed] [Google Scholar]
- 73.Ohno Y, Murase K, Higashino T, et al. Assessment of bolus injection protocol with appropriate concentration for quantitative assessment of pulmonary perfusion by dynamic contrast-enhanced MR imaging. Journal of magnetic resonance imaging : JMRI. 2007;25(1):55–65. doi: 10.1002/jmri.20790. [DOI] [PubMed] [Google Scholar]
- 74.Risse F, Semmler W, Kauczor HU, Fink C. Dual-bolus approach to quantitative measurement of pulmonary perfusion by contrast-enhanced MRI. Journal of magnetic resonance imaging : JMRI. 2006;24(6):1284–1290. doi: 10.1002/jmri.20747. [DOI] [PubMed] [Google Scholar]
- 75.Oldendorf WH, Kitano M, Shimizu S, Oldendorf SZ. Hematocrit of the human cranial blood pool. Circulation research. 1965;17(6):532–539. doi: 10.1161/01.res.17.6.532. [DOI] [PubMed] [Google Scholar]
- 76.Frank O. The basic shape of the arterial pulse. First treatise: mathematical analysis 1899. Journal of molecular and cellular cardiology. 1990;22(3):255–277. doi: 10.1016/0022-2828(90)91460-o. [DOI] [PubMed] [Google Scholar]
- 77.Westerhof N, Lankhaar JW, Westerhof BE. The arterial Windkessel. Medical & biological engineering & computing. 2009;47(2):131–141. doi: 10.1007/s11517-008-0359-2. [DOI] [PubMed] [Google Scholar]
- 78.Westerhof N, Elzinga, Sipkema P. An artificial arterial system for pumping hearts. Journal of applied physiology. 1971;31(5):776–781. doi: 10.1152/jappl.1971.31.5.776. [DOI] [PubMed] [Google Scholar]
- 79.Bellofiore A, Roldan-Alzate A, Besse M, et al. Impact of Acute Pulmonary Embolization on Arterial Stiffening and Right Ventricular Function in Dogs. Annals of biomedical engineering. 2012 doi: 10.1007/s10439-012-0635-z. [DOI] [PMC free article] [PubMed] [Google Scholar]
- 80.Stevens GR, Garcia-Alvarez A, Sahni S, Garcia MJ, Fuster V, Sanz J. RV dysfunction in pulmonary hypertension is independently related to pulmonary artery stiffness. JACC Cardiovascular imaging. 2012;5(4):378–387. doi: 10.1016/j.jcmg.2011.11.020. [DOI] [PubMed] [Google Scholar]


