Abstract
Computational models of excitation-contraction (EC) coupling in myocytes are valuable tools for studying the signaling cascade that transduces transmembrane voltage into mechanical responses. A key component of these models is the appropriate description of structures involved in EC coupling, such as the sarcolemma and ion channels. This study aims at developing an approach for spatial reconstruction of these structures. We exemplified our approach by reconstructing clusters of ryanodine receptors (RyRs) together with the sarcolemma of rabbit ventricular myocytes. The reconstructions were based on dual labeling and three-dimensional (3D) confocal imaging of segments of fixed and permeabilized myocytes lying flat or on end. The imaging led to 3D stacks of cross-sections through myocytes. Methods of digital image processing were applied to deconvolve, filter and segment these stacks. Finally, we created point meshes representing RyR distributions together with volume and surface meshes of the sarcolemma. We suggest that these meshes are suitable for computational studies of structure-function relationships in EC coupling. We propose that this approach can be extended to reconstruct other structures and proteins involved in EC coupling.
1. Introduction
Excitation-contraction (EC) coupling in myocytes involves a complex signaling cascade that transduces transmembrane voltage into cell contraction. In cardiac myocytes, most stages of this cascade involve calcium signaling3. The initial stimulus is membrane depolarization, which activates voltage-gated L-type calcium channels (LCCs) and allows for flux of extracellular calcium into the cell interior. This calcium activates sarcoplasmic calcium channels, the ryanodine receptors (RyRs), allowing release of calcium from an intracellular calcium store, the sarcoplasmic reticulum (SR)10. Both, calcium influx via LCCs and calcium induced calcium release (CICR), raise the cytosolic concentration of calcium. Subsequently, binding of cytosolic calcium to troponin C causes shifting of the troponin-tropomyosin complex followed by structural changes of the tropomyosin-actin configuration. Finally, these changes enable molecular interactions of actin and myosin causing cell contraction.
Electrophysiological measurements, functional and structural imaging, as well as computational modeling have been the major methods to characterize EC coupling. Several modeling approaches have been developed to describe calcium signaling underlying EC coupling. The approaches differ in the number of compartments considered, and the description of the cell anatomy and the properties of ion channels. In general in these approaches, simplified models of cell anatomy and protein distributions are applied due to difficulties to create accurate three-dimensional (3D) reconstructions from imaging data. In particular, physical limitations of imaging systems complicate the reconstruction. The limitations include small signal-to-noise ratio, resolution limits, image blurring and small contrasts between objects of interest and background. However, recent advances in imaging, protein labeling and methods for digital image processing promise to mitigate these difficulties.
In this study, we addressed the development of realistic anatomical models of ventricular myocytes for application in computational studies of EC coupling. Our focus was on describing spatial distributions of RyR clusters and the geometry of the sarcolemma including the transverse tubular system (t-system). The modeling of RyR clusters and sarcolemma was based on dual labeling with Alexa dyes and 3D scanning confocal imaging. RyRs were labeled with antibodies linked to Alexa 488. The sarcolemma associated glycocalix was labeled with wheat germ agglutinin (WGA) conjugated to Alexa 555. We imaged segments of cells lying flat on a cover slip or on end to take advantage of anisotropic optical properties of confocal microscopy.
Confocal imaging has several limitations, in particular anisotropic convolution and depth-dependent signal attenuation. We accounted for these limitations with 3D deconvolution and attenuation correction. Deconvolution was carried out with the Richardson-Lucy algorithm using measured point spread functions (PSFs), which characterize the optical properties of our confocal microscopic imaging system. We applied various methods of image processing to identify the intracellular space and the RyR cluster distribution. The resulting reconstructions were transformed into volume, surface and point meshes which provide a spatial domain for computational studies of EC coupling at sub-cellular level.
2. Methods
2.1. Overview
An overview of our approach for modeling of RyR cluster distribution and the sarcolemma is shown in Fig. 1. After isolation, labeling and imaging of myocytes, the image data were processed with various methods of digital image processing for background removal, correction of depth-dependent attenuation, and image deconvolution. Image processing methods were also applied to identify the sarcolemma in the WGA images and segment clusters in the RyR images. The image data were combined and represented with volume and surface meshes for application in computational simulations of EC coupling.
Figure 1.
Processing pipeline for reconstruction of RyR cluster distributions and the sarcolemma of cardiac myocytes based on dual labeling and confocal microscopy.
2.2. Isolation, Labeling and Imaging of Cardiomyocytes
Rabbit ventricular myocytes were obtained according to a previously described procedure9. Cells were fixed with 2% para formaldehyde and labeled with WGA conjugated to Alexa 55522. Afterwards, cells were permeabilized and RyRs were labeled with a primary antibody and a secondary antibody attached to Alexa 488. This procedure has been described previously in detail9.
A Zeiss LSM 5 confocal microscope (Carl Zeiss, Jena, Germany) together with a 60× oil immersion objective lens (Numerical aperture: 1.4) was used for imaging. It resulted in 3D image stacks consisting of cubic voxels of size 100 nm × 100 nm × 200 nm, respectively. The data volume of each of the stacks was 25 million voxels.
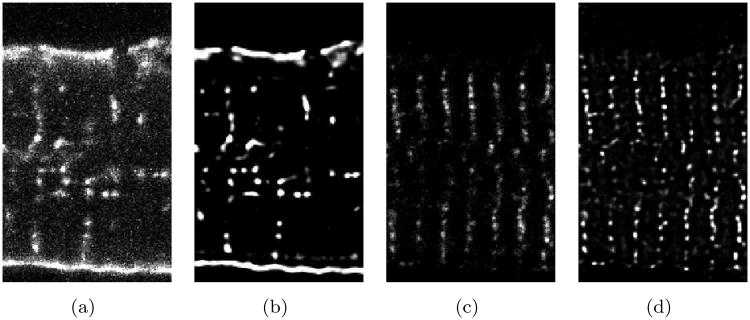
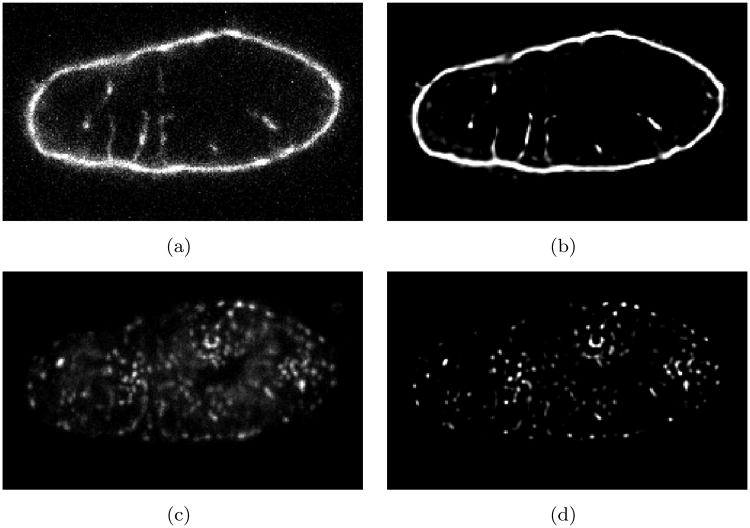
The imaging of the WGA and RyR signals was performed on myocytes lying flat on the cover slip (Fig. 2). In addition, we imaged cells tilted on end (Fig. 3) using a recently developed transverse sectioning approach8. In short, the approach consisted of embedding cells in agar for mechanical stabilization and selection of vertically oriented cells for imaging.
Figure 2.
Exemplary image of segment of ventricular myocyte lying flat on the cover slip. The imaging was performed in a hexahedral region with a size of 50 μm × 30 μm × 10 μm. The image stack was stored in a lattice of 248 × 150 × 51 cubic voxels. Raw intensity distributions for (a) WGA and (c) RyR labeling are shown in the central XY plane. Intensity distributions after background removal, attenuation correction and deconvolution are depicted in (b) and (c) for WGA and RyR labeling, respectively.
Figure 3.
Exemplary image of segment of ventricular myocyte tilted on end embedded in agar. The imaging was performed in a hexahedral region with a size of 26 μm × 42 μm × 21 μm. The image stack was stored in a lattice of 128 × 212 × 107 cubic voxels. Raw intensity distributions for (a) WGA and (c) RyR labeling are shown in the central XY plane. Intensity distributions after background removal, attenuation correction and deconvolution are depicted in (b) and (d) for WGA and RyR labeling, respectively.
2.3. Image Pre-Processing
Our approaches for correction of depth-dependent signal intensity attenuation and deconvolution have been detailed in our previous work 21,22. Briefly, a scaling factor was calculated characterizing depth-dependent attenuation for each image slice. The factor was used for slice-wise correction. The iterative Richardson-Lucy algorithm19 was applied with PSFs extracted from images of fluorescent beads of 100 nm in diameter residing in the first 10 μm above the cover slip.
Removal of background signal was carried out for all WGA and RyR images before deconvolution. For each image we detected the background level in regions outside the cell and without debris. The background level varied between image stacks, but was not dependent on depth. We subtracted the detected background level in each image stack.
2.4. Processing of WGA Images
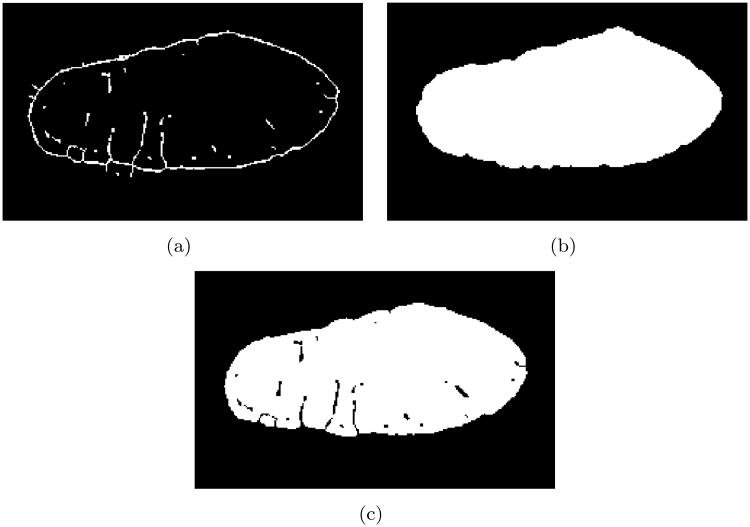
WGA stained the glycocalix associated with the sarcolemma. Thus, WGA images served for identification of the sarcolemma. We applied a 3D thinning operator17 on the deconvolved image stacks (Fig. 4a). Minor holes in the resulting skeletons were closed either automatically1 or by manual editing of the image data. We created a mask image by using the region-growing technique20 in the skeletons images (Fig. 4b). The mask image contained the intracellular space and the t-system. Subsequently, the mask was applied with thresholded WGA images to create extracellular and intracellular segments (Fig. 4c), whose borders were identified with the sarcolemma.
Figure 4.
Segmentation of WGA images stacks. (a) A 3D thinning operator created skeletons of deconvolved images. The skeletons exhibited holes in the outer sarcolemma, which were closed before further processing. (b) Region-growing produced a mask image stack containing intracellular space and t-system. (c) The mask image stack was combined with a thresholded segmentation of the WGA image stack.
2.5. Processing of RyR Images
Processing of RyR images consisted of segmentation of RyR clusters and their statistical analysis from the deconvolved RyR image stacks. The clusters were segmented with the region-growing technique. Seed points for region growing were determined by thresholding and maxima detection. We derived centers of mass and summary intensities of RyR clusters from the segments.
3. Results
3.1. Reconstruction of Sarcolemma and RyR Cluster Distribution
We applied these methods to reconstruct 3 horizontal and 3 vertical cells. The cells were from the left ventricle of rabbit hearts and selected from an image library of 48 cells. Only cell segments in proximity to the cover slip were processed. Processing of cell segments in regions distal (¿20mum) to the cover slip was hindered by low signal to noise ratio.
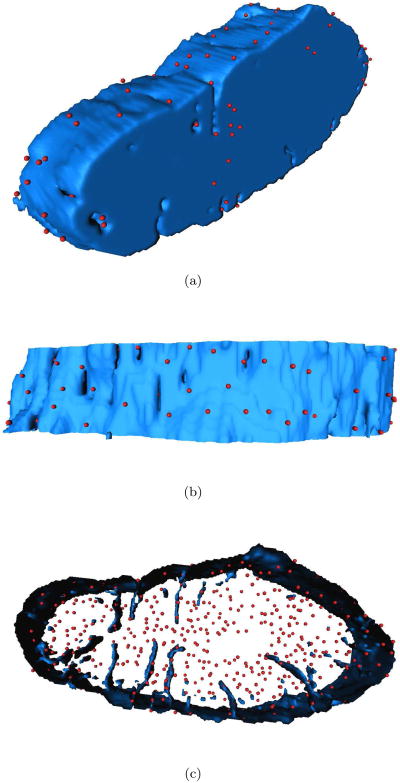
Statistical information on the spatial distribution of RyR clusters is shown in Tab. 1. The mean nearest neighbor distance of RyR cluster is 0.91 μm. An example of our reconstruction of a vertical ventricular myocyte is shown in Fig. 5. The image dataset includes 128 × 212 × 20 voxels and describes a volume of 12.8 μm × 21.2 μm × 40 μm. This visualization shows RyR cluster associated with the outer sarcolemma and the t-system. The majority of clusters was not associated with the sarcolemma (Fig. 5c).
Table 1.
Mean and standard deviation of nearest neighbor distance of RyR clusters in rabbit ventricular myocytes. The distances were calculated from segments of 3 horizontal and 3 vertical cells.
| horizontal | distance (mean±stddev) | vertical | distance (mean±stddev) |
|---|---|---|---|
|
| |||
| #1 | 0.88±0.23 μm | #1 | 0.88±0.31 μm |
| #2 | 0.90±0.24 μm | #2 | 0.92±0.27 μm |
| #3 | 0.91±0.25 μm | #3 | 0.97±0.29 μm |
Figure 5.
3D visualization of cell fragment from different perspectives. (a) The mycoyte interior is shown in blue and RyR clusters are in red. (b) A number of RyR clusters was located in the outer sarcolemma. (c) The majority of RyR clusters was found in the cell interior.
3.2. Generation of Meshes for Computational Simulations
All processing was performed with data stored in 3D lattices. The data was converted to other formats with regard to application in computational simulations. In particular, software allowed for automated generation of cubic voxel meshes of various spatial resolution. Application of a modified marching-cube algorithm on these meshes facilitated the creation of surface meshes15. The algorithm generated meshes of triangular elements approximating iso-intensity surfaces with sub-voxel resolution in the 3D image stacks. This approach was used for the visualizations shown in Fig. 5. Modifications of the original algorithm assured closeness of the generated surfaces and permitted sub-voxel resolution by adjusting positions of mesh nodes based on edge-wise interpolation of intensities12.
The distribution of RyR clusters was represented with a point set. Each point is annotated with the cluster size, second order moments of the cluster, and its distance to the sarcolemma.
4. Discussion and Conclusions
In the present study, we introduced a new approach to reconstruct distributions of RyR clusters and the sarcolemma of cardiac myocytes. The study extends our previous work on modeling of the sarcolemma based on confocal imaging of isolated living myocytes superfused with membrane impermeant dextran conjugated to fluorescein21. Our previous work allowed us to create volume meshes of myocytes and surface meshes of sarcolemma suitable for computational simulations. In both studies, our focus on modeling the sarcolemma was motivated by its central role as a border between the intra-and extracellular environment as well as for cell signaling. Modeling of the sarcolemma is significant because it comprises various proteins for cellular signaling such as electrical signaling and for EC coupling.
The present study describes methods to extract 3D reconstructions of the sarcolemma from images of WGA labeled myocytes. WGA has been used in previous studies for identification of the cell membrane4. In a previous study, we showed that dextran and WGA signals were correlated in the t-system and are therefore equally good markers22. In this and the present study, WGA labeling allowed us to create detailed descriptions of the t-system. More importantly, WGA labeling can be applied in combination with immuno-labeling of proteins, such as RyRs. Thus, the present approach allows modeling of the membrane together with proteins. An alternative approach would be to apply published information on protein density distributions. However, it appears difficult to evaluate the reliability and accuracy of this alternative approach.
Our estimate of nearest neighbor distance (0.91 μm) of RyR clusters in rabbit was higher than those previously reported for rat (0.66 μm) and human (0.78 μm)27. These differences might be significant to gain insights in species-specific phenomena of EC coupling.
The presented approach led to computational meshes with applications in modeling of EC coupling in myocytes. Effects of changes in components involved in EC coupling are difficult to assess at cellular and sub-cellular level with traditional experimental and analytical approaches. Computational studies based on realistic models of cell anatomy might give insights in these effects and thus complement the traditional approaches. Modeling of EC coupling is a very active field of research and various sorts of models have been developed, for instance common pool and local control models.
Common pool modeling use a cytosolic reservoir acting as source or sink for all sarcolemmal and sarcoplasmic calcium fluxes. The cytosolic calcium controls RyR gating. Local control models are based on an additional compartment representing a small cleft space (diad) between sarcolemma and junctional SR membrane29. The cleft space is sink for calcium fluxes through LCCs and RyRs. The calcium concentration in the cleft space controls RyR gating. The cleft space is connected to the cytosolic compartment. Several studies with local control models focused on description of calcium transients in the cleft space14,7,25. We suggest that our cell models provide insights into the validity of EC coupling models and support a hybrid of the two EC coupling models to describe ventricular myocytes.
Our methodology for reconstruction of the sarcolemma including the t-system is related to previously published approaches with rat ventricular cardiac myocytes based on confocal microscopy26 and myocytes from guinea pig papillary muscle based on thin section electron microscopy2. In our studies, we profited from the largeness and low complexity of rabbit versus rat t-system. T-tubule diameter in rabbit ventricular cells was in 400±172 nm22, which is above the resolution of the confocal imaging system.
Our methodology for reconstructing the sarcolemma together with RyR cluster distributions is new. Related approaches for dual labeling of RyRs and other proteins have been described previously for α-actinin27, calsequestrin23, sodium calcium exchangers23, sodium channels23, and L-type calcium channels24,23,6. Extending our dual labeling approach for labeling of the sarcolemma together with other proteins is straight forward. Of particular interest for modeling of EC coupling is information on the distribution of L-type calcium channels and their relationship to RyRs.
The presented approach can also be applied for modeling cells during development and aging as well as affected by cardiac diseases. Changes of the t-system and RyR cluster distributions have been described for diseased human30,13 and animal ventricular myocytes18,11,16,28.
Limitations
We and others have discussed physical limitations of confocal imaging studies and ambiguity of image processing in previous publications5,22. A major limitation is spatial resolution of confocal imaging. The resolution can be specified by e.g. the Rayleigh criterion and estimated from measured PSFs. From our measurements22 we expect that t-tubules and clusters can be separated having a distance larger than 0.83 and 0.28 μm in laser beam direction and transversal to it, respectively.
Our approach necessitated myocyte isolation, fixation and membrane perforation. These procedures affect cell anatomy. We found insignificant myocyte distortion caused by fixation and perforation (data not shown).
References
- 1.Aktouf Z, Bertrand G, Perroton L. A 3D-hole closing algorithm. Proc 6th Int Workshop Discrete Geom Comp Imag. 1996:36–47. [Google Scholar]
- 2.Amsellem J, Delorme R, Souchier C, Ojeda C. Transverse-axial tubular system in guinea pig ventricular cardiomyocyte: 3D reconstruction, quantification and its possible role in K+ accumulation-depletion phenomenon in single cells. Biol Cell. 1995;85:43–54. [PubMed] [Google Scholar]
- 3.Bers DM. Excitation-Contraction Coupling and Cardiac Contractile Force. Kluwer Academic Publishers; Dordrecht, Netherlands: 1991. [Google Scholar]
- 4.Bhavanandan VP, Katlic AW. The interaction of wheat germ agglutinin with sialoglycoproteins. The role of sialic acid. J Biol Chem. 1979;254(10):4000–8. [PubMed] [Google Scholar]
- 5.Bolte S, Cordelieres FP. A guided tour into subcellular localization analysis in light microscopy. J Microsc. 2006;224(3):213–32. doi: 10.1111/j.1365-2818.2006.01706.x. [DOI] [PubMed] [Google Scholar]
- 6.Bootman MD, Higazi DR, Coombes S, Llewelyn Roderick H. Calcium signalling during excitation-contraction coupling in mammalian atrial myocytes. J Cell Sci. 2006;119(19):3915–25. doi: 10.1242/jcs.03223. [DOI] [PubMed] [Google Scholar]
- 7.Cannell MB, Soeller C. Numerical analysis of ryanodine receptor activation by l-type channel activity in the cardiac muscle diad. Biophys J. 1997;73:112–22. doi: 10.1016/S0006-3495(97)78052-4. [DOI] [PMC free article] [PubMed] [Google Scholar]
- 8.Chen-Isu Y, McCulle SL, Ward CW, Soeller C, Allen BM, Rabang C, Cannell MB, Balke CW, Izu LT. Three-dimensional distribution of ryanodine receptor clusters in cardiac myocytes. Biophys J. 2006;91(1):1–13. doi: 10.1529/biophysj.105.077180. [DOI] [PMC free article] [PubMed] [Google Scholar]
- 9.Cordeiro JM, Spitzer KW, Giles WR, Ershler PE, Cannell MB, Bridge JH. Location of the initiation site of calcium transients and sparks in rabbit heart Purkinje cells. J Physiol. 2001;531(Pt 2):H1471–9. doi: 10.1111/j.1469-7793.2001.0301i.x. [DOI] [PMC free article] [PubMed] [Google Scholar]
- 10.Fabiato A, Fabiato F. Contractions induced by a calcium-triggered release of calcium for the sarcoplasmic reticulum of single skinned cardiac cells. J Physiol. 1975;249:469–95. doi: 10.1113/jphysiol.1975.sp011026. [DOI] [PMC free article] [PubMed] [Google Scholar]
- 11.He J, Conklin MW, Foell JD, Wolff MR, Haworth RA, Coron-ado R, Kamp TJ. Reduction in density of transverse tubules and L-type Ca(2+) channels in canine tachycardia-induced heart failure. Cardiovasc Res. 2001;49(2):298–307. doi: 10.1016/s0008-6363(00)00256-x. [DOI] [PubMed] [Google Scholar]
- 12.Heiden W, Goetze T, Brickmann J. ‘Marching-Cube‘-Algorithmen zur schnellen Generierung von Isoflächen auf der Basis dreidimensionaler Daten-felder. In: Frühauf M, Göbel Martina, editors. Visualisierung von Volumendaten. Springer; Berlin, Heidelberg, New York: 1991. pp. 112–7. [Google Scholar]
- 13.Kaprielian RR, Stevenson S, Rothery SM, Cullen MJ, Severs NJ. Distinct patterns of dystrophin organization in myocyte sarcolemma and transverse tubules of normal and diseased myocardium. Circulation. 2000;101:2586–94. doi: 10.1161/01.cir.101.22.2586. [DOI] [PubMed] [Google Scholar]
- 14.Langer GA, Peskoff A. Calcium concentration and movement in the diadic cleft space of the cardiac ventricular cells. Biophys J. 1996;70:1169–82. doi: 10.1016/S0006-3495(96)79677-7. [DOI] [PMC free article] [PubMed] [Google Scholar]
- 15.Lorensen WE, Cline HE. Marching cubes: A high resolution 3D surface construction algorithm. Computer Graphics. 1987;21(4):163–9. [Google Scholar]
- 16.Louch WE, Mork HK, Sexton J, Stromme TA, Laake P, Sjaastad I, Kamp TJ. T-tubule disorganization and reduced synchrony of Ca2+ release in murine cardiomytes following myocardial infarction. J Physiol. 2006;574:301–23. doi: 10.1113/jphysiol.2006.107227. [DOI] [PMC free article] [PubMed] [Google Scholar]
- 17.Manzanera A, Bernard TM, Preteux F, Longuet B. Medial faces from a concise 3D thinning algorithm. Proc IEEE Conf Computer Vision. 1999:337–43. [Google Scholar]
- 18.Page E, McCallister LP. Quantitative electron microscopic description of heart muscle cells. applications to normal, hypertrophied and thyroxin-stimulated hearts. Am J Cardiol. 1973;31(31):172–81. doi: 10.1016/0002-9149(73)91030-8. [DOI] [PubMed] [Google Scholar]
- 19.Richardson WH. Bayesian-based iterative method of image restoration. J Opt Soc Am. 1972;62:55–9. [Google Scholar]
- 20.Sachse FB. Computational Cardiology: Modeling of Anatomy, Electrophysiology, and Mechanics. Vol. 2966. Springer; Heidelberg: 2004. of Lecture Notes in Computer Science. [Google Scholar]
- 21.Sachse FB, Savio-Galimberti E, Goldhaber JI, Bridge JHB. Sub-micrometer anatomical models of the sarcolemma of cardiac myocytes based on confocal imaging. Pac Symp Biocomp. 2008;13:390–401. [PubMed] [Google Scholar]
- 22.Savio-Galimberti E, Frank J, Inoue M, Goldhaber JI, Cannell MB, Bridge JHB, Sachse FB. Novel features of the rabbit transverse tubular system revealed by quantitative analysis of three-dimensional reconstructions from confocal images. Biophys J. 2008;95:2053–62. doi: 10.1529/biophysj.108.130617. [DOI] [PMC free article] [PubMed] [Google Scholar]
- 23.Scriven DRL, Dan P, Moore EW. Distribution of proteins implicated in excitation-contraction coupling in rat ventricular myocytes. Biophys J. 2000;79:2682–91. doi: 10.1016/S0006-3495(00)76506-4. [DOI] [PMC free article] [PubMed] [Google Scholar]
- 24.Sedarat F, Xu L, Moore EW, Tibbits GF. Colocalization of dihy-dropyridine and ryanodine receptors in neonate rabbit heart using confocal microscopy. Am J Physiol Heart Circ Physiol. 2000;279:H202–9. doi: 10.1152/ajpheart.2000.279.1.H202. [DOI] [PubMed] [Google Scholar]
- 25.Soeller C, Cannell MB. Numerical simulation of local calcium movements during l-type calcium channel gating in the cardiac diad. Biophys J. 1997;73:97–111. doi: 10.1016/S0006-3495(97)78051-2. [DOI] [PMC free article] [PubMed] [Google Scholar]
- 26.Soeller C, Cannell MB. Examination of the transverse tubular system in living cardiac rat myocytes by 2-photon microscopy and digital image-processing techniques. Circ Res. 1999;84:266–75. doi: 10.1161/01.res.84.3.266. [DOI] [PubMed] [Google Scholar]
- 27.Soeller C, Crossman D, Gilbert R, Cannell MB. Analysis of ryanodine receptor clusters in rat and human cardiac myocytes. Proc Natl Acad Sci USA. 2007;104(38):14958–63. doi: 10.1073/pnas.0703016104. [DOI] [PMC free article] [PubMed] [Google Scholar]
- 28.Song LS, Sobie EA, McCulle S, Lederer WJ, Balke CW, Cheng H. Orphaned ryanodine receptors in the failing heart. Proc Natl Acad Sci USA. 2006;103:4305–10. doi: 10.1073/pnas.0509324103. [DOI] [PMC free article] [PubMed] [Google Scholar]
- 29.Stern MD. Theory of excitation-contraction coupling in cardiac muscle. Biophys J. 1997;63:497–517. doi: 10.1016/S0006-3495(92)81615-6. [DOI] [PMC free article] [PubMed] [Google Scholar]
- 30.Wong C, Soeller C, Burton L, Cannell MB. Changes in transverse-tubular system architecture in myocytes from diseased human ventricles. Biophys J (Annual Meeting Abstracts) 2002;82:a588. [Google Scholar]


