

Abstract
Methamphetamine (METH) is a widely abused amphetamine analog. Few studies have investigated the molecular effects of METH exposure in adult animals. Herein, we determined the consequences of an injection of METH (10 mg/kg) on transcriptional effects of a second METH (2.5 mg/kg) injection given one month later. We thus measured gene expression by microarray analyses in the nucleus accumbens (NAc) of 4 groups of rats euthanized 2 hours after the second injection: saline-pretreated followed by saline-challenged (SS) or METH-challenged (SM); and METH-pretreated followed by saline-challenged (MS) or METH-challenged (MM). Microarray analyses revealed that METH (2.5 mg/kg) produced acute changes (1.8-fold; P<0.01) in the expression of 412 (352 upregulated, 60 down-regulated) transcripts including cocaine and amphetamine regulated transcript, corticotropin-releasing hormone (Crh), oxytocin (Oxt), and vasopressin (Avp) that were upregulated. Injection of METH (10 mg/kg) altered the expression of 503 (338 upregulated, 165 down-regulated) transcripts measured one month later (MS group). These genes also included Cart and Crh. The MM group showed altered expression of 766 (565 upregulated, 201 down-regulated) transcripts including Avp, Cart, and Crh. The METH-induced increased Crh expression was enhanced in the MM group in comparison to SM and MS groups. Quantitative PCR confirmed the METH-induced changes in mRNA levels. Therefore, a single injection of METH produced long-lasting changes in gene expression in the rodent NAc. The long-term increases in Crh, Cart, and Avp mRNA expression suggest that METH exposure produced prolonged activation of the endogenous stress system. The METH-induced changes in oxytocin expression also suggest the possibility that this neuropeptide might play a significant role in the neuroplastic and affiliative effects of this drug.
Introduction
Methamphetamine (METH) is an indirect agonist that induces the release of dopamine (DA) in brain regions that receive projections from the substantia nigra pars compacta and the ventral tegmental area [1]–[3]. These brain regions include the nucleus accumbens and the dorsal striatum. METH administration also influences striatal gene expression in animals with normal dopaminergic innervation [4]–[6]. The METH-induced transcriptional changes in the dorsal striatum include increases in the expression of various immediate early genes (IEGs) including c-fos and Egr families of transcription factors, neuropeptides including neurotensin, and genes that participate in either toxic or protective cascades such as heat shock proteins and genes involved in endoplasmic reticulum stress, depending on the doses of METH used [5]–[9]. We have shown, in addition, that some of these changes can be attenuated by DA receptor antagonism [6]–[8] or repeated METH injections [5]. Nevertheless, these studies had only included very short-term biochemical or transcriptional effects of the drug and focused mainly on the dorsal striatum. Moreover, although the acute changes in METH-induced gene expression [7] and the toxic effects of the drug [6], [8], [10] have been extensively investigated in the dorsal striatum, very few papers have reported on the potential long-term behavioral and/or biochemical effects of a single injection of moderate doses of the drug. For example, Xi et al. [3] have shown that a single METH (10 or 20 mg/kg) injection can increase cocaine self-administration measured several days after the METH injection, thus documenting long-term behavioral effects of the drug. They showed that these METH doses also impacted the biochemical effects of cocaine in the nucleus accumbens [3]. More recently, Martin et al. [11] investigated the biochemical and molecular effects of a single METH (20 mg/kg) injection and identified substantial time-dependent changes in gene expression, histone acetylation, and expression of histone deacetylases (HDACs) in the NAc. We are, however, not aware of any study that has investigated the molecular effects of re-exposing rats to METH after a long period of abstinence following the injection of a single moderate but nonlethal dose of the drug. Moreover, to our knowledge, there is no study of the long-term effects of single or multiple exposures to the drug on global gene expression in the rat NAc, given the importance of that structure in reward mechanisms [12], [13].
Repeated injections of psychostimulant are the most often used model to examine the long-term effects of these drugs [14]. These studies have reported substantial activation of the mesolimbic dopaminergic projections [15]. However, there is evidence that even a single dose exposure can cause long-term alterations in dopaminergic systems, neuroendocrine, and physiological effects in rodents [16]–[19]. Specifically, Peris and Zahniser [17] showed that a single injection of cocaine caused potentiation of amphetamine-induced DA release from rat striatal slices. In rats, a single prior cocaine injection augmented a second cocaine injection-induced striatal DA release measured one week later [16]. Vanderschuren et al. [19] showed that the injection of a larger dose of amphetamine (5 mg/kg) injection also potentiated the biochemical effects of the injection of a second smaller dose of amphetamine (1 mg/kg) given 3 weeks later. Thus, when taken together with the behavioral and biochemical effects reported after a single METH pre-exposure [3], the possibility existed that a single METH injection might cause long-term biochemical and molecular changes in the rat NAc. We also tested the idea that such a moderate dose of METH might potentiate the molecular effects of the injection of a second lower dose of the drug in a fashion previously reported after a similar pattern of amphetamine injections [19]. In order to address these questions further, we used a two-dose METH exposure paradigm similar to that used by Vanderschuren et al. [19] to measure the effects of METH on gene expression in the NAc by using both microarray and quantitative PCR analyses. Thus, the purpose of the present paper was three fold. First, we sought to determine the acute effects of a single METH dose (2.5 mg/kg) on global gene expression in the NAc. We have previously shown that similar doses of METH can cause substantial changes in gene expression in the dorsal striatum [4], [20] but, to our knowledge, there are no similar data on the effects of similar doses of METH on global gene expression in the NAc. The second purpose of the study was to investigate the long-term effects of a moderate METH dose (10 mg/kg) in that brain structure. The studies that have investigated the effects of larger doses of METH (20–40 mg/kg) have reported on relatively short-term transcriptional effects of the drug on the cortex [6], [9], [21]. This issue is also important because we have shown that a single moderate dose of the drug can have long-term behavioral and biochemical effects [3], [22], results that suggest the possibility of long-lasting transcriptional effects of the drug. The third aim of the paper was to test if the single moderate dose of the drug could influence the transcriptional effects of a lower dose of the drug given one month later. We and others have reported that repeated injections of METH can attenuate the IEG [5], [20], toxic [23], and biochemical [24] responses to either smaller or larger doses given within a few hours after the end of the repeated METH injections. Frankel et al. [25] had also reported that a prior injection of a larger METH dose caused a potentiated locomotor response to a lower dose of the drug. Taken together, the literature suggests prior exposure to METH can influence subsequent exposure to a lower dose of the drug. However, we are not aware of any studies that have measured acute METH-induced changes in gene expression in the NAc after a long delay from an initial METH exposure. The present study was meant, in part, to fill that gap. These types of studies might be relevant to the effects of the drug on the brains of patients who go back to using drugs after long periods of abstinence.
In addition to measuring global gene expression, we used Ingenuity Pathway Analysis (IPA) to identify networks and canonical pathways that might be perturbed after injections of the drug. Our study reveals that a moderate dose of METH (10 mg/kg) can cause long-lasting changes in the mRNA expression of several neuropeptides including CRF, CART, AVP, and OXT in the NAc. Moreover, we showed that a prior exposure to METH (10 mg/kg) significantly influenced the acute transcriptional effects of a second delayed smaller dose of the drug (2.5 mg/kg) injection. These results are discussed in view of their support for the potential involvement of these neuropeptides in the psychostimulant-induced molecular neuroadaptations in the NAc.
Results
Monoamine levels in the NAc
In order to investigate the effects of METH pretreatment, we performed HPLC analyses in four experimental groups: saline-pretreated and saline-challenged (SS) (n = 4); saline-pretreated and METH-challenged (SM) (n = 8); METH-pretreated and saline-challenged (MS) (n = 9); and METH-pretreated and METH-challenged (MM) (n = 9). Table 1 shows the effects of METH on monoamine levels in the NAc of these rats. There were no significant differences in DA and 3, 4-dihydroxyphenylacetic acid (DOPAC) between the SS and MS groups. There were non-significant increases (+63%, P = 0.076) in homovanillic acid (HVA) levels in the MS in comparison to the SS group. The acute METH injection caused significant increases in DA and HVA levels in the saline- (SM) (+31.6% and +75%, respectively) and METH-pretreated (MM) (+40.8% and +98%, respectively) groups in comparison to the SS group. In addition, DA levels were significantly higher in the MM (+24.5%) in comparison to the MS group. There were no significant differences in DA, DOPAC, or HVA levels between the SM and MM groups. Serotonin (5-HT) and 5-hydroxyindole acetic acid (5-HIAA) levels were not significantly affected by any of the METH treatments.
Table 1. Effects of METH on monoamine levels in the NAc.
| Amines | SS | SM | MS | MM |
| DA | 6.67+0.95 | 8.78+0.51a | 7.54+0.90 | 9.39+0.55b , c |
| DOPAC | 1.27+0.19 | 1.37+0.07 | 1.44+0.10 | 1.54+0.55 |
| HVA | 0.58+0.17 | 1.02+0.11a | 0.94+0.10 | 1.15+0.13b |
| 5-HT | 1.18+0.13 | 1.20+0.11 | 1.17+0.10 | 1.16+0.08 |
| 5-HIAA | 0.84+0.08 | 0.95+0.08 | 0.90+0.09 | 0.97+0.08 |
The values represent means + SEM (ng/mg tissue) per group saline-pretreated and saline-challenged (SS) (n = 4); saline-pretreated and METH-challenged (SM) (n = 8); METH-pretreated and saline-challenged (MS) (n = 9); and METH-pretreated and METH-challenged (MM) (n = 9).
p<0.05;
p<0.01 in comparison to the SS group;
p<0.05 in comparison to the MS group.
No significant differences were observed between the SM and MM groups.
Microarray analyses in the NAc
In order to identify genes that are different between the four experimental groups (4 rats in SS; 6 rats in SM; and 7 rats in each MS and MM groups, see Table S1 in File S1), we performed microarray analyses using Rat Illumina arrays that contain 22,523 probes. The microarray data have been deposited in the NCBI database: GEO accession number GSE46717. We used a cut-off of 1.8-fold changes at P<0.01 because we have been able to replicate the changes in transcript levels by quantitative PCR analysis after identifying genes with similar criteria [5], [6], [11]. Figure 1 is a Venn diagram showing the effects of METH in four sets of comparison. Injection of METH (2.5 mg/kg) caused differential changes in the expression of a total of 412 transcripts (352 up-, 60 down-regulated) (SMvSS comparison). Injection of the larger METH (10 mg/kg) dose caused changes in the expression of 503 (338 upregulated, 165 down-regulated) transcripts in rats euthanized one month later (MSvSS comparison). Injection of METH (2.5 mg/kg) caused significant changes in 766 (565 upregulated, 201 down-regulated) transcripts in animals previously treated with a METH (10 mg/kg) injection one month earlier (MMvSS comparison). The single METH injection altered the expression of 130 transcripts (89 upregulated, 41 down-regulated) in animals previously treated with the METH (10 mg/kg) one month previously when compared to METH-pretreated rats challenged with saline (MMvMS comparison). There was a substantial degree of overlap in the identity of genes differentially expressed in the SMvSS and MSvSS comparisons, with 221 genes coexisting between these two comparisons. There were 344 genes located in the overlap between the MSvSS and the MMvSS comparisons while 265 genes were found in the overlap between the SMvSS and MMvSS comparisons. Interestingly, 201 genes were found in the SMvSS, MSvSS, and MMvSS comparisons, suggesting that the expression of many genes affected acutely by METH remained significantly altered for a period of, at least, one month after the injection.
Figure 1. A single injection of METH (10 mg/kg) caused long-lasting changes in gene expression in the rat nucleus accumbens.
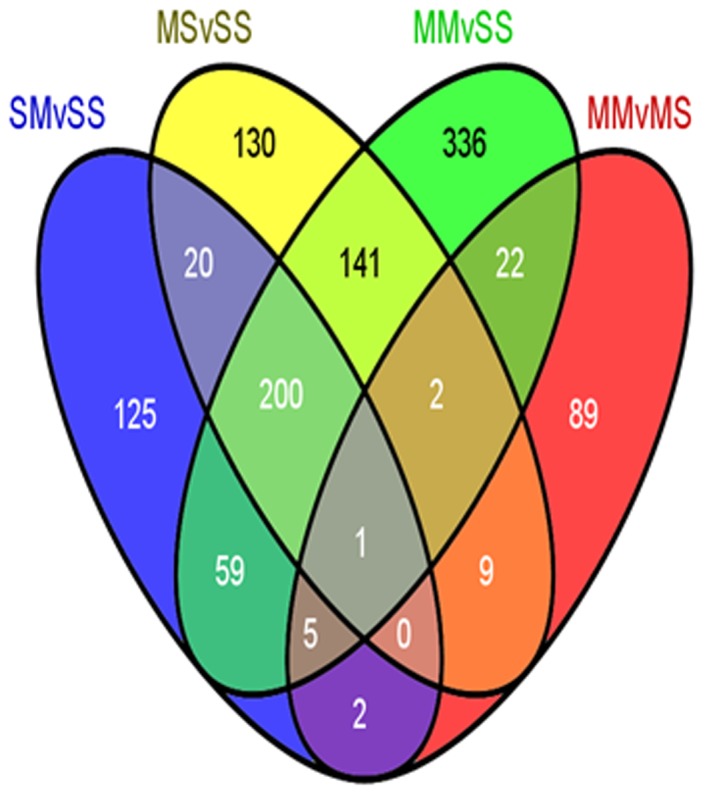
The Venn diagram shows the overlap of genes in the four comparisons described in the text: SMvSS, MSvSS, MMvSS, and MMvMS. The rats were treated as described in the text and the animals were euthanized 2 hours after the second injection of either saline or METH. The microarray experiments were performed as described in the method section. Genes were identified as differentially expressed if they showed greater than+1.8-fold changes at P<0.01, using the GeneSpring statistical package.
Table 2 shows a partial list and the classes of genes that are up-regulated in comparison. to the SS group. Genes with increased expression in SMvSS include Avp (∼26.5-fold); Cart (7.6-fold); Nr4a3 (5.85-fold); c-fos (5.25-fold); Crf/Crh (5.06-fold) and Sst (1.87-fold). The abbreviations are listed in the table. The METH-induced changes in immediate early genes (IEGs) are consistent with our previous observations that single or multiple injections of the drug can cause significant increases in striatal IEG expression [4]–[6], [8]. Pathway analysis using the IPA program identified several networks in which the METH-regulated genes participate. These include cell signaling, cell-to-cell signaling and interaction, nervous system development, and endocrine system functions. Top canonical pathways include G-Protein-coupled receptor signaling. Figure 2 shows a network that contains genes that are involved in cell signaling, CRH signaling and other endocrine functions. The activation of these endocrine signaling pathways after METH supports the suggestions that various peptide neurotransmitters might be involved in both the acute and long-term effects of drugs of abuse [26], [27] see discussion below). Figure 2 also provides evidence of METH induced regulation of genes connected to transcription regulation. These observations are consistent with those reported by several groups of investigators who had performed microarray analyses in forebrain dopaminergic projection areas of rodent brains [7]–[9], [11], [28]–[31].
Table 2. Partial list of METH-upregulated genes in comparison to SS group.
| Symbol | Definition | Fold changes | ||
| SMvSS | MSvSS | MMvSS | ||
| ADP-ribosylation | ||||
| Art5 | ADP-ribosyltransferase 5 | 2.36 | 4.15 | 3.31 |
| Axon guidance/cell cycle | ||||
| Clasp1 | cytoplasmic linker associated protein 1 | 2.25 | 3.09 | 3.15 |
| Plxna4 | plexin A4 | 2.57 | 1.15 | 2.00 |
| Cell adhesion | ||||
| Cpne4 | copine IV | 5.48 | 5.88 | 8.48 |
| Lypd3 | Ly6/Plaur domain containing 3 | 3.85 | 5.66 | 6.63 |
| Mpeg1 | macrophage expressed gene 1 | 5.52 | 4.27 | 4.33 |
| Parvb | parvin, beta | 2.28 | 2.41 | 3.14 |
| Pcdh18 | protocadherin 18 | 4.99 | 5.92 | 7.16 |
| Shank2 | SH3/ankyrin domain gene 2 | 1.02 | 1.38 | 3.54 |
| Cell death | ||||
| Gpx3 | glutathione peroxidase 3 | 2.13 | 2.57 | 2.68 |
| Nell1 | NEL-like 1 (chicken) | 3.90 | 3.99 | 4.18 |
| Unc5d | unc-5 homolog D (C. elegans) | 3.81 | 5.36 | 5.02 |
| Cell growth | ||||
| Fgf11 | fibroblast growth factor 11 | 1.30 | 2.73 | 3.55 |
| Igfbp2 | insulin-like growth factor binding protein 2 | 1.72 | 2.17 | 4.94 |
| Cell morphogenesis | ||||
| Gbx2 | gastrulation brain homeobox 2 | 5.07 | 18.00 | 20.82 |
| Tnnt2 | troponin T2, cardiac | 5.14 | 4.68 | 4.94 |
| Vax1 | ventral anterior homeobox containing gene 1 | 2.41 | 3.06 | 2.57 |
| Defense/Immune systems | ||||
| Calcr | calcitonin receptor, | 14.75 | 23.86 | 19.14 |
| Ccr1 | chemokine (C-C motif) receptor 1 | 5.27 | 4.18 | 4.77 |
| Cxcl13 | chemokine (C-X-C motif) ligand 13 | 8.57 | 11.49 | 12.93 |
| Defb1 | defensin beta 1 | 6.62 | 8.56 | 11.20 |
| Il2 | interleukin 2 | 7.02 | 4.67 | 5.03 |
| Development | ||||
| Aard | alanine and arginine rich domain containing protein | 6.87 | 8.40 | 9.50 |
| Chrd | chordin | 3.46 | 3.83 | 2.72 |
| Dlk1 | delta-like 1 homolog (Drosophila) | 6.87 | 6.00 | 5.74 |
| Myh6 | myosin, heavy polypeptide 6, cardiac muscle, alpha | 2.42 | 2.81 | 3.16 |
| Otx2 | orthodenticle homolog 2 (Drosophila) | 4.77 | 4.75 | 6.28 |
| Rtbnd | retbindin | 5.91 | 6.30 | 4.93 |
| Susd3 | sushi domain containing 3 | 3.90 | 5.91 | 3.61 |
| Homeostasis | ||||
| Pmch | pro-melanin-concentrating hormone | 15.83 | 19.36 | 28.83 |
| Rxfp3 | relaxin family peptide receptor 3 | 9.78 | 9.32 | 13.14 |
| Tfrc | transferrin receptor | 4.80 | 5.28 | 5.55 |
| Agtr1a | angiotensin II receptor, type 1 | 2.17 | 5.19 | 6.66 |
| Cckar | cholecystokinin A receptor | 3.95 | 6.58 | 8.91 |
| Cidea | cell death-inducing DNA fragmentation factor | 1.65 | 4.40 | 3.10 |
| Intracellular protein transport | ||||
| Rpl30 | ribosomal protein L30 | 4.34 | 5.64 | 7.18 |
| Slc7a3 | solute carrier family 7, member 3 | 3.58 | 3.90 | 3.90 |
| Stx17 | syntaxin 17 | 5.81 | 3.55 | 5.81 |
| Tmem7 | transmembrane protein 7 | 3.65 | 4.05 | 3.26 |
| Vamp1 | vesicle-associated membrane protein 1 | 2.18 | 2.03 | 2.50 |
| Ion transport | ||||
| Cacna2d2 | calcium channel, voltage-dependent | 21.16 | 10.84 | 3.59 |
| Clcn1 | chloride channel 1 | 1.90 | 1.62 | 1.41 |
| Fstl5 | follistatin-like 5 | 3.28 | 3.32 | 3.39 |
| Gabra1 | gamma-aminobutyric acid A receptor, alpha 1 | 3.35 | 3.02 | 4.79 |
| Kcnc2 | potassium voltage gated channel | 2.11 | 2.00 | 2.12 |
| Kcnj16 | potassium inwardly-rectifying channel | 8.07 | 9.00 | 12.98 |
| Kcns3 | potassium voltage-gated channel, delayed-rectifier | 2.68 | 2.63 | 2.69 |
| Metabolic process | ||||
| Cdk10 | cyclin-dependent kinase 10 | 2.07 | 1.78 | 1.75 |
| Gdpd2 | glycerophosphodiester phosphodiesterase domain | 3.22 | 4.77 | 4.08 |
| Ptpn18 | protein tyrosine phosphatase, non-receptor type 18 | 5.81 | 3.30 | 4.28 |
| Neuropeptides/Hormone activity | ||||
| Avp | arginine vasopressin | 26.47 | 10.84 | 15.99 |
| Avpr1a | arginine vasopressin receptor 1A | 8.57 | 8.12 | 9.27 |
| Cart | cocaine and amphetamine regulated transcript | 7.63 | 5.65 | 4.97 |
| Crh | corticotropin releasing hormone | 5.06 | 4.00 | 7.33 |
| Gast | gastrin | 5.46 | 5.01 | 4.88 |
| Gnrh1 | gonadotropin-releasing hormone 1 | 4.01 | 3.56 | 4.45 |
| Nts | neurotensin | 2.09 | 1.68 | 1.83 |
| Oxt | oxytocin | 11.50 | 7.98 | 14.91 |
| Sst | somatostatin | 1.87 | 1.58 | 1.73 |
| Sstr1 | somatostatin receptor 1 | 2.98 | 3.27 | 3.97 |
| Regulation of neurotransmitter | ||||
| Chat | choline acetyltransferase | 1.71 | 2.44 | 3.04 |
| Regulation of nucleotide | ||||
| Adcy7 | adenylate cyclase 7 | 2.54 | 4.12 | 4.82 |
| Adcy8 | adenylate cyclase 8 | 2.30 | 2.33 | 2.35 |
| Sensory perception | ||||
| Otog | otogelin | 4.43 | 1.22 | 1.79 |
| Signal transduction | ||||
| Arc | activity regulated cytoskeletal-associated protein | 2.17 | -1.30 | 1.66 |
| Calb2 | calbindin 2 | 5.41 | 6.09 | 6.01 |
| Camk1g | calcium/calmodulin-dependent protein kinase I gamma | 2.46 | 1.91 | 2.48 |
| Camk2d | calcium/calmodulin-dependent protein kinase II, delta | 2.71 | 2.15 | 2.36 |
| Cyp26a1 | cytochrome P450, family 26, subfamily a, polypeptide 1 | 4.21 | 2.70 | 3.71 |
| Disp2 | dispatched homolog 2 | 2.64 | 3.38 | 3.42 |
| Dusp5 | dual specificity phosphatase 5 | 2.43 | 1.05 | 1.63 |
| Gdap1l1 | ganglioside-induced differentiation-associated protein 1 | 1.84 | 1.72 | 1.62 |
| Gpr103 | G protein-coupled receptor 103 | 20.41 | 24.36 | 29.26 |
| Hap1 | huntingtin-associated protein 1 | 3.33 | 3.29 | 4.40 |
| Hcrtr2 | hypocretin receptor 2 | 2.75 | 2.70 | 3.08 |
| Ifitm6 | interferon induced transmembrane protein 6 | 2.16 | 1.60 | 1.48 |
| Insr | insulin receptor | 2.33 | 2.61 | 5.03 |
| Klhl12 | kelch-like 12 (Drosophila) | 2.30 | 1.89 | 1.91 |
| Myo16 | myosin XVI | 3.19 | 3.33 | 3.22 |
| Nmbr | neuromedin B receptor | 4.44 | 2.78 | 3.93 |
| Nnat | neuronatin | 5.85 | 5.09 | 5.25 |
| Nrip3 | nuclear receptor interacting protein 3 | 2.20 | 2.58 | 3.11 |
| Peli1 | pellino homolog 1 (Drosophila) | 28.74 | 7.31 | 19.77 |
| Pnoc | prepronociceptin | 2.05 | 1.97 | 2.08 |
| Pth2r | parathyroid hormone 2 receptor | 7.78 | 11.84 | 13.31 |
| Stap2 | signal transducing adaptor family member 2 | 2.96 | 3.38 | 2.70 |
| Slc17a6 | solute carrier family 17, member 6 | 4.66 | 5.87 | 6.45 |
| Htr7 | 5-hydroxytryptamine receptor 7 | 3.03 | 3.26 | 3.31 |
| Structural | ||||
| Myom3 | myomesin family, member 3 | 7.83 | 4.18 | 6.13 |
| Nup133 | nucleoporin 133 | 1.32 | 1.93 | 3.56 |
| Cbln2 | cerebellin 2 precursor protein | 1.94 | 3.56 | 4.50 |
| Transcription | ||||
| Crebl2 | cAMP responsive element binding protein-like 2 | 2.69 | 1.69 | 2.08 |
| Egr2 | early growth response 2 | 2.68 | 1.12 | 1.60 |
| Egr4 | early growth response 4 | 3.24 | 1.04 | 1.93 |
| Fos | FBJ murine osteosarcoma viral oncogene homolog | 5.25 | 1.35 | 5.27 |
| Hsf4 | heat shock transcription factor 4 | 2.63 | 3.16 | 3.25 |
| Junb | Jun-B oncogene | 2.88 | 1.24 | 2.12 |
| Nkx2-5 | NK2 transcription factor related, locus 5 | 2.24 | 1.69 | 3.52 |
| Npas4 | neuronal PAS domain protein 4 | 4.96 | 1.44 | 5.08 |
| Nr4a3 | nuclear receptor subfamily 4, group A, member 3 | 5.85 | 1.38 | 3.94 |
| Urea cycle | ||||
| Arg2 | arginase 2 | 2.31 | 1.98 | 2.15 |
The animals were treated and microarray analyses were performed as described in the text. The number listed in bold under the representative columns (SMvSS, MSvSS, MMvSS) identify genes whose mRNA were significantly increased according to the following criteria: greater than +1.8-fold, p<0.01. In some cases, values that are greater than 1.8-fold are not in bold because they did not reach the p value cut-off for the microarray analysis.
Figure 2. An acute METH injection induces changes in a network of genes that participate in cell and CRF signaling.

The networks of related genes were generated through the use of IPA (Ingenuity® Systems, www.ingenuity.com). This figure shows that the relationship of several neuropeptides including Avp, Crh (Crf), and Sst that were significantly induced after the acute METH (2.5 mg/kg) injection. The genes were a subset of genes from the SMvSS comparison shown in figure 1. Relationships are shown as lines and arrows. The genes colored red to pink are up-regulated whereas those colored deep to light green are down-regulated. The intensity of the color represents is proportional to fold changes. The indirect relations between the genes were shown in dotted arrows and direct interaction in solid arrows. Arrows are colored differently to ease the identification of each connection. The various shapes within the figure represent the functional classes of the specific gene products (see legend in the top left).
Table 2 also shows a list of genes that were differentially expressed one month after a single injection of METH (10 mg/kg) (MSvSS comparison). The list includes Cckar (cholecystokinin A receptor) (6.58-fold), Cart (5.65-fold), Crh (4-fold), and Gnrh1 (3.56-fold) that showed increased mRNA levels. Interestingly, there was METH-induced down-regulation of Cck (−3.43-fold) in that group (see Table 3 and Fig. 3A). Of interest is the fact that, in the MS group, there were no increases in the expression of any IEGs that were affected in the SM group. The present observations are consistent with those of a previous report that the induced IEG expression caused by METH (20 mg/kg) had reverted to normal by 16 hours after the drug injection [11]. IPA revealed that the genes whose expression was affected by the METH injection participated in cell death mechanisms, inflammatory responses, and endocrine functions. The activation of genes involved in death mechanisms and in inflammatory responses is consistent with previous data that have shown that METH can cause neurodegenerative changes [8], [10] and increased expression of neuroinflammatory markers [32], [33]. Canonical pathways of interest also included cAMP-mediated signaling, CRH signaling, and genes that are involved in the regulation of synaptic long-term potentiation. These observations are consistent with the fact that psychostimulant can cause prolonged changes in synaptic plasticity [34], [35]. IPA also identified networks of genes that are involved in cellular growth and proliferation (Fig. 3A) and in endocrine system disorders (Fig. 3B). The potential involvement of these genes and pathways in the acute and chronic effects of psychostimulant is discussed below (see also [27], [36]).
Table 3. Partial list of METH down-regulated genes in comparison to SS group.
| Symbol | Definition | Fold changes | ||
| SMvSS | MSvSS | MMvSS | ||
| Cell adhesion | ||||
| Actn1 | actinin, alpha 1 | −1.65 | −1.68 | −2.13 |
| Actn2 | actinin alpha 2 | −1.44 | −1.84 | −2.05 |
| Ceacam10 | carcinoembryonic antigen-related cell adhesion molecule 10 | −2.03 | −1.72 | −1.95 |
| Epor | erythropoietin receptor | −1.84 | −2.00 | −2.79 |
| Ptpn7 | protein tyrosine phosphatase, non-receptor type 7 | −1.62 | −2.05 | −2.14 |
| Ptprcap | protein tyrosine phosphatase, receptor type, C polypeptide-associated protein | −1.50 | −2.47 | −3.53 |
| Ptprv | protein tyrosine phosphatase, receptor type, V | −2.01 | −2.12 | −2.95 |
| Sema7a | semaphorin 7A, GPI membrane anchor | −2.96 | −3.16 | −2.77 |
| Cell cycle | ||||
| Cdc20 | cell division cycle 20 | −1.31 | −1.55 | −1.88 |
| Cdc2a | cell division cycle 2 homolog A (S. pombe) | −2.18 | −3.45 | −4.68 |
| Cdca1 | cell division cycle associated 1 | −1.25 | −1.61 | −1.93 |
| Cdca7 | cell division cycle associated 7 | −2.03 | −3.48 | −5.46 |
| Cks2 | CDC28 protein kinase regulatory subunit 2 | −1.46 | −2.20 | −2.58 |
| Cell death | ||||
| Bik | BCL2-interacting killer (apoptosis-inducing) | −1.85 | −2.34 | −2.89 |
| Card6 | caspase recruitment domain family, member 6 | 1.89 | −1.27 | −2.45 |
| Lcn2 | lipocalin 2 | −2.58 | −3.08 | −2.06 |
| Lyzl4 | lysozyme-like 4 | −1.62 | −2.19 | −2.55 |
| Mzb1 | marginal zone B and B1 cell-specific protein | −1.98 | −2.99 | −2.48 |
| Osgin1 | oxidative stress induced growth inhibitor 1 | −4.59 | −2.90 | −3.57 |
| Unc5b | unc-5 homolog B | −1.42 | −1.37 | −1.90 |
| Cell growth | ||||
| Efemp2 | EGF containing fibulin-like extracellular matrix protein 2 | −1.51 | −1.83 | −1.89 |
| Rhbdf1 | rhomboid family 1 | 2.27 | −2.07 | −1.76 |
| Tgfb1 | transforming growth factor, beta 1 | −1.84 | −1.85 | −1.85 |
| Cell organization | ||||
| Acvr1c | activin A receptor, type IC | −2.26 | −2.58 | −2.91 |
| Brsk2 | BR serine/threonine kinase 2 | −2.70 | −3.57 | −3.44 |
| Cdc42ep1 | CDC42 effector protein (Rho GTPase binding) 1 | −1.91 | −1.38 | −1.90 |
| Cenpe | centromere protein E | −2.95 | −2.64 | −3.84 |
| Dscc1 | defective in sister chromatid cohesion 1 homolog | −1.32 | −1.60 | −2.45 |
| Kif11 | kinesin family member 11 | −2.70 | −2.60 | −5.78 |
| Kif23 | kinesin family member 23 | −1.40 | −1.73 | −2.29 |
| Kif4 | kinesin family member 4 | −3.70 | −7.04 | −3.43 |
| Kifc1 | kinesin family member C1 | −2.34 | −1.93 | 2.02 |
| Mcm3 | minichromosome maintenance complex component 3 | −2.56 | −3.96 | 3.96 |
| Myh7b | myosin, heavy chain 7B, cardiac muscle, beta | −1.26 | −1.94 | −2.93 |
| P2ry2 | purinergic receptor P2Y, G-protein coupled, 2 | −3.05 | −1.95 | −2.88 |
| Pde10a | phosphodiesterase 10A | −1.55 | −2.03 | −1.82 |
| Plk1 | polo-like kinase 1 (Drosophila) | −1.94 | −2.70 | −4.36 |
| Rsb66 | Rsb-66 protein | −1.28 | −1.27 | −2.15 |
| Hs3st2 | heparan sulfate (glucosamine) 3-O-sulfotransferase 2 | −1.58 | −2.56 | −2.16 |
| Cytoskeleton | ||||
| Gypc | glycophorin C | −1.20 | −2.74 | −2.75 |
| Krt17 | keratin 17 | −2.15 | −2.30 | −2.86 |
| Obsl1 | obscurin-like 1 | −3.23 | −2.62 | −4.32 |
| Synpo2 | Synaptopodin 2 | −1.33 | −2.13 | −2.28 |
| Tnnt1 | troponin T1, skeletal, slow | −1.52 | −2.42 | −3.18 |
| Defense/Immune response | ||||
| Clcf1 | cardiotrophin-like cytokine factor 1 | −9.10 | −8.82 | −6.64 |
| Cxcl11 | chemokine (C-X-C motif) ligand 11 | −4.22 | −4.21 | −4.34 |
| Dmkn | dermokine | −2.86 | −2.86 | −4.52 |
| Igsf9 | immunoglobulin superfamily, member 9 | −1.79 | −1.89 | −2.33 |
| Il17re | interleukin 17 receptor E | −2.59 | −2.87 | −2.44 |
| Irf6 | interferon regulatory factor 6 | −3.06 | −4.99 | −4.63 |
| Itk | IL2-inducible T-cell kinase | −1.96 | −1.79 | −2.91 |
| Mill1 | MHC I like leukocyte 1 | −1.25 | −1.31 | −3.13 |
| Pik3cd | phosphatidylinositol-4,5-bisphosphate 3-kinase, catalytic subunit delta | −2.30 | −2.77 | −2.76 |
| Pirb | paired-Ig-like receptor B | −1.50 | −2.90 | −1.96 |
| Ptges | prostaglandin E synthase | −3.19 | −3.19 | −2.91 |
| Development | ||||
| Adm | adrenomedullin | −2.16 | −2.08 | −1.30 |
| Angpt2 | angiopoietin 2 | −2.54 | −3.03 | −3.47 |
| Ascl1 | achaete-scute complex homolog-like 1 | −1.64 | −1.91 | −2.13 |
| Cdr2 | cerebellar degeneration-related 2 | −1.90 | −2.44 | −1.82 |
| Coch | cochlin | −1.81 | −2.23 | −2.52 |
| Col18a1 | procollagen, type XVIII, alpha 1 | −1.77 | −2.13 | −2.24 |
| Cryab | crystallin, alpha B | −1.91 | −2.21 | −1.69 |
| Gfap | glial fibrillary acidic protein | −2.75 | −2.35 | −2.22 |
| Plg | plasminogen | −10.09 | 14.35 | −16.06 |
| Slit3 | slit homolog 3 (Drosophila) | −1.93 | −2.74 | −2.68 |
| Zc3h12a | zinc finger CCCH type containing 12A | −3.86 | −3.44 | −1.68 |
| DNA repair | ||||
| Ddit4l | DNA-damage-inducible transcript 4-like | −3.69 | −4.39 | −5.63 |
| Mdc1 | mediator of DNA-damage checkpoint 1 | 1.07 | −1.01 | −1.89 |
| Electron transport | ||||
| Cyp4b1 | cytochrome P450, family 4, subfamily b, polypeptide 1 | −3.71 | −2.68 | −3.25 |
| Homeostasis | ||||
| Ptchd2 | patched domain containing 2 | −1.84 | −2.00 | −2.11 |
| Ion binding | ||||
| Arid5a | AT rich interactive domain 5A | −1.39 | −6.12 | 1.23 |
| Car7 | carbonic anhydrase 7 | −2.04 | −1.85 | −2.04 |
| Ion transport | ||||
| Kcng1 | potassium voltage-gated channel, subfamily G, member 1 | −1.44 | −1.95 | −1.57 |
| Kcnh7 | potassium voltage-gated channel, subfamily H | −1.81 | −4.29 | −1.15 |
| Kcns2 | potassium voltage-gated channel, delayed-rectifier, subfamily S, member 2 | −1.50 | −2.10 | −1.62 |
| Scn4b | sodium channel, type IV, beta | −2.05 | −2.33 | −2.65 |
| Slc16a6 | solute carrier family 16 (monocarboxylic acid transporters), member 6 | −3.03 | −3.20 | −3.22 |
| Slc17a7 | solute carrier family 17, member 7 | −1.94 | −2.95 | −1.20 |
| Slc1a5 | solute carrier family 1 (neutral amino acid transporter), member 5 | −3.29 | −1.49 | −1.85 |
| Slc22a3 | solute carrier family 22 (organic cation transporter), member 3 | −2.31 | −3.59 | −3.39 |
| Slc4a11 | solute carrier family 4, sodium borate transporter, member 11 | −1.87 | −2.71 | −3.68 |
| Slc5a1 | solute carrier family 5 (sodium/glucose cotransporter), member 1 | −1.47 | −2.07 | −2.57 |
| Slc9a3r1 | solute carrier family 9 (sodium/hydrogen exchanger), member 3 regulator 1 | −1.92 | −2.25 | −2.21 |
| Metabolic process | ||||
| Stard4 | StAR-related lipid transfer (START) domain containing 4 | −1.37 | −1.89 | −2.01 |
| Pla1a | phospholipase A1 member A | −2.07 | −2.77 | −2.60 |
| Agpat7 | acylglycerol-3-phosphate O-acyltransferase 7 | −1.69 | −1.82 | −1.85 |
| Asah3l | N-acylsphingosine amidohydrolase 3-like | −1.30 | −2.03 | −1.22 |
| Hpse2 | heparanase-2 | −2.47 | −2.35 | −3.27 |
| Mtmr1 | myotubularin related protein 1 | 1.73 | −1.42 | −5.07 |
| Neu2 | neuraminidase 2 | −1.74 | −2.06 | −2.08 |
| Neuropeptide/Hormone activity | ||||
| Hcrtr1 | hypocretin (orexin) receptor 1 | −2.61 | −2.64 | −2.27 |
| Nmu | neuromedin U | −4.72 | −7.99 | −7.03 |
| Tshr | thyroid stimulating hormone receptor | −1.28 | −2.19 | −3.45 |
| Nucleotide synthesis | ||||
| Atp8 | ATP synthase F0 subunit 8 | −4.45 | −1.07 | −1.62 |
| Rrm2 | ribonucleotide reductase M2 | −1.45 | −1.68 | −2.26 |
| Protein binding | ||||
| Admr | G protein-coupled receptor 182 | −3.16 | −1.06 | −1.53 |
| Cblb | Cbl proto-oncogene, E3 ubiquitin protein ligase B | −1.69 | −1.66 | −2.03 |
| Fbf1 | Fas (TNFRSF6) binding factor 1 | −1.31 | −1.53 | −1.97 |
| Fblim1 | filamin binding LIM protein 1 (Fblim1) | −4.50 | −5.41 | −3.55 |
| Hr | hairless | −1.99 | −1.94 | −2.41 |
| Mtbp | Mdm2, p53 binding protein (mouse) binding protein | −3.53 | −3.53 | −2.77 |
| Osbp2 | oxysterol binding protein 2 | −1.28 | −4.17 | −1.49 |
| Pbk | PDZ binding kinase | −1.90 | −3.75 | −5.36 |
| Pscdbp | pleckstrin homology, Sec7 and coiled-coil domains, binding protein | −5.18 | 11.24 | −26.12 |
| S100a3 | S100 calcium binding protein A3 | −2.47 | −2.35 | −2.71 |
| S100a4 | S100 calcium-binding protein A4 | −1.88 | −1.82 | −2.41 |
| Serinc2 | serine incorporator 2 | −2.87 | −5.75 | −8.18 |
| Tnni3 | troponin I type 3 (cardiac) | −2.52 | −3.21 | −5.57 |
| Tpx2 | TPX2, microtubule-associated, homolog | −2.06 | −3.81 | −2.93 |
| Ttr | transthyretin | −8.88 | −9.37 | 11.99 |
| Protein localization | ||||
| Grik5 | glutamate receptor, ionotropic, kainate 5 | −2.58 | −2.13 | −2.03 |
| Grin2c | glutamate receptor, ionotropic, NMDA2C | −2.00 | −2.01 | −2.52 |
| Kdelr3 | KDEL (Lys-Asp-Glu-Leu) endoplasmic reticulum protein retention receptor 3 | −2.23 | −2.12 | −1.85 |
| Wnk4 | WNK lysine deficient protein kinase 4 | −1.34 | −1.66 | −1.82 |
| Proteolysis | ||||
| Ace | angiotensin I converting enzyme (peptidyl-dipeptidase A) 1 | −2.66 | −2.90 | −2.56 |
| Adamts19 | ADAM metallopeptidase with thrombospondin type 1 motif, 19 | −1.91 | −2.40 | −4.19 |
| Asb2 | ankyrin repeat and SOCS box-containing protein 2 | −1.42 | −2.12 | −2.53 |
| Dusp14 | dual specificity phosphatase 14 | −1.38 | 12.14 | −3.78 |
| Klk7 | kallikrein-related peptidase 7 | −4.54 | −5.31 | −8.54 |
| Lct | lactase | −3.66 | −2.93 | −3.80 |
| Mcpt4l1 | mast cell protease 4-like 1provided | −1.74 | −1.72 | −1.92 |
| Ppp1r1a | protein phosphatase 1, regulatory (inhibitor) subunit 1A | −1.65 | −2.60 | −2.41 |
| Prss54 | protease, serine, 54 | −4.24 | −1.68 | −2.33 |
| Sh3rf2 | SH3 domain containing ring finger 2 | −1.12 | −2.05 | −1.63 |
| Regulation of nucleotide | ||||
| Rap1gap2 | RAP1 GTPase activating protein 2 | −1.56 | −3.02 | −2.80 |
| Sensory perception | ||||
| Armc4 | armadillo repeat containing 4 | −1.10 | −1.24 | −2.52 |
| Olr1260 | olfactory receptor 1260 | −2.79 | −2.31 | −3.10 |
| Olr1579 | olfactory receptor 1579 | −3.05 | −3.33 | −3.90 |
| Olr257 | olfactory receptor 257 | −1.01 | −2.29 | −2.44 |
| Olr271 | olfactory receptor 271 | −2.55 | −1.70 | −3.10 |
| Olr828 | olfactory receptor 828 | −2.15 | −2.21 | −2.21 |
| Trpm8 | transient receptor potential cation channel, subfamily M, member 8 | −2.16 | −3.57 | −1.81 |
| Signal transduction | ||||
| Arhgap25 | Rho GTPase activating protein 25 | −3.30 | −3.23 | −4.25 |
| Arhgap9 | Rho GTPase activating protein 9 | −1.62 | −2.18 | −2.44 |
| Arhgef19 | Rho guanine nucleotide exchange factor (GEF) 19 | −1.86 | −2.17 | −1.92 |
| Bcar3 | breast cancer anti-estrogen resistance 3 | −1.77 | −2.26 | −2.04 |
| Cacng1 | calcium channel, voltage-dependent, gamma subunit 1 | −2.88 | −5.20 | −7.25 |
| Camk4 | calcium/calmodulin-dependent protein kinase IV | −1.37 | −1.87 | −1.92 |
| Cck | cholecystokinin | −1.68 | −3.43 | −1.96 |
| Cnr1 | cannabinoid receptor 1 (brain) | −2.17 | −2.44 | −2.38 |
| Galnt14 | UDP-N-acetyl-alpha-D-galactosamine:polypeptide N-acetylgalactosaminyltransferase 14 | −1.98 | −2.41 | −2.17 |
| Garnl4 | RAP1 GTPase activating protein 2 | −1.56 | −2.96 | −2.80 |
| Gpcr12 | G protein-coupled receptor 12 | −1.55 | −1.85 | −2.10 |
| Madh7 | MAD homolog 7 | −1.71 | −2.35 | −1.97 |
| Mas1 | MAS1 oncogene | −1.65 | −2.69 | −1.63 |
| Mrgprb2 | MAS-related G protein-coupled receptor, member X2-like | −3.03 | −4.01 | −3.45 |
| Nrgn | neurogranin | −1.64 | −1.93 | −1.87 |
| Nxph4 | neurexophilin 4 | −1.46 | −1.81 | −2.74 |
| Rasd2 | RASD family, member 2 | −1.75 | −2.10 | −2.09 |
| Rasgrp2 | RAS guanyl releasing protein 2 | −1.62 | −1.95 | −2.29 |
| Rasl10a | RAS-like, family 10, member A | −2.88 | −2.57 | −2.63 |
| Syt5 | synaptotagmin V | −1.10 | −1.31 | −1.92 |
| Tmem45b | transmembrane protein 45b | −9.59 | −8.29 | −6.92 |
| Tmepai | transmembrane, prostate androgen induced RNA | −2.04 | −2.59 | −2.27 |
| Vgf | VGF nerve growth factor inducible | −1.61 | −2.41 | −2.37 |
| Spindle organization | ||||
| Aspm | asp (abnormal spindle) homolog, microcephaly associated | −1.68 | −2.08 | −2.41 |
| Kntc2 | kinetochore associated 2 | −1.77 | −1.72 | −3.10 |
| Ndc80 | NDC80 homolog, kinetochore complex component | −2.41 | −2.41 | −1.39 |
| Nusap1 | nucleolar and spindle associated protein 1 | −3.41 | −3.78 | −3.78 |
| Structural | ||||
| Mospd4 | motile sperm domain containing 4 | −1.34 | −1.58 | −2.12 |
| Tspear | thrombospondin-type laminin G domain and EAR repeats | −2.50 | −1.81 | −4.08 |
| Transcription | ||||
| Ccdc77 | coiled-coil domain containing 77 | −20.26 | −2.71 | −8.90 |
| Ccer1 | Ccer1 – coiled-coil glutamate-rich protein 1 | −3.10 | −2.41 | −1.39 |
| Ccna2 | cyclin A2 | −2.00 | −5.94 | −8.77 |
| Creb1 | cAMP responsive element binding protein 1 | −1.02 | −2.24 | 1.06 |
| Ebf1 | early B-cell factor 1 | −1.33 | −1.77 | −2.07 |
| Fst | follistatin (Fst) | −2.06 | −2.73 | −2.24 |
| Glrp1 | glutamine repeat protein 1 | −1.74 | −3.28 | −2.14 |
| Hmgb2 | high mobility group box 2 | −1.48 | −2.07 | −2.14 |
| Klf10 | Kruppel-like factor 10 | −1.31 | −2.88 | −1.79 |
| Melk | maternal embryonic leucine zipper kinase | −1.98 | −2.00 | −1.90 |
| Nanog | Nanog homeobox | −1.33 | −2.97 | −1.12 |
| Nr4a2 | nuclear receptor subfamily 4, group A, member 2 | −1.20 | −2.80 | −1.21 |
| Ns5atp9 | NS5A (hepatitis C virus) transactivated protein 9 | −1.89 | −4.35 | −6.72 |
| Onecut2 | one cut homeobox 2 | −1.65 | −1.95 | −2.25 |
| Pdlim1 | PDZ and LIM domain 1 | −2.14 | −2.62 | −1.92 |
| Rarres1 | retinoic acid receptor responder 1 | −2.24 | −1.72 | −1.26 |
| Rcor2 | REST corepressor 2 | −2.21 | −3.39 | −2.31 |
| Rxrg | retinoid X receptor gamma | −1.63 | −1.84 | −2.06 |
| Samd7 | sterile alpha motif domain containing 7 | −3.19 | −1.61 | −1.64 |
| Sfmbt2 | Scm-like with four mbt domains 2 | −1.84 | −2.07 | −2.91 |
| Tcf15 | transcription factor 15 | −1.82 | −1.98 | −2.15 |
| Thrsp | thyroid hormone responsive protein | −1.60 | −2.20 | −1.63 |
| Timeless | timeless circadian clock | −1.28 | −1.68 | −1.95 |
| Traf4af1 | TRAF4 associated factor 1 | −2.53 | −8.01 | −8.80 |
| Ttn | titin | −1.91 | −2.28 | −3.76 |
| Ube2c | ubiquitin-conjugating enzyme E2C | −1.00 | −2.36 | −2.42 |
| Unknown | ||||
| Linc00514 | long intergenic non-protein coding RNA 514 | −2.14 | −2.72 | −3.34 |
| Lrrc10b | leucine rich repeat containing 10B | −2.21 | −3.29 | −2.94 |
| Edc4 | enhancer of mRNA decapping 4 | −2.40 | −2.73 | −2.73 |
The animals were treated and microarray analyses were performed as described in the text. The number listed in bold under the representative columns (SMvSS, MSvSS, MMvSS) identify genes whose mRNA were significantly increased according to the following criteria: lesser than −1.8-fold, p<0.01. In some cases, values that are greater than −1.8-fold are not in bold because they did not reach the p value cut-off for the microarray analysis.
Figure 3. A METH (10 mg/kg) injection caused delayed changes in a network of genes involved in (A) cellular growth and proliferation and (B) in endocrine system regulation.

This network of related genes was generated as described in figure 2. Relationships between genes are also described in figure 2. The rats were injected with METH (10 mg/kg) and were euthanized 2 hours after an injection of saline one month later. The genes were from the MSvSS comparison shown in figure 1. Several neuropeptides of interest including Cart and Crh (Crf) are upregulated one month after the single METH injection (B). In addition to the many upregulated genes, the figure 2A also shows that METH caused down-regulation of Cck mRNA one month after its injection.
The classes of genes that are differentially expressed in the MMvSS comparison are described in Table 2. That list includes Avp (15.99-fold), Oxt (14.91-fold), Crh (7.33-fold), and Cart (4.97-fold) that were upregulated. Several IEGs were also induced in that comparison. The genes affected in that group are involved in development and function of endocrine systems, cell signaling, and molecular transport. Figure 4A shows a network of genes involved in cell signaling and molecular transport whereas figure 4B shows a network that contains genes involved in development and endocrine functions. Canonical pathways affected by this treatment paradigm include cAMP-mediated signaling and CRH signaling. The potential role of some of these genes and pathways in METH-induced neuroadaptations is discussed below.
Figure 4. An acute METH injection produces differential gene expression in METH-pretreated rats.

This network of related genes was generated as described in figure 2. Relationships between genes are also described in figure 2. The rats were injected with METH (10 mg/kg) and were euthanized 2 hours after a second injection of METH (2.5 mg/kg) given one month later. The genes were from the MMvSS comparison shown in figure 1. (A) This network shows genes that participate in cell signaling and molecular transport. (B) Acute METH injection influences the expression of neuropeptides in METH-pretreated rats. Several transcripts including Avp, Cart, and Crh (CRF) showed upregulation after the second METH injection. Note some of the similarities between this network and the one shown in figure 2.
Table 4 shows some genes that were affected in the MMvMS comparison. These genes include Npas4 (4.09-fold), c-fos (3.84-fold), Nr4a3 (2.87-fold), Arc (2.09-fold), and Crh (1.83-fold) that were upregulated. These IEGs were also up-regulated in the SMvSS comparison but showed normal mRNA levels in the MS group. The fact that they are also significantly increased in the MMvSS and MMvMS comparison indicates that their responses to the second acute injection of METH were not significantly affected by the prior injection of the larger METH dose given one month earlier. This is in contrast to the observation for Crh that showed increased expression in the MS group, with a further potentiated response in the MMvMS comparison. Genes with altered gene expression participate in inflammatory responses, endocrine system disorders, cell signaling, and nervous system development. Canonical pathways included ERK/MAPK signaling and CRH signaling.
Table 4. Partial list of METH-upregulated genes in the MMvMS comparison.
| Symbol | Definition | Fold changes |
| Cell adhesion | ||
| Ptpn3 | protein tyrosine phosphatase, non-receptor type 3 | 2.54 |
| Ptpn4 | protein tyrosine phosphatase, non-receptor type 4 | 2.39 |
| Cell migration | ||
| Cd34 | CD34 antigen | 5.27 |
| Nck1 | non-catalytic region of tyrosine kinase adaptor protein 1 | 2.77 |
| Sorl1 | sortilin-related receptor, L(DLR class) A repeats-containing | 4.06 |
| Development | ||
| Col8a1 | procollagen, type VIII, alpha 1 | 6.41 |
| Hormone activity | ||
| Crh | corticotropin releasing hormone | 1.83 |
| F5 | coagulation factor 5 | 24.26 |
| Igfbp2 | insulin-like growth factor binding protein 2 | 2.16 |
| Lhb | luteinizing hormone beta, transcript variant 2 | 1.82 |
| Porf1 | preoptic regulatory factor 1 | 1.94 |
| Prok2 | prokineticin 2 | 2.97 |
| Scgb1c1 | secretoglobin, family 1C, member 1 | 6.95 |
| Sostdc1 | sclerostin domain containing 1 | 30.53 |
| Ttr | transthyretin | 112.39 |
| Immune response | ||
| Bpil1 | bactericidal/permeability-increasing protein-like 1 | 3.12 |
| Nfil3 | nuclear factor, interleukin 3 regulated | 2.01 |
| Ion binding | ||
| Arid5a | AT rich interactive domain 5A | 7.56 |
| Ion transport | ||
| Kcnh7 | potassium voltage-gated channel, subfamily H | 3.75 |
| Kcnt2 | potassium channel, subfamily T, member 2 | 2.11 |
| Slco1a5 | solute carrier organic anion transporter family, member 1a5 | 4.00 |
| Steap1 | six transmembrane epithelial antigen of the prostate 1 | 6.18 |
| Metabolic process | ||
| Asah2 | N-acylsphingosine amidohydrolase 2 | 3.54 |
| Glb1l3 | galactosidase, beta 1-like 3 | 3.03 |
| Mtmr1 | myotubularin related protein 1 | 4.40 |
| Protein binding | ||
| Eif3s12 | eukaryotic translation initiation factor 3, subunit 12 | 2.00 |
| Kpna4 | karyopherin (importin) alpha 4 | 1.82 |
| Protein transport | ||
| Nup133 | nucleoporin 133 | 2.33 |
| Proteolysis | ||
| Dusp1 | dual specificity phosphatase 1 | 1.88 |
| Dusp4 | dual specificity phosphatase 4 | 3.80 |
| Ppp1r15b | protein phosphatase 1, regulatory subunit 15b | 1.99 |
| Usp31 | ubiquitin specific protease 31 | 2.91 |
| Sensory perception | ||
| Mfrp | membrane frizzled-related protein, transcript variant 1 | 14.56 |
| Signal transduction | ||
| Adcy6 | adenylate cyclase 6 | 3.28 |
| Arc | activity regulated cytoskeletal-associated protein | 2.09 |
| Lhfpl4 | lipoma HMGIC fusion partner-like protein 4 | 2.66 |
| Manba | mannosidase, beta A, lysosomal | 2.39 |
| Pank3 | pantothenate kinase 3 | 1.85 |
| Plac9 | placenta-specific 9 | 4.06 |
| Rab33b | RAB33B, member of RAS oncogene family | 4.18 |
| Transcription | ||
| Bmp7 | bone morphogenetic protein 7 | 1.81 |
| Egr4 | early growth response 4 | 2.05 |
| Fos | FBJ murine osteosarcoma viral oncogene homolog | 3.84 |
| Msc | musculin | 6.35 |
| Npas4 | neuronal PAS domain protein 4 | 4.09 |
| Nr1i3 | nuclear receptor subfamily 1, group I, member 3 | 2.61 |
| Nr2c2 | nuclear receptor subfamily 2, group C, member 2 | 2.78 |
| Nr4a2 | nuclear receptor subfamily 4, group A, member 2 | 2.32 |
| Nr4a3 | nuclear receptor subfamily 4, group A, member 3 | 2.87 |
The animals were treated and microarray analyses were performed as described in the text. The gene list was generated based on the following criteria: greater than +1.8-fold, p<0.01. The genes within each class are listed in descending order based on fold-changes in MMvMS comparison.
Quantitative PCR analysis
We used qPCR to confirm the changes in gene expression of some genes of interest. Figure 4 shows METH-induced changes in mRNA levels for Crh and its receptors (4 rats in SS; 6 rats in SM; 7 rats in each MS and MM groups respectively). A single injection of METH (2.5 mg/kg) caused significant increases (5.7-fold) in Crh mRNA levels (Fig. 5A) in saline-pretreated rats (SMvSS). Similar increases (6.0-fold) were observed in rats that had been injected with an injection of METH (10 mg/kg) a month earlier (MSvSS). As per the array data, the injection of the smaller METH dose caused further increases (11.6-fold) in Crh expression in rats pretreated with METH (10 mg/kg dose) a month earlier, with increases in the MMvSS comparison being significantly higher than in the SMvSS and MSvSS comparisons (Fig. 5A). We also measured the expression of CRH receptors after the METH injections. Acute METH caused significant increases Crhr1 mRNA levels in saline-pretreated (1.8-fold, SMvSS) and in METH-pretreated (1.8-fold, MMvSS) rats (Fig. 5B). There were also increases (2.2-fold) in the animals that had received the larger METH dose a month earlier (MSvSS, Fig. 5B). Interestingly, we observed significant greater increases in Crhr2 mRNA expression in the SMvSS (∼5-fold), MSvSS (4.5-fold), and MMvSS (6.5-fold) comparisons (Fig. 5C) than those observed for Crhr1 expression (compare Fig. 5B to 5C).
Figure 5. METH induced changes in the expression of neuropeptides in the rat NAc.

The figure shows the acute and more delayed effects of METH injections on the mRNA levels of (A) CRH, (B) CRHR1, and (C) CRHR2. The PCR data confirmed the changes in expression in CRH expression observed in the microarray data and document changes in CRH receptor expression. Rats were injected (4 rats in SS; 6 rats in SM; 7 rats in each MS and MM groups respectively) and total RNA was extracted from the NAc as described in the text. Statistical significance was determined by ANOVA followed by post-hoc tests. The null hypothesis was rejected at P<0.05. Key to statistics: * = P<0.05, ** = P<0.01; *** = P<0.001, in comparison to the SS group; ### = P<0.001, in comparison to the SM group; !!! = P<0.001, in comparison to the MS group.
Figure 6A shows that there were increased Avp mRNA expression in the SMvSS (7.2-fold), the MSvSS (3-fold), and MMvSS (3.5-fold) comparisons. METH injections also caused increased oxytocin expression in SMvSS (3.9-fold), MSvSS (5.3-fold) and MMvSS (3.7-fold) (Fig. 6B). The single METH (10 mg/kg), given one month earlier caused greater changes in Cart expression in the MSvSS (8.8-fold) comparison than those observed in the SMvSS (6.2-fold) and MMvSS (4.7-fold) (Fig. 6C) comparisons. Figure 6D shows the effects of METH on Gnrh1 expression. As per the array data, acute METH increased GnRH1 in the SMvSS (5.4-fold) and MMvSS (7.7-fold) comparisons. The single injection of the larger METH dose also caused long-lasting changes in Gnrh1 expression in the MS (6.3-fold) group. The changes in Gnrh1 expression in the MMvSS comparison were significantly higher than those observed in the SMvSS, suggesting that the previous METH injection had enhanced the effects of the second METH injection. Importantly, a correlation analysis revealed a significant positive correlation (r = 0.70, p = 0.000006) between the microarray and qPCR data (Fig. 7).
Figure 6. METH induced changes in the expression of neuropeptides in the rat NAc.

The figure shows the acute and more delayed effects of METH injections on the mRNA levels of (A) Vasopressin, (B) Oxytocin, (C) CART, and (D) GnRH1 measured by quantitative PCR. The PCR data confirmed the microarray data. Key to statistics: * = P<0.05, ** = P<0.01; *** = P<0.001, in comparison to the SS group; # = P<0.05; ## = P<0.01; ### = P<0.001, in comparison to the SM group; !!! = P<0.001, in comparison to the MS group.
Figure 7. qPCR validation of METH-induced changes identified by microarray analysis.
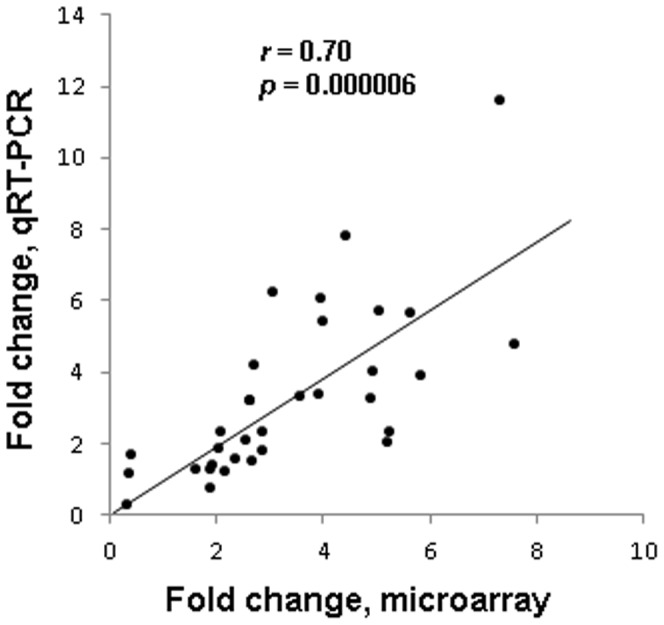
There is a significant correlation between METH-induced changes in the expression of genes identified by microarray analysis and validated by qRT-PCR.
Discussion
The present study shows that an acute METH (2.5 mg/kg) injection can cause differential changes in gene expression in the rat NAc. The transcriptional profiles observed after the METH injections indicate that METH can induce the expression of several genes that participate in the control of transcription and cAMP signaling in the NAc. These findings are consistent with the fact that METH exerts its effects, in part, by releasing DA followed by stimulation of DA D1 receptors that are linked to cAMP activation [6], [7]. In fact, use of the DA antagonist, SCH23390, produces substantial inhibition of the acute transcriptional effects of METH [6], [7]. We also show, for the first time, that a moderate dose of METH (10 mg/kg) can have long-lasting effects on gene expression in the NAc. Pre-exposure to this METH dose influenced METH-induced changes in the expression of many genes upon re-exposure of the rats to a smaller METH dose given a month later. For example, prior exposure to METH led to the potentiation of increased Crh mRNA expression induced by a second METH injection. Taken together, these METH-induced alterations in gene expression in the NAc support the notion that METH can exert pleiotropic effects in the brain [4], [6]–[8]. This conclusion is consistent with results of the pathway analyses that identified METH-induced changes in canonical pathways related to cell-to-cell communication, endocrine functions, and inflammatory responses. The identification of these pathways is of interest and adds to the literature that suggests addiction to psychostimulant involves perturbations in synaptic pathology in a number of neurotransmitter systems [35], resulting, in part, from drug-induced transcriptional changes in the brain [37], [38].
Although drug-induced sensitization has been studied mostly in models where repeated injections of psychostimulant are given [14], considerable evidence exists to suggest that a single injection of drugs of abuse can cause long-term neurochemical, neuroendocrine, and physiological effects in rodents. For example, enhanced amphetamine-induced striatal DA release was reported after a single injection of either amphetamine [18] or cocaine [17]. A single cocaine injection enhanced NAc DA release in response to a second cocaine injection given a week later [16]. A single in vivo exposure to cocaine can cause prolonged long-term potentiation in NAc neurons [34] [28]. A single higher dose of cocaine (20 mg/kg) also enhanced the response to a second dose of cocaine (10 mg/kg) and enhanced the expression GluR1 and GAP-43 mRNA in the NAc [39]. Similar observations have been reported in response to a two-injection pattern of amphetamine administration [19] in a paper that uses a paradigm similar to the METH injection schedule used in the present study. These authors reported enhanced biochemical effects of a second amphetamine (1 mg/kg) injection after prior exposure to the drug (5 mg/kg) [19]. Together, these reports are consistent with our finding that the prior injection of a moderate dose of METH (10 mg/kg) caused enhancement of the increased Crh mRNA expression induced by the administration of a lower METH dose (2.5 mg/kg). CRH/CRF is a 41 amino acid peptide that was identified as a hypothalamic releasing factor that stimulated the secretion of adrenocorticotropic hormone (ACTH) and beta-endorphin [40], and of corticosterone [41]. Subsequent studies also demonstrated that CRH [42]–[44] and CRH receptor proteins and mRNAs [45]–[48] are widely distributed in the central nervous system (CNS).
These observations suggest that CRH and its receptors might serve to integrate physiological responses to stressful stimuli [49]–[51]. Our findings that METH can cause increased mRNA expression of Crh and of its receptors (Crfr1/Crhr1 and Crfr2/Crhr2) are consistent with reports that both Crh and Crhr1 mRNA levels are increased by stress [52]–[54] and by intracerebral administration of CRH itself [55], [56]. Our results are also consistent with previous data that had implicated the CRH system in METH-induced locomotor effects [57], [58]. Our data are also in line with the reported activation of the hypothalamic-pituitary-adrenal (HPA) axis by various drugs of abuse [59]. Our observations of METH-induced Crhr1 and Crhr2 expression are also consistent with a previous report that Crhr1 gene expression in limbic brain regions is important to neuroendocrine responses to stress [60] and with the fact that Crhr2-mutant mice are more sensitive to stress [61]. Interestingly, we found that METH caused greater increases in Crhr2 than in Crhr1 expression in all three groups of METH-treated rats. These observations are consistent with those of other investigators who had reported differential responses in Crhr1 and Crhr2 expression associated with stress, with CRHR1 being internalized and CRHR2 being recruited to the cell membrane [62], [63]. They are also consistent with reports that chronic cocaine facilitates the electrophysiological effects of CRHR2 stimulation [64], [65]. Importantly, our observations of METH-induced increased Crh and Crhr mRNA expression are in agreement with previous results that a single injection of amphetamine (1 mg/kg) induced time-dependent sensitization of the HPA axis such that, by 1–3 weeks after a prior injection of amphetamine (5 mg/kg), there was an augmented secretion of ACTH and corticosterone consequent to a second injection of amphetamine (1 mg/kg) [19]. When taken together with previous findings, the present observations add more support to the accumulating evidence that disturbances in CNS stress response systems might play an important role in long-term molecular adaptations consequent to psychostimulant exposure [27]. Our findings might also be relevant to stress- and drug-induced reinstatement of drug taking, with differential involvement of various limbs of these neuroendocrine cascades being more or less involved in certain aspects of addictive behaviors [66], [67]. Together with our observations of METH-induced greater changes in Crhr2 than in Crhr1 expression, the reviewed literature implicates both CRH receptors in the behavioral and physiological effects of psychostimulant, with CRHR2 playing a more prominent role that it had been assigned so far [68].
We found that the METH (10 mg/kg) injection caused long-lasting increases in Avp mRNA levels. Arginine vasopressin (AVP), one of the first identified neuropeptides, is found predominantly in the hypothalamus [69]. AVP is located in other brain regions including the NAc [70] where it interacts with specific AVP receptors [71], [72]. AVP also interacts with the HPA axis, the extended amygdala, and monoaminergic systems [73]. AVP is co-regulated with CRH [53] and AVP-expressing hypothalamic neurons co-express CRHR1 and CRHR2 receptors [74], results that support the co-involvement of CRH and AVP in stress responses [75], [76]. This discussion is consistent with the pathway analysis that shows a direct interaction of AVP and CRH (Fig. 2). Interestingly, the IPA also shows that both peptides are linked to the expression of the IEGs, c-fos and Creb, whose mRNAs are also induced by the acute METH injection (Fig. 2). Moreover, our findings of increased Avp mRNA expression are consistent with reports that administration of another stimulant, cocaine, can increase Avp mRNA in the NAc [70]. Avp mRNA is increased within 3 hours after cessation of chronic cocaine administration (3×15 mg/kg per day for 14 days) [77] and the increased mRNA expression persists for several weeks during protracted withdrawal from escalating-dose cocaine administration [78]. In addition to the effects of cocaine, stimulation of the mesolimbic system by local injection of a substance P analog into the ventral tegmental area also induces AVP release [79], [80], indicating that this neuropeptide might indeed be an important mediator of some of the physiological effects of psychostimulant since these drugs exert their varied effects through stimulation of monoaminergic systems [1]–[3]. This suggestion is consistent with the demonstration that AVP and its analogues can reduce cocaine self-administration in rats [81], [82]. Taken together with cocaine administration results, our observation of METH-induced prolonged increases in Avp mRNA levels supports the notion that AVP might also participate in neuroadaptive responses triggered by repeated exposure to psychostimulants.
CART is another peptide whose mRNA expression was induced in the different groups of METH-injected rats. CART is a neuropeptide that was discovered using PCR differential display as a rat brain mRNA that responded to cocaine and amphetamine [83], [84]. CART is distributed throughout the brain [84] and is thought to be relevant to the effects of psychostimulants on the reward system in the brain [36], [85]–[90]. CART also participates in stress responses [91], [92]. Of considerable interest to our present observations is the report that CART can activate the HPA axis through a CRH receptor-dependent mechanism [93]. Thus, together with the observed changes in Crh and Avp mRNA expression after the METH injections, the METH-induced increased Cart mRNA expression suggests that METH can cause coordinated changes in the expression of neuropeptides that modulate stress responses in the brain. Similar observations have been made in response to other stressful events [94], [95].
The acute and prolonged changes in Oxt expression caused by METH are also of singular interest. Oxytocin (Oxt) is a nanopeptide [96] that is involved in affiliative [97], grooming [98], maternal [99], pair bonding [100], and other complex behaviors [101]–[104]. Our observations of METH-induced changes in Oxt expression are consistent with those of several studies that have now reported the potential involvement of Oxt in the behavioral and biochemical effects of psychostimulants [105], [106]. For example, it has been reported that Oxt is itself rewarding when tested in the conditioned place preference (CPP) paradigm [107]. In contrast, Oxt reduced cocaine-induced hyperactivity [108], stereotypy [109], and self-administration [110]. More recent studies have provided evidence that Oxt can decrease METH-induced hyperactivity [111], CPP [112], [113], METH self-administration [114], and relapse to METH-seeking behaviors [114], [115]. Oxt also decreased METH-induced activation of the subthalamus nucleus and of the NAc core [116]. Although not yet completely elucidated, these effects of Oxt on METH-induced behaviors are probably due, in part, to its effects on the dopaminergic systems since Oxt can reduce METH-induced DA release in the NAc [111] and serve as a neuromodulator of dopaminergic functions in various behavioral models [117], [118]. When taken together with our present findings, the reviewed literature supports the idea that more studies of this important neuromodulatory system are warranted in models of drug addiction [106]. In view of the observed effects of METH on both Oxt and Avp expression, it will be important to dissect the specific role of each peptide in drug addiction because they are both involved in the modulation of various mammalian behaviors [99], [102], [119].
In summary, this is the first demonstration that a single injection of a moderate METH dose can cause long-lasting alterations in gene expression in the NAc. These changes include prolonged overexpression of mRNAs that code for several neuropeptides including AVP, CART CRH, CART, and OXT that are involved in multipronged neuroendocrine responses to environmental stimuli stress and affiliative interactions. The augmented responses in CRH transcript expression suggest that the peptide might also play important roles in the molecular events that drive plastic alterations in the NAc in response to METH exposure, in a fashion consistent with stress-induced dynamic changes in the brain [51]. More studies are needed to further dissect the role of these neuropeptides in molecular neuroadaptations that are consequent to repeated drug exposure. The impact of these changes within specific cell types within the NAc core and shell subregions will also need to be elucidated.
Materials and Methods
Animals, drug treatment, and tissue collection
Male Sprague-Dawley rats (Charles River Labs, Raleigh, NC, USA), weighing 375±25 g, were used in the experiments. Rats were housed in a temperature-controlled (22.2+0.2°C) room with free access to food and water. All animals were allowed to acclimate to the facility for one week. At first, the animals received a single injection of either saline or METH (10 mg/kg). This injection was followed after a month delay by a second injection of either saline or METH (2.5 mg/kg). This pattern of injections yielded four groups of rats: saline-pretreated and saline-challenged (SS); saline-pretreated and METH-challenged (SM); METH-pretreated and saline-challenged (MS) and METH-pretreated and METH-challenged (MM), summarized in Figure S1 in File S1. Proper handling techniques were used to reduce stress to the animals during injections. Rats were euthanized at 2 hours after the second injection of either METH or saline. NAc tissues were dissected and immediately frozen on dry ice. The pattern of using a larger dose of METH followed by a second lower dose is consistent with studies in which single doses of either cocaine [120] or amphetamine [19] have been used to investigate biochemical sensitization to a second lower dose. Similarly, lower challenge doses of psychostimulants are used when measuring biochemical sensitization after repeated intermittent injections of increasing doses of either cocaine or amphetamine (see [121], [122] and references therein).
Initially, the brain was placed on its dorsal surface on a metal plate that was kept cold on crushed ice. The nucleus accumbens (containing both core+shell subregions) was dissected from the ventral surface of the brain. A wedge of brain tissue is obtained by cutting along two lines: one extending from the base of the lateral ventricle, through the anterior commissure to the medial edge of the lateral olfactory tract and the other connecting the base of the lateral ventricle and the base of the brain.
The tissues were kept at −70°C until they were processed for HPLC analysis or RNA extraction. All animal use procedures were according to the NIH Guide for the Care and Use of Laboratory Animals and were approved by the National Institute of Drug Abuse-/Intramural Research Program (IRP) Animal Care and Use Committee (NIDA/IRP-ACUC).
HPLC Analysis
Monoamine levels in the NAc were quantified by HPLC with electrochemical detection as described in our previous publications [5].
Briefly, NAc was homogenized in 0.01 M HClO4 and centrifuged at 14, 000×g for 15 min. DA, DOPAC, HVA, 5-HT, and 5-HIAA levels were measured by HPLC with electrochemical detection. The analytical column was SunFire C18 (5 µm particle size, 4.6×150.0 mm) from Waters (Waters Corp., Millford, MA). The mobile phase was 0.01 M sodium dihydrogenphosphate, 0.01 M citric acid, 2 mM sodium EDTA, 1 mM sodium octylsulfate, 10% methanol, pH 3.5 at flow rate 1.0 ml/min and temperature 35°C. The installation consisted of Waters 1525 Binary HPLC pump and Esa Coulochem III electrochemical detector (Thermo Fisher Scientific, Sunnyvale, CA). The glassy carbon electrode was used at a potential of 0.75 V. Peak areas and sample concentrations were calculated with the proprietary software program, Breezes (Waters Corp.). The program was used to calculate peak height and to integrate known standards for the HPLC data. Contents of DA, DOPAC and HVA were calculated as pg/mg of tissue weight.
RNA extraction, microarray hybridization, and data analysis
Total RNA was isolated according to the manufacturer's manual using Qiagen RNeasy mini kit (Qiagen, Valencia, CA, USA). RNA integrity was detected using an Agilent 2100 Bioanalyzer (Agilent Technologies, Santa Clara, CA, USA) and showed no degradation (see Table S1 in File S1 for details). Microarray hybridization was carried out using RatRef-12 Expression BeadChips arrays (22,523 probes) (Illumina Inc., San Diego, CA) essentially as previously described by our laboratory [5], [11]. Briefly, a 600 ng aliquot of total RNA from each NAc sample was amplified using Illumina RNA Amplification kit (Ambion, Austin, TX). Single-stranded RNA (cRNA) was generated and labeled by incorporating biotin-16-UTP (Roche Diagnostics, Indianapolis, IN). 750 ng of each cRNA sample were hybridized to Illumina arrays at 55°C overnight according to the Whole-Genome Gene Expression Protocol for BeadStation (Illumina Inc.). Hybridized biotinylated cRNA was detected with Cyanine3-streptavidin (GE Healthcare, Piscataway, NJ) and quantified using Illumina's BeadStation 500GX Genetic Analysis Systems scanner. The Illumina BeadStudio software was used to measure fluorescent hybridization signals and to subtract the background signal. Background subtracted data was imported into GeneSpring software v.12 (Agilent Technologies) and baseline normalization to the median values of each array (n = 24) were performed. The normalized data were used to identify changes in gene expression after the injection of METH. A gene was identified as significantly changed if it showed increased or decreased expression according to an arbitrary cut-off of 1.8-fold changes at P<0.01 using unpaired t-test in the GeneSpring statistical package. Similar criteria have been used successfully in our other studies [5], [11]. The results are reported as fold changes calculated as the ratios of normalized gene expression data for METH-treated groups (SM, MS, and MM) in comparison to the control group (SS).
Quantitative polymerase chain reaction (qPCR)
A portion of the total RNA (0.5 µg) isolated from the NAc samples used in the microarray analysis (Table S1 in File S1) was reverse-transcribed with oligo dT primers using Advantage RT-for-PCR kit (Clontech, Mountain View, CA). qRT-PCR was performed as described previously [5], [11] with Roche LightCycler 480 II (Roche Diagnostics Corp., Indianapolis, IN) using iQ SYBR Green supermix (Bio-Rad, Hercules, CA). For all qRT-PCR experiments, individual data were normalized using the corresponding OAZ1 (ornithine decarboxylase antizyme 1) mRNA level. OAZ1 was used because its expression did not show any significant changes at any time points after the METH injection. The results are reported as fold changes calculated as the ratios of normalized gene expression data for METH-treated groups (SM, MS, and MM) in comparison to the control group (SS). The primers for RT-PCR were synthesized at the Synthesis and Sequencing Facility of Johns Hopkins University (Baltimore, MD, see Table S2 in File S1).
Statistical Analyses
All data are presented as means ± SEM. Statistical analyses were performed using one-way ANOVA analysis followed by Fisher's protected least significant difference (StatView 4.02, SAS Institute, Cary, NC). The null hypothesis was rejected at p≤0.05.
Supporting Information
Figure S1, Pictogram showing the drug treatment schedule.Table S1, RNA Integrity Number (RIN) of Samples. Table S2, List of RT-PCR primers.
(DOCX)
Acknowledgments
The authors thank the reviewers for their valuable comments that helped to improve the content, presentation, and discussion of our results.
Funding Statement
This work was supported by funds of the Intramural Research Program of the DHHS/NIH/NIDA. The funders had no role in study design, data collection and analysis, decision to publish, or preparation of the manuscript.
References
- 1. Bustamante D, You ZB, Castel MN, Johansson S, Goiny M, et al. (2002) Effect of single and repeated methamphetamine treatment on neurotransmitter release in substantia nigra and neostriatum of the rat. J Neurochem 83: 645–654. [DOI] [PubMed] [Google Scholar]
- 2. Kuczenski R, Segal DS, Cho AK, Melega W (1995) Hippocampus norepinephrine, caudate dopamine and serotonin, and behavioral responses to the stereoisomers of amphetamine and methamphetamine. J Neurosci 15: 1308–1317. [DOI] [PMC free article] [PubMed] [Google Scholar]
- 3. Xi ZX, Kleitz HK, Deng X, Ladenheim B, Peng XQ, et al. (2009) A single high dose of methamphetamine increases cocaine self-administration by depletion of striatal dopamine in rats. Neuroscience 161: 392–402. [DOI] [PMC free article] [PubMed] [Google Scholar]
- 4. Cadet JL, Brannock C, Krasnova IN, Ladenheim B, McCoy MT, et al. (2010) Methamphetamine-induced dopamine-independent alterations in striatal gene expression in the 6-hydroxydopamine hemiparkinsonian rats. PLoS One 5: e15643. [DOI] [PMC free article] [PubMed] [Google Scholar]
- 5. Cadet JL, McCoy MT, Cai NS, Krasnova IN, Ladenheim B, et al. (2009) Methamphetamine preconditioning alters midbrain transcriptional responses to methamphetamine-induced injury in the rat striatum. PLoS One 4: e7812. [DOI] [PMC free article] [PubMed] [Google Scholar]
- 6. Jayanthi S, McCoy MT, Beauvais G, Ladenheim B, Gilmore K, et al. (2009) Methamphetamine induces dopamine D1 receptor-dependent endoplasmic reticulum stress-related molecular events in the rat striatum. PLoS One 4: e6092. [DOI] [PMC free article] [PubMed] [Google Scholar]
- 7. Cadet JL, Jayanthi S, McCoy MT, Beauvais G, Cai NS (2010) Dopamine D1 receptors, regulation of gene expression in the brain, and neurodegeneration. CNS Neurol Disord Drug Targets 9: 526–538. [DOI] [PMC free article] [PubMed] [Google Scholar]
- 8. Jayanthi S, Deng X, Ladenheim B, McCoy MT, Cluster A, et al. (2005) Calcineurin/NFAT-induced up-regulation of the Fas ligand/Fas death pathway is involved in methamphetamine-induced neuronal apoptosis. Proc Natl Acad Sci U S A 102: 868–873. [DOI] [PMC free article] [PubMed] [Google Scholar]
- 9. Thomas DM, Francescutti-Verbeem DM, Liu X, Kuhn DM (2004) Identification of differentially regulated transcripts in mouse striatum following methamphetamine treatment–an oligonucleotide microarray approach. J Neurochem 88: 380–393. [DOI] [PubMed] [Google Scholar]
- 10. Krasnova IN, Cadet JL (2009) Methamphetamine toxicity and messengers of death. Brain Res Rev 60: 379–407. [DOI] [PMC free article] [PubMed] [Google Scholar]
- 11. Martin TA, Jayanthi S, McCoy MT, Brannock C, Ladenheim B, et al. (2012) Methamphetamine causes differential alterations in gene expression and patterns of histone acetylation/hypoacetylation in the rat nucleus accumbens. PLoS One 7: e34236. [DOI] [PMC free article] [PubMed] [Google Scholar]
- 12. Willuhn I, Wanat MJ, Clark JJ, Phillips PE (2010) Dopamine signaling in the nucleus accumbens of animals self-administering drugs of abuse. Curr Top Behav Neurosci 3: 29–71. [DOI] [PMC free article] [PubMed] [Google Scholar]
- 13. Wise RA (2009) Roles for nigrostriatal–not just mesocorticolimbic–dopamine in reward and addiction. Trends Neurosci 32: 517–524. [DOI] [PMC free article] [PubMed] [Google Scholar]
- 14. Steketee JD, Kalivas PW (2011) Drug wanting: behavioral sensitization and relapse to drug-seeking behavior. Pharmacol Rev 63: 348–365. [DOI] [PMC free article] [PubMed] [Google Scholar]
- 15. Cornish JL, Kalivas PW (2001) Cocaine sensitization and craving: differing roles for dopamine and glutamate in the nucleus accumbens. J Addict Dis 20: 43–54. [DOI] [PubMed] [Google Scholar]
- 16. Keller RW Jr, Maisonneuve IM, Carlson JN, Glick SD (1992) Within-subject sensitization of striatal dopamine release after a single injection of cocaine: an in vivo microdialysis study. Synapse 11: 28–34. [DOI] [PubMed] [Google Scholar]
- 17. Peris J, Zahniser NR (1987) One injection of cocaine produces a long-lasting increase in [3H]-dopamine release. Pharmacol Biochem Behav 27: 533–535. [DOI] [PubMed] [Google Scholar]
- 18. Robinson TE, Becker JB, Presty SK (1982) Long-term facilitation of amphetamine-induced rotational behavior and striatal dopamine release produced by a single exposure to amphetamine: sex differences. Brain Res 253: 231–241. [DOI] [PubMed] [Google Scholar]
- 19. Vanderschuren LJ, Schmidt ED, De Vries TJ, Van Moorsel CA, Tilders FJ, et al. (1999) A single exposure to amphetamine is sufficient to induce long-term behavioral, neuroendocrine, and neurochemical sensitization in rats. J Neurosci 19: 9579–9586. [DOI] [PMC free article] [PubMed] [Google Scholar]
- 20. McCoy MT, Jayanthi S, Wulu JA, Beauvais G, Ladenheim B, et al. (2011) Chronic methamphetamine exposure suppresses the striatal expression of members of multiple families of immediate early genes (IEGs) in the rat: normalization by an acute methamphetamine injection. Psychopharmacology (Berl) 215: 353–365. [DOI] [PMC free article] [PubMed] [Google Scholar]
- 21. Cadet JL, Jayanthi S, McCoy MT, Vawter M, Ladenheim B (2001) Temporal profiling of methamphetamine-induced changes in gene expression in the mouse brain: evidence from cDNA array. Synapse 41: 40–48. [DOI] [PubMed] [Google Scholar]
- 22. Sabol KE, Roach JT, Broom SL, Ferreira C, Preau MM (2001) Long-term effects of a high-dose methamphetamine regimen on subsequent methamphetamine-induced dopamine release in vivo. Brain Res 892: 122–129. [DOI] [PubMed] [Google Scholar]
- 23. Danaceau JP, Deering CE, Day JE, Smeal SJ, Johnson-Davis KL, et al. (2007) Persistence of tolerance to methamphetamine-induced monoamine deficits. Eur J Pharmacol 559: 46–54. [DOI] [PubMed] [Google Scholar]
- 24. Segal DS, Kuczenski R, O'Neil ML, Melega WP, Cho AK (2003) Escalating dose methamphetamine pretreatment alters the behavioral and neurochemical profiles associated with exposure to a high-dose methamphetamine binge. Neuropsychopharmacology 28: 1730–1740. [DOI] [PubMed] [Google Scholar]
- 25. Frankel PS, Hoonakker AJ, Danaceau JP, Hanson GR (2007) Mechanism of an exaggerated locomotor response to a low-dose challenge of methamphetamine. Pharmacol Biochem Behav 86: 511–515. [DOI] [PMC free article] [PubMed] [Google Scholar]
- 26. Boutrel B (2008) A neuropeptide-centric view of psychostimulant addiction. Br J Pharmacol 154: 343–357. [DOI] [PMC free article] [PubMed] [Google Scholar]
- 27. Koob GF, Zorrilla EP (2010) Neurobiological mechanisms of addiction: focus on corticotropin-releasing factor. Curr Opin Investig Drugs 11: 63–71. [PMC free article] [PubMed] [Google Scholar]
- 28. Krasnova IN, Chiflikyan M, Justinova Z, McCoy MT, Ladenheim B, et al. (2013) CREB phosphorylation regulates striatal transcriptional responses in the self-administration model of methamphetamine addiction in the rat. Neurobiol Dis 58: 132–143. [DOI] [PMC free article] [PubMed] [Google Scholar]
- 29. Piechota M, Korostynski M, Sikora M, Golda S, Dzbek J, et al. (2012) Common transcriptional effects in the mouse striatum following chronic treatment with heroin and methamphetamine. Genes Brain Behav 11: 404–414. [DOI] [PubMed] [Google Scholar]
- 30. Piechota M, Korostynski M, Solecki W, Gieryk A, Slezak M, et al. (2010) The dissection of transcriptional modules regulated by various drugs of abuse in the mouse striatum. Genome Biol 11: R48. [DOI] [PMC free article] [PubMed] [Google Scholar]
- 31. Yang MH, Jung MS, Lee MJ, Yoo KH, Yook YJ, et al. (2008) Gene expression profiling of the rewarding effect caused by methamphetamine in the mesolimbic dopamine system. Mol Cells 26: 121–130. [PubMed] [Google Scholar]
- 32. Clark KH, Wiley CA, Bradberry CW (2013) Psychostimulant abuse and neuroinflammation: emerging evidence of their interconnection. Neurotox Res 23: 174–188. [DOI] [PubMed] [Google Scholar]
- 33. Kelly KA, Miller DB, Bowyer JF, O'Callaghan JP (2012) Chronic exposure to corticosterone enhances the neuroinflammatory and neurotoxic responses to methamphetamine. J Neurochem 122: 995–1009. [DOI] [PMC free article] [PubMed] [Google Scholar]
- 34. Ungless MA, Whistler JL, Malenka RC, Bonci A (2001) Single cocaine exposure in vivo induces long-term potentiation in dopamine neurons. Nature 411: 583–587. [DOI] [PubMed] [Google Scholar]
- 35. Mameli M, Luscher C (2011) Synaptic plasticity and addiction: learning mechanisms gone awry. Neuropharmacology 61: 1052–1059. [DOI] [PubMed] [Google Scholar]
- 36. Kuhar MJ, Jaworski JN, Hubert GW, Philpot KB, Dominguez G (2005) Cocaine- and amphetamine-regulated transcript peptides play a role in drug abuse and are potential therapeutic targets. Aaps J 7: E259–265. [DOI] [PMC free article] [PubMed] [Google Scholar]
- 37. Maze I, Russo SJ (2010) Transcriptional mechanisms: underlying addiction-related structural plasticity. Mol Interv 10: 219–230. [DOI] [PubMed] [Google Scholar]
- 38. Nestler EJ (2012) Transcriptional mechanisms of drug addiction. Clin Psychopharmacol Neurosci 10: 136–143. [DOI] [PMC free article] [PubMed] [Google Scholar]
- 39. Grignaschi G, Burbassi S, Zennaro E, Bendotti C, Cervo L (2004) A single high dose of cocaine induces behavioural sensitization and modifies mRNA encoding GluR1 and GAP-43 in rats. Eur J Neurosci 20: 2833–2837. [DOI] [PubMed] [Google Scholar]
- 40. Vale W, Spiess J, Rivier C, Rivier J (1981) Characterization of a 41-residue ovine hypothalamic peptide that stimulates secretion of corticotropin and beta-endorphin. Science 213: 1394–1397. [DOI] [PubMed] [Google Scholar]
- 41. Rivier C, Brownstein M, Spiess J, Rivier J, Vale W (1982) In vivo corticotropin-releasing factor-induced secretion of adrenocorticotropin, beta-endorphin, and corticosterone. Endocrinology 110: 272–278. [DOI] [PubMed] [Google Scholar]
- 42. Cummings S, Elde R, Ells J, Lindall A (1983) Corticotropin-releasing factor immunoreactivity is widely distributed within the central nervous system of the rat: an immunohistochemical study. J Neurosci 3: 1355–1368. [DOI] [PMC free article] [PubMed] [Google Scholar]
- 43. Joseph SA, Knigge KM (1983) Corticotropin releasing factor: immunocytochemical localization in rat brain. Neurosci Lett 35: 135–141. [DOI] [PubMed] [Google Scholar]
- 44. Merchenthaler I, Vigh S, Petrusz P, Schally AV (1982) Immunocytochemical localization of corticotropin-releasing factor (CRF) in the rat brain. Am J Anat 165: 385–396. [DOI] [PubMed] [Google Scholar]
- 45. De Souza EB, Insel TR, Perrin MH, Rivier J, Vale WW, et al. (1985) Corticotropin-releasing factor receptors are widely distributed within the rat central nervous system: an autoradiographic study. J Neurosci 5: 3189–3203. [DOI] [PMC free article] [PubMed] [Google Scholar]
- 46. Hauger RL, Risbrough V, Brauns O, Dautzenberg FM (2006) Corticotropin releasing factor (CRF) receptor signaling in the central nervous system: new molecular targets. CNS Neurol Disord Drug Targets 5: 453–479. [DOI] [PMC free article] [PubMed] [Google Scholar]
- 47. Potter E, Sutton S, Donaldson C, Chen R, Perrin M, et al. (1994) Distribution of corticotropin-releasing factor receptor mRNA expression in the rat brain and pituitary. Proc Natl Acad Sci U S A 91: 8777–8781. [DOI] [PMC free article] [PubMed] [Google Scholar]
- 48. Van Pett K, Viau V, Bittencourt JC, Chan RK, Li HY, et al. (2000) Distribution of mRNAs encoding CRF receptors in brain and pituitary of rat and mouse. J Comp Neurol 428: 191–212. [DOI] [PubMed] [Google Scholar]
- 49. Bale TL, Vale WW (2004) CRF and CRF receptors: role in stress responsivity and other behaviors. Annu Rev Pharmacol Toxicol 44: 525–557. [DOI] [PubMed] [Google Scholar]
- 50. Binder EB, Nemeroff CB (2010) The CRF system, stress, depression and anxiety-insights from human genetic studies. Mol Psychiatry 15: 574–588. [DOI] [PMC free article] [PubMed] [Google Scholar]
- 51. McEwen BS (2012) The ever-changing brain: cellular and molecular mechanisms for the effects of stressful experiences. Dev Neurobiol 72: 878–890. [DOI] [PMC free article] [PubMed] [Google Scholar]
- 52. Makino S, Schulkin J, Smith MA, Pacak K, Palkovits M, et al. (1995) Regulation of corticotropin-releasing hormone receptor messenger ribonucleic acid in the rat brain and pituitary by glucocorticoids and stress. Endocrinology 136: 4517–4525. [DOI] [PubMed] [Google Scholar]
- 53. Makino S, Smith MA, Gold PW (1995) Increased expression of corticotropin-releasing hormone and vasopressin messenger ribonucleic acid (mRNA) in the hypothalamic paraventricular nucleus during repeated stress: association with reduction in glucocorticoid receptor mRNA levels. Endocrinology 136: 3299–3309. [DOI] [PubMed] [Google Scholar]
- 54. Rabadan-Diehl C, Kiss A, Camacho C, Aguilera G (1996) Regulation of messenger ribonucleic acid for corticotropin releasing hormone receptor in the pituitary during stress. Endocrinology 137: 3808–3814. [DOI] [PubMed] [Google Scholar]
- 55. Imaki T, Naruse M, Harada S, Chikada N, Imaki J, et al. (1996) Corticotropin-releasing factor up-regulates its own receptor mRNA in the paraventricular nucleus of the hypothalamus. Brain Res Mol Brain Res 38: 166–170. [DOI] [PubMed] [Google Scholar]
- 56. Mansi JA, Rivest S, Drolet G (1996) Regulation of corticotropin-releasing factor type 1 (CRF1) receptor messenger ribonucleic acid in the paraventricular nucleus of rat hypothalamus by exogenous CRF. Endocrinology 137: 4619–4629. [DOI] [PubMed] [Google Scholar]
- 57. Giardino WJ, Mark GP, Stenzel-Poore MP, Ryabinin AE (2012) Dissociation of corticotropin-releasing factor receptor subtype involvement in sensitivity to locomotor effects of methamphetamine and cocaine. Psychopharmacology (Berl) 219: 1055–1063. [DOI] [PMC free article] [PubMed] [Google Scholar]
- 58. Giardino WJ, Pastor R, Anacker AM, Spangler E, Cote DM, et al. (2011) Dissection of corticotropin-releasing factor system involvement in locomotor sensitivity to methamphetamine. Genes Brain Behav 10: 78–89. [DOI] [PMC free article] [PubMed] [Google Scholar]
- 59. Armario A (2010) Activation of the hypothalamic-pituitary-adrenal axis by addictive drugs: different pathways, common outcome. Trends Pharmacol Sci 31: 318–325. [DOI] [PubMed] [Google Scholar]
- 60. Muller MB, Zimmermann S, Sillaber I, Hagemeyer TP, Deussing JM, et al. (2003) Limbic corticotropin-releasing hormone receptor 1 mediates anxiety-related behavior and hormonal adaptation to stress. Nat Neurosci 6: 1100–1107. [DOI] [PubMed] [Google Scholar]
- 61. Bale TL, Contarino A, Smith GW, Chan R, Gold LH, et al. (2000) Mice deficient for corticotropin-releasing hormone receptor-2 display anxiety-like behaviour and are hypersensitive to stress. Nat Genet 24: 410–414. [DOI] [PubMed] [Google Scholar]
- 62. Waselus M, Nazzaro C, Valentino RJ, Van Bockstaele EJ (2009) Stress-induced redistribution of corticotropin-releasing factor receptor subtypes in the dorsal raphe nucleus. Biol Psychiatry 66: 76–83. [DOI] [PMC free article] [PubMed] [Google Scholar]
- 63. Wood SK, Zhang XY, Reyes BA, Lee CS, Van Bockstaele EJ, et al. (2013) Cellular adaptations of dorsal raphe serotonin neurons associated with the development of active coping in response to social stress. Biol Psychiatry 73: 1087–1094. [DOI] [PMC free article] [PubMed] [Google Scholar]
- 64. Liu J, Yu B, Orozco-Cabal L, Grigoriadis DE, Rivier J, et al. (2005) Chronic cocaine administration switches corticotropin-releasing factor2 receptor-mediated depression to facilitation of glutamatergic transmission in the lateral septum. J Neurosci 25: 577–583. [DOI] [PMC free article] [PubMed] [Google Scholar]
- 65. Orozco-Cabal L, Liu J, Pollandt S, Schmidt K, Shinnick-Gallagher P, et al. (2008) Dopamine and corticotropin-releasing factor synergistically alter basolateral amygdala-to-medial prefrontal cortex synaptic transmission: functional switch after chronic cocaine administration. J Neurosci 28: 529–542. [DOI] [PMC free article] [PubMed] [Google Scholar]
- 66. Le AD, Harding S, Juzytsch W, Watchus J, Shalev U, et al. (2000) The role of corticotrophin-releasing factor in stress-induced relapse to alcohol-seeking behavior in rats. Psychopharmacology (Berl) 150: 317–324. [DOI] [PubMed] [Google Scholar]
- 67. Shalev U, Erb S, Shaham Y (2010) Role of CRF and other neuropeptides in stress-induced reinstatement of drug seeking. Brain Res 1314: 15–28. [DOI] [PMC free article] [PubMed] [Google Scholar]
- 68. Gysling K (2012) Relevance of both type-1 and type-2 corticotropin releasing factor receptors in stress-induced relapse to cocaine seeking behaviour. Biochem Pharmacol 83: 1–5. [DOI] [PubMed] [Google Scholar]
- 69. Swaab DF, Pool CW, Nijveldt F (1975) Immunofluorescence of vasopressin and oxytocin in the rat hypothalamo-neurohypophypopseal system. J Neural Transm 36: 195–215. [DOI] [PubMed] [Google Scholar]
- 70. Rodriguez-Borrero E, Rivera-Escalera F, Candelas F, Montalvo J, Munoz-Miranda WJ, et al. (2010) Arginine vasopressin gene expression changes within the nucleus accumbens during environment elicited cocaine-conditioned response in rats. Neuropharmacology 58: 88–101. [DOI] [PMC free article] [PubMed] [Google Scholar]
- 71. Koshimizu TA, Nakamura K, Egashira N, Hiroyama M, Nonoguchi H, et al. (2012) Vasopressin V1a and V1b receptors: from molecules to physiological systems. Physiol Rev 92: 1813–1864. [DOI] [PubMed] [Google Scholar]
- 72. Peter J, Burbach H, Adan RA, Lolait SJ, van Leeuwen FW, et al. (1995) Molecular neurobiology and pharmacology of the vasopressin/oxytocin receptor family. Cell Mol Neurobiol 15: 573–595. [DOI] [PMC free article] [PubMed] [Google Scholar]
- 73. Locatelli V, Bresciani E, Tamiazzo L, Torsello A (2010) Central nervous system-acting drugs influencing hypothalamic-pituitary-adrenal axis function. Endocr Dev 17: 108–120. [DOI] [PubMed] [Google Scholar]
- 74. Arima H, Aguilera G (2000) Vasopressin and oxytocin neurones of hypothalamic supraoptic and paraventricular nuclei co-express mRNA for Type-1 and Type-2 corticotropin-releasing hormone receptors. J Neuroendocrinol 12: 833–842. [DOI] [PubMed] [Google Scholar]
- 75. Aguilera G (2011) HPA axis responsiveness to stress: implications for healthy aging. Exp Gerontol 46: 90–95. [DOI] [PMC free article] [PubMed] [Google Scholar]
- 76. Caldwell HK, Lee HJ, Macbeth AH, Young WS 3rd (2008) Vasopressin: behavioral roles of an “original” neuropeptide. Prog Neurobiol 84: 1–24. [DOI] [PMC free article] [PubMed] [Google Scholar]
- 77. Zhou Y, Bendor JT, Yuferov V, Schlussman SD, Ho A, et al. (2005) Amygdalar vasopressin mRNA increases in acute cocaine withdrawal: evidence for opioid receptor modulation. Neuroscience 134: 1391–1397. [DOI] [PubMed] [Google Scholar]
- 78. Zhou Y, Litvin Y, Piras AP, Pfaff DW, Kreek MJ (2011) Persistent increase in hypothalamic arginine vasopressin gene expression during protracted withdrawal from chronic escalating-dose cocaine in rodents. Neuropsychopharmacology 36: 2062–2075. [DOI] [PMC free article] [PubMed] [Google Scholar]
- 79. Cornish JL, van den Buuse M (1995) Stimulation of the rat mesolimbic dopaminergic system produces a pressor response which is mediated by dopamine D-1 and D-2 receptor activation and the release of vasopressin. Brain Res 701: 28–38. [DOI] [PubMed] [Google Scholar]
- 80. Cornish JL, Wilks DP, Van den Buuse M (1997) A functional interaction between the mesolimbic dopamine system and vasopressin release in the regulation of blood pressure in conscious rats. Neuroscience 81: 69–78. [DOI] [PubMed] [Google Scholar]
- 81. de Vry J, Donselaar I, van Ree JM (1988) Effects of desglycinamide9, (Arg8) vasopressin and vasopressin antiserum on the acquisition of intravenous cocaine self-administration in the rat. Life Sci 42: 2709–2715. [DOI] [PubMed] [Google Scholar]
- 82. van Ree JM, Burbach-Bloemarts EM, Wallace M (1988) Vasopressin neuropeptides and acquisition of heroin and cocaine self-administration in rats. Life Sci 42: 1091–1099. [DOI] [PubMed] [Google Scholar]
- 83. Douglass J, Daoud S (1996) Characterization of the human cDNA and genomic DNA encoding CART: a cocaine- and amphetamine-regulated transcript. Gene 169: 241–245. [DOI] [PubMed] [Google Scholar]
- 84. Douglass J, McKinzie AA, Couceyro P (1995) PCR differential display identifies a rat brain mRNA that is transcriptionally regulated by cocaine and amphetamine. J Neurosci 15: 2471–2481. [DOI] [PMC free article] [PubMed] [Google Scholar]
- 85. Fagergren P, Hurd Y (2007) CART mRNA expression in rat monkey and human brain: relevance to cocaine abuse. Physiol Behav 92: 218–225. [DOI] [PubMed] [Google Scholar]
- 86. Hubert GW, Jones DC, Moffett MC, Rogge G, Kuhar MJ (2008) CART peptides as modulators of dopamine and psychostimulants and interactions with the mesolimbic dopaminergic system. Biochem Pharmacol 75: 57–62. [DOI] [PMC free article] [PubMed] [Google Scholar]
- 87. Hubert GW, Manvich DF, Kuhar MJ (2010) Cocaine and amphetamine-regulated transcript-containing neurons in the nucleus accumbens project to the ventral pallidum in the rat and may inhibit cocaine-induced locomotion. Neuroscience 165: 179–187. [DOI] [PMC free article] [PubMed] [Google Scholar]
- 88. Kim JH, Creekmore E, Vezina P (2003) Microinjection of CART peptide 55–102 into the nucleus accumbens blocks amphetamine-induced locomotion. Neuropeptides 37: 369–373. [DOI] [PubMed] [Google Scholar]
- 89. Kim S, Yoon HS, Kim JH (2007) CART peptide 55–102 microinjected into the nucleus accumbens inhibits the expression of behavioral sensitization by amphetamine. Regul Pept 144: 6–9. [DOI] [PubMed] [Google Scholar]
- 90. Rogge G, Jones D, Hubert GW, Lin Y, Kuhar MJ (2008) CART peptides: regulators of body weight, reward and other functions. Nat Rev Neurosci 9: 747–758. [DOI] [PMC free article] [PubMed] [Google Scholar]
- 91. Balkan B, Keser A, Gozen O, Koylu EO, Dagci T, et al. (2012) Forced swim stress elicits region-specific changes in CART expression in the stress axis and stress regulatory brain areas. Brain Res 1432: 56–65. [DOI] [PubMed] [Google Scholar]
- 92. Dominguez G, Vicentic A, Del Giudice EM, Jaworski J, Hunter RG, et al. (2004) CART peptides: modulators of mesolimbic dopamine, feeding, and stress. Ann N Y Acad Sci 1025: 363–369. [DOI] [PubMed] [Google Scholar]
- 93. Smith SM, Vaughan JM, Donaldson CJ, Rivier J, Li C, et al. (2004) Cocaine- and amphetamine-regulated transcript activates the hypothalamic-pituitary-adrenal axis through a corticotropin-releasing factor receptor-dependent mechanism. Endocrinology 145: 5202–5209. [DOI] [PubMed] [Google Scholar]
- 94. Herman JP, Ostrander MM, Mueller NK, Figueiredo H (2005) Limbic system mechanisms of stress regulation: hypothalamo-pituitary-adrenocortical axis. Prog Neuropsychopharmacol Biol Psychiatry 29: 1201–1213. [DOI] [PubMed] [Google Scholar]
- 95. Jankord R, Herman JP (2008) Limbic regulation of hypothalamo-pituitary-adrenocortical function during acute and chronic stress. Ann N Y Acad Sci 1148: 64–73. [DOI] [PMC free article] [PubMed] [Google Scholar]
- 96. Du Vigneaud V, Ressler C, Trippett S (1953) The sequence of amino acids in oxytocin, with a proposal for the structure of oxytocin. J Biol Chem 205: 949–957. [PubMed] [Google Scholar]
- 97. Insel TR (2010) The challenge of translation in social neuroscience: a review of oxytocin, vasopressin, and affiliative behavior. Neuron 65: 768–779. [DOI] [PMC free article] [PubMed] [Google Scholar]
- 98. Drago F, Caldwell JD, Pedersen CA, Continella G, Scapagnini U, et al. (1986) Dopamine neurotransmission in the nucleus accumbens may be involved in oxytocin-enhanced grooming behavior of the rat. Pharmacol Biochem Behav 24: 1185–1188. [DOI] [PubMed] [Google Scholar]
- 99. Shahrokh DK, Zhang TY, Diorio J, Gratton A, Meaney MJ (2010) Oxytocin-dopamine interactions mediate variations in maternal behavior in the rat. Endocrinology 151: 2276–2286. [DOI] [PMC free article] [PubMed] [Google Scholar]
- 100. Liu Y, Wang ZX (2003) Nucleus accumbens oxytocin and dopamine interact to regulate pair bond formation in female prairie voles. Neuroscience 121: 537–544. [DOI] [PubMed] [Google Scholar]
- 101. Burkett JP, Young LJ (2012) The behavioral, anatomical and pharmacological parallels between social attachment, love and addiction. Psychopharmacology (Berl) 224: 1–26. [DOI] [PMC free article] [PubMed] [Google Scholar]
- 102. Donaldson ZR, Young LJ (2008) Oxytocin, vasopressin, and the neurogenetics of sociality. Science 322: 900–904. [DOI] [PubMed] [Google Scholar]
- 103. Lee HJ, Macbeth AH, Pagani JH, Young WS 3rd (2009) Oxytocin: the great facilitator of life. Prog Neurobiol 88: 127–151. [DOI] [PMC free article] [PubMed] [Google Scholar]
- 104. Neumann ID (2008) Brain oxytocin: a key regulator of emotional and social behaviours in both females and males. J Neuroendocrinol 20: 858–865. [DOI] [PubMed] [Google Scholar]
- 105. Carson DS, Guastella AJ, Taylor ER, McGregor IS (2013) A brief history of oxytocin and its role in modulating psychostimulant effects. J Psychopharmacol 27: 231–247. [DOI] [PubMed] [Google Scholar]
- 106. McGregor IS, Bowen MT (2012) Breaking the loop: oxytocin as a potential treatment for drug addiction. Horm Behav 61: 331–339. [DOI] [PubMed] [Google Scholar]
- 107. Liberzon I, Trujillo KA, Akil H, Young EA (1997) Motivational properties of oxytocin in the conditioned place preference paradigm. Neuropsychopharmacology 17: 353–359. [DOI] [PubMed] [Google Scholar]
- 108. Kovacs GL, Sarnyai Z, Barbarczi E, Szabo G, Telegdy G (1990) The role of oxytocin-dopamine interactions in cocaine-induced locomotor hyperactivity. Neuropharmacology 29: 365–368. [DOI] [PubMed] [Google Scholar]
- 109. Sarnyai Z, Babarczy E, Krivan M, Szabo G, Kovacs GL, et al. (1991) Selective attenuation of cocaine-induced stereotyped behaviour by oxytocin: putative role of basal forebrain target sites. Neuropeptides 19: 51–56. [DOI] [PubMed] [Google Scholar]
- 110. Sarnyai Z, Kovacs GL (1994) Role of oxytocin in the neuroadaptation to drugs of abuse. Psychoneuroendocrinology 19: 85–117. [DOI] [PubMed] [Google Scholar]
- 111. Qi J, Yang JY, Song M, Li Y, Wang F, et al. (2008) Inhibition by oxytocin of methamphetamine-induced hyperactivity related to dopamine turnover in the mesolimbic region in mice. Naunyn Schmiedebergs Arch Pharmacol 376: 441–448. [DOI] [PubMed] [Google Scholar]
- 112. Baracz SJ, Rourke PI, Pardey MC, Hunt GE, McGregor IS, et al. (2012) Oxytocin directly administered into the nucleus accumbens core or subthalamic nucleus attenuates methamphetamine-induced conditioned place preference. Behav Brain Res 228: 185–193. [DOI] [PubMed] [Google Scholar]
- 113. Qi J, Yang JY, Wang F, Zhao YN, Song M, et al. (2009) Effects of oxytocin on methamphetamine-induced conditioned place preference and the possible role of glutamatergic neurotransmission in the medial prefrontal cortex of mice in reinstatement. Neuropharmacology 56: 856–865. [DOI] [PubMed] [Google Scholar]
- 114. Carson DS, Cornish JL, Guastella AJ, Hunt GE, McGregor IS (2010) Oxytocin decreases methamphetamine self-administration, methamphetamine hyperactivity, and relapse to methamphetamine-seeking behaviour in rats. Neuropharmacology 58: 38–43. [DOI] [PubMed] [Google Scholar]
- 115. Cox BM, Young AB, See RE, Reichel CM (2013) Sex differences in methamphetamine seeking in rats: Impact of oxytocin. Psychoneuroendocrinology [DOI] [PMC free article] [PubMed] [Google Scholar]
- 116. Carson DS, Hunt GE, Guastella AJ, Barber L, Cornish JL, et al. (2010) Systemically administered oxytocin decreases methamphetamine activation of the subthalamic nucleus and accumbens core and stimulates oxytocinergic neurons in the hypothalamus. Addict Biol 15: 448–463. [DOI] [PubMed] [Google Scholar]
- 117. Baskerville TA, Douglas AJ (2010) Dopamine and oxytocin interactions underlying behaviors: potential contributions to behavioral disorders. CNS Neurosci Ther 16: e92–123. [DOI] [PMC free article] [PubMed] [Google Scholar]
- 118. Skuse DH, Gallagher L (2009) Dopaminergic-neuropeptide interactions in the social brain. Trends Cogn Sci 13: 27–35. [DOI] [PubMed] [Google Scholar]
- 119. Meyer-Lindenberg A, Domes G, Kirsch P, Heinrichs M (2011) Oxytocin and vasopressin in the human brain: social neuropeptides for translational medicine. Nat Rev Neurosci 12: 524–538. [DOI] [PubMed] [Google Scholar]
- 120. Kalivas PW, Alesdatter JE (1993) Involvement of N-methyl-D-aspartate receptor stimulation in the ventral tegmental area and amygdala in behavioral sensitization to cocaine. J Pharmacol Exp Ther 267: 486–495. [PubMed] [Google Scholar]
- 121. Paulson PE, Robinson TE (1995) Amphetamine-induced time-dependent sensitization of dopamine neurotransmission in the dorsal and ventral striatum: a microdialysis study in behaving rats. Synapse 19: 56–65. [DOI] [PMC free article] [PubMed] [Google Scholar]
- 122. Robinson TE, Berridge KC (2008) Review. The incentive sensitization theory of addiction: some current issues. Philos Trans R Soc Lond B Biol Sci 363: 3137–3146. [DOI] [PMC free article] [PubMed] [Google Scholar]
Associated Data
This section collects any data citations, data availability statements, or supplementary materials included in this article.
Supplementary Materials
Figure S1, Pictogram showing the drug treatment schedule.Table S1, RNA Integrity Number (RIN) of Samples. Table S2, List of RT-PCR primers.
(DOCX)