Abstract
Background
We have previously shown that a candidate idiotype vaccine, based on the IGKV3-20 light chain protein, is able to induce activation of circulating antigen presenting cells (APCs) in both HCV-positive and HCV-negative subjects, with production of Th2-type cytokines. In addition, such a candidate idiotype vaccine induces an early gene expression pattern, characterized by the strong induction of an innate immune response, and a late pattern, characterized by a prevalent B cell response. Nonetheless, some HCV-positive individuals showed a complete lack of maturation of circulating APCs with low levels of cytokine production, strongly suggesting the possible identification of selective impairments in immune response in individual subjects.
Method
Peripheral blood mononuclear cells (PBMCs) were stimulated ex vivo with IGKV3-20 for 24 h and 6 days. Analysis of the global gene expression profile as well as the cytokine pattern was performed for individual subjects.
Results
The gene expression profile showed a strong agreement with the cytokine pattern. Indeed, the expression pattern of immune-related genes is highly predictive of the individual immunological phenotype.
Conclusion
The overall results represent a proof of concept, indicating the efficacy of such an ex vivo screening platform for predicting individual’s responsiveness to an antigen as well as guiding optimization of vaccine design. Larger cohort study will be needed to validate results observed in the study.
Keywords: Hepatitis C Virus, Non-Hodgkin’s Lymphoma, Idiotype vaccine, Immune response, Systems biology
Introduction
Hepatitis C virus (HCV) is a Hepacivirus of the Flaviviridae family, mainly involved in hepatic disorders, including chronic hepatitis, cirrhosis and hepatocellular carcinoma (HCC) [1].
HCV has also been recognized as the major etiologic factor of type II mixed cryoglobulinemia (MC), an autoimmune disease ultimately leading to B cell non-Hodgkin’s lymphoma (NHL) in about 10% of MC patients [2-5].
The clonal B cell expansion is characterized by the production of an Ig molecule expressing a unique combination of antigen-specific sequences, the so called idiotype (Id). Therefore, the Id can be a suitable target for active, as well as passive immune-therapeutic strategies to eliminate the B cells driving the tumor [6,7].
In this respect, the IGKV3-20 idiotype has been selected as a potential target of either passive immune therapy or active vaccine strategy [8].
We have previously reported the results of the effect of the IGKV3-20 candidate idiotype vaccine on ex vivo stimulated PBMCs, as experimental platform for evaluation and prediction of responsiveness to vaccination [9]. IGKV3-20 light chain protein has been shown to induce activation of circulating APCs, i.e., CD14+ monocytes, as well as CD123+ plasmacytoid dendritic cells (pDCs) and CD11c+ myeloid DCs (mDCs), in both HCV-positive and HCV-negative healthy control subjects, with production of Th2-type cytokines [9,10]. No significant difference was observed between results obtained in human monocyte-derived dendritic cells (MDDCs) and circulating APCs, confirming previous results by us and other groups [11-15].
Moreover, such a candidate idiotype vaccine induces an early expression pattern, characterized by the induction of genes related to inflammatory response, and a late pattern, characterized by the induction of genes related to a B cell response [10].
Indeed, the Ingenuity Pathways Analysis (IPA) performed on “early” and “late” up-regulated genes showed a prevalence of inflammation and innate immunity-related pathways activated at 24 h post-induction, with significant overlapping between HCV-negative and positive groups, and a prevalence of “atypical” immune pathways activated at 6 days post-induction [10].
Nonetheless, some HCV-positive and negative subjects showed a poor response to the IGKV3-20 protein, with significant low levels of cytokine production and limited gene expression pattern.
In this regard, here we describe a systems biology approach to evaluate the individual responsiveness to the recombinant IGKV3-20 protein, aiming at identifying a possible impairment in the immune response and/or markers of responsiveness to such a specific antigen. Indeed, the specific effect of the recombinant IGKV3-20 protein has been evaluated ex vivo on human PBMCs of individual HCV-positive subjects via multiparametric analyses, including gene expression profiling combined to multiplex analysis of cytokines.
Materials and methods
Clinical specimens and cell treatment
Overall, samples from six HCV-positive subjects were analysed for the present study. Samples from five healthy donors were used as controls. Enrollment of subjects and treatment of derived human PBMCs have been previously described [10].
Unsupervised analysis
For the unsupervised analysis a low-stringency filtering was applied, selecting the genes differentially expressed in 80% of all experiments with a >3 fold change ratio in at least one experiment. Hierarchical cluster analysis was conducted on the selected genes according to Eisen et al. [16]; differentially expressed genes were visualized by Treeview and displayed according to the central method [16,17].
Supervised analysis
Supervised class comparison was performed using BRB ArrayTool developed at NCI, Biometric Research Branch, Division of Cancer Treatment and Diagnosis. Two subsets of genes were explored. The first subset included genes up-regulated in stimulated (IGKV3-20 treated) PBMCs compared to non-stimulated (PBS treated) PBMCs after 24 h incubation; the second subset included genes up-regulated in stimulated PBMCs compared to non-stimulated PBMCs after 6 days incubation.
Class comparison analyses were tested for an univariate significance threshold set at a p-value < 0.001. Gene clusters identified by the univariate t-test were challenged with two alternative additional tests, an univariate permutation test (PT) and a global multivariate PT.
Class comparison and hierarchical clustering were employed to determine the pattern of response and results are illustrated as a heat map of significance values. All analyses were performed using R and Cytoscape (http://www.cytoscape.org). Gene function was assigned based on Database for Annotation, Visualization and Integrated Discovery (DAVID) (http://david.abcc.ncifcrf.gov) and Gene Ontology (http://www.geneontology.org).
Ingenuity Pathways Analysis (IPA,http://www.ingenuity.com) was employed to elucidate the relationship and connection between differentially expressed genes.
Results
Cytokine pattern induced in circulating APCs
PBMCs obtained from enrolled subjects were incubated with IGKV3-20 for 24 h and 6 days and, at each time-point, levels of Th1 (IL-2 and TNF-α) and Th2 (IL-5, IL-6 and IL-10) cytokines were assessed by ELISA in the culture supernatant. The results show that the stimulation induces a significant production of both Th1 (TNF-α) and Th2 cytokines (IL-6 and IL-10) with a prevalent Th2-biased cytokine pattern, as previously reported [10].
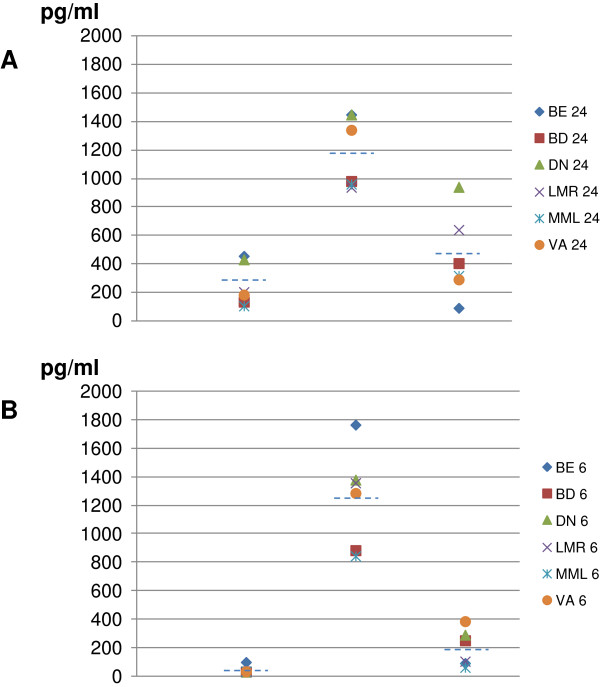
However, specific subjects show levels of cytokine induction significantly far from the mean value, indicating that differences may be observed in the response elicited by the antigen (Figure 1).
Figure 1.
Analysis of cytokine production in supernatant of PBMCs. The cytokine profile induced by IGKV3-20 after 24 h (A) and 6d (B) incubation was evaluated in supernatant of stimulated PBMCs.
Indeed, at 24 h post-induction, PBMCs of subject DN always score at the top for release of TNF-α, IL-6 and IL-10 (1.7, 1.2 and 2.1 folds over the average, respectively). PBMCs of subject BE show a very similar pattern for TNF-α and IL-6 (1.8 and 1.2 folds over the average, respectively), whereas the amount of IL-10 released is the lowest (0.2 folds over the average). On the contrary, PBMCs of subjects MML and BD release the lowest levels of TNF-α and IL-6 (0.4 and 0.8 folds over the average, respectively) (Figure 1A).
Overall, high levels of IL-6 persist for the 6 days of induction, whereas the induction of IL-10 and, even more, TNF-α fades away at 6 days (Figure 1B).
Nevertheless, only PBMCs of subject BE (unlike those of DN) are confirmed to release the highest amount of TNF-α and IL-6, while PBMCs of subject VA release the highest amount of IL-10 (Figure 1B). As for the 24 h time-point, PBMCs of MML are confirmed to release the lowest amount of all three cytokines (Figure 1B). The overall results, therefore, indicate distinct cytokine patterns elicited by the same antigen ex vivo which may possibly reflect differences in individual response to the same antigen after in vivo vaccination.
Identification of immune response pattern to IGKV3-20 at “early” time-point
Subsequently, the gene expression profile of samples from HCV-positive subjects, previously analyzed as whole group [10], was evaluated to identify individual patterns induced by recombinant IGKV3-20 on PBMCs from six HCV-positive subjects. To this aim, a supervised pair-wise comparison was performed between stimulated (IGKV3-20 treated) and non-stimulated (PBS) PBMCs.
The analysis at 24 h identified a clustering confirming the different response of samples BE (high) and MML (low) observed in the pattern of cytokine production induced by IGKV3-20 stimulation.
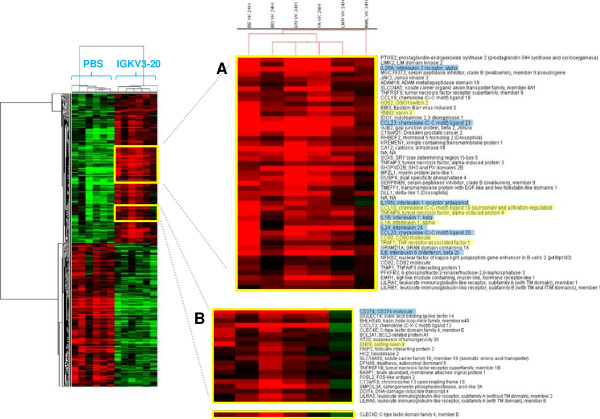
In particular, 394 genes differentially expressed were overall identified (201 up-regulated genes and 193 down-regulated genes) with the strongest gene activation induced in PBMCs of subject BE and the weakest one induced in PBMCs of subject MML (Figure 2). The remaining 4 samples showed an intermediate transcriptional pattern, suggesting the possible identification of high vs. weak responders according to results of simultaneous gene expression data. A list of modulated genes correlated with immunology functions is shown in Table 1.
Figure 2.
Supervised analysis based on IGKV3-20 induction at 24 h. Heat map of gene sets differentially modulated by IGKV3-20 after 24 h. The heat map in (A) shows several genes whose expression is strongly up-regulated in PBMCs of BE. The heat map in (B) shows several genes whose expression is down-regulated in PBMCs of MML after IGKV3-20 stimulation. Genes highlighted in yellow are mostly activated in sample BE. Genes highlighted in blue are activated in all HCV-positive samples, with exception of MML.
Table 1.
Immunology genes modulated by IGKV3-20 at 24 h
| Gene ID | Gene symbol | Gene name | Gene ID | Gene symbol | Gene name |
|---|---|---|---|---|---|
| 7960947 |
A2M |
Alpha-2-macroglobulin |
8154733 |
ACO1 |
Aconitase 1, soluble |
| 8093294 |
CCR2 |
Chemokine receptor 2 |
8071899 |
ADORA2A |
Adenosine A2a receptor |
| 7937508 |
CD151 |
CD151 molecule |
7990818 |
BCL2A1 |
BCL2-related protein A1 |
| 8133876 |
CD36 |
CD36 molecule |
8089771 |
CD80 |
CD80 molecule |
| 7953428 |
CD4 |
CD4 molecule |
7898655 |
CDA |
Cytidine deaminase |
| 8115147 |
CD74 |
MHC, class II invariant chain |
8042942 |
HK2 |
Hexokinase 2 |
| 8082035 |
CD86 |
CD86 molecule |
8025601 |
ICAM1 |
Intercellular adhesion mol. 1 |
| 7966089 |
CMKLR1 |
Chemokine-like receptor 1 |
8097553 |
IL15 |
Interleukin 15 |
| 8115076 |
CSF1R |
Colonystimul. factor 1 recep. |
8054712 |
IL1A |
Interleukin 1, alpha |
| 8065403 |
CST3 |
Cystatin C |
8054722 |
IL1B |
Interleukin 1, beta |
| 8166730 |
CYBB |
Cytochrome b-245, beta polypeptide |
8044574 |
IL1RN |
Interleukin 1 receptor antagonist |
| 8108370 |
EGR1 |
Early growth response 1 |
7931914 |
IL2RA |
Interleukin 2 receptor, alpha |
| 7985268 |
FAH |
Fumarylacetoacetate hydrolase |
8131803 |
IL6 |
Interleukin 6 |
| 816502 |
FBP1 |
Fructose-1,6-bisphosphatase 1 |
8077786 |
IRAK2 |
IL1 receptor-ass. kinase 2 |
| 8165011 |
FCN1 |
Ficolin 1 |
8035351 |
JAK3 |
Janus kinase 3 |
| 8058765 |
FN1 |
Fibronectin 1 |
7973336 |
MMP14 |
Matrix metallpeptidase 14 |
| 7913694 |
FUCA1 |
Fucosidase, alpha-L-1, tissue |
7951217 |
MMP7 |
Matrix metallopeptidase 7 |
| 8129974 |
FUCA2 |
Fucosidase, alpha-L-2, plasma |
8172220 |
NDP |
Norrie disease |
| 8163908 |
GGTA1 |
Glycoprotein, alpha-galactosyltransferase 1 pseudogene |
7930074 |
NFKB2 |
Nuclear factor of kappa light polypeptide gene enhancer in B-cells 2 (p49/p100) |
| 8180346 |
GPX1 |
Glutathione peroxidase 1 |
8075316 |
OSM |
Oncostatin M |
| 8157582 |
GSN |
Gelsonlin |
8062927 |
PI3 |
Peptidase inhibitor 3 |
| 7941936 |
GSTP1 |
Glutathione S-transferase pi 1 |
8150509 |
PLAT |
Plasmin. activator, tissue |
| 8140556 |
HGF |
Hepatocyte growth factor |
8037775 |
PTGIR |
Prostagladin I2 receptor (IP) |
| 8180086 |
HLA-DMA |
MHC, class II, DM alpha |
7922976 |
PTGS2 |
Prostag-endoperox synthase 2 |
| 8180078 |
HLA-DMB |
MHC, class II, DM beta |
7977786 |
SLC7A7 |
Solute carrier fam 7, memb 7 |
| 8180100 |
HLA-DPA1 |
MHC, class II, DP alpha 1 |
8130556 |
SOD2 |
Superoxide dismutase 2 |
| 8179519 |
HLA-DPB1 |
MHC, class II, DP beta 1 |
8066214 |
TGM2 |
Transglutaminase 2 |
| 8179481 |
HLA-DRA |
MHC, class II, DR alpha |
8045688 |
TNFAIP6 |
TNF, alpha-induced protein 6 |
| 8058552 |
IDH1 |
Isocitrate dehydrognase 1 |
7897877 |
TNFRSF1B |
TNF receptor superfam, 1B |
| 7942300 |
IL18BP |
Interleukin 18 binding protein |
7912145 |
TNFRSF9 |
TNF rec. superfam, memb 9 |
| 8070826 |
ITGB2 |
Intergrin, beta 2 |
8163825 |
TRAF1 |
TNF receptor-assoc. factor 1 |
| 8090162 |
ITGB5 |
Integrin, beta 5 |
|
|
|
| 7957023 |
LYZ |
Lysozyme |
|
|
|
| 8127854 |
ME1 |
Malic enzyme 1 |
|
|
|
| 7926451 |
MRC1 |
Mannose receptor, C type 1 |
|
|
|
| 8149448 |
MSR1 |
Macrophage scavenger recept 1 |
|
|
|
| 8076403 |
NAGA |
N-acetylgalactosaminidase, a |
|
|
|
| 8072744 |
NCF4 |
Neutrophil cytosolic factor 4 |
|
|
|
| 8157650 |
PTGS1 |
Prostag-endoperoxsynthase 1 |
|
|
|
| 7920271 |
S100A4 |
S100 calcium binding protein A4 |
|
|
|
| 8136557 |
TBXAS1 |
Thromboxane A synthase 1 |
|
|
|
| 8157524 |
TLR4 |
Toll-like receptor 4 |
|
|
|
| 7924499 | TLR5 | Toll-like receptor 5 |
Down-regulated (left) and up-regulated (right) genes.
The identified genes were further evaluated, to identify specific transcription profiles in the individual subjects. Considering the immune-related genes, heat maps in Figures 2A and B show a very strong up-regulation of specific genes mostly in sample BE (e.g., G0S2, VNN3, CCL18, TNFAIP6, IL-1A, CD80, TRAF1 and SNX9). An additional set of cytokine and cytokine receptor related genes, instead, shows a broad activation in all samples including BE (e.g., IL-1B, IL-6, IL-24, CCL23, CCL20 and IL2RA). The only exception is represented by the subject MML which shows a very limited pattern of gene activation and even down-regulation (Figure 2A and B).
Among the genes more strongly activated in BE, the TNF alpha-induced protein 6 (TNFAIP6), TNF receptor-associated factor 1 (TRAF1), G0/G1 switch gene 2 (G0S2), vanin-3 (VNN3) and sorting nexin 9 (SNX9) possibly suggest the activation of a TNF-mediated inflammatory pattern induced by IGKV3-20. Indeed, both TNFAIP6 and TRAF1 are downstream mediators of TNF signaling [18][19], whereas G0S2 is known to be induced by TNF through the activation of the NFKB complex [20]. Moreover, SNX9 promotes internalization of TNFR [21], whereas VNN3 induction is mediated by Th17/Th1 type cytokines, including TNF-α [22].
Indeed, the pronounced pro-inflammatory pattern induced by IGKV3-20 in PBMCs of BE is more similar to the expression profile elicited in samples from healthy control subjects (Figure 3).
Figure 3.
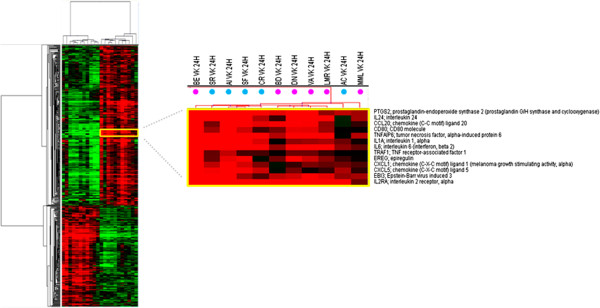
Supervised analysis based on IGKV3-20 induction at 24 h. Heat map of gene sets differentially modulated by IGKV3-20 after 24 h, in HCV-positive (pink dots) and HCV-negative healthy control (blue dots) subjects. The dendrogram at the top of the matrix indicates the degree of similarity between samples.
Furthermore, the strong up-regulation of CCL18 and CD80 molecules confirms the significant activation of circulating APCs by IGKV3-20 (Figures 2A and 3) [10].
On the other hand, PBMCs of subject MML show down-regulation of tumor necrosis factor receptor superfamily member 1B (TNFRSF1B), a mediator of most of the metabolic effects of TNF-α, as well as of interleukin 1 receptor antagonist (IL1RN), whose expression is implicated in the modulation of the inflammasome (Figure 2A and B) [23]. This observation suggests the limited pro-inflammatory effect of TNF-α and IL-1 induced by IGKV3-20 in PBMCs of MML.
Furthermore, C-type lectin domain family 4 member D (CLEC4D), involved in antigen uptake for processing and further presentation to T cells, is strongly down-regulated in PBMCs of MML upon treatment with IGKV3-20, suggesting a possible impairment of the antigen uptake, processing and presentation pathway [24,25].
Unexpectedly, CD274 molecule, which has been speculated to play a major role in suppressing the immune system during autoimmune disease and disease states, including hepatitis, is down-regulated by IGKV3-20 in PBMCs of MML while strongly up-regulated in all the other HCV-positive samples (Figure 2B) [26].
Identification of immune response pattern to IGKV3-20 at “late” time-point
To evaluate a change in the gene expression pattern over-time, the transcriptional profiling analysis was performed also after 6 days (“late”) incubation (Figure 4).
Figure 4.
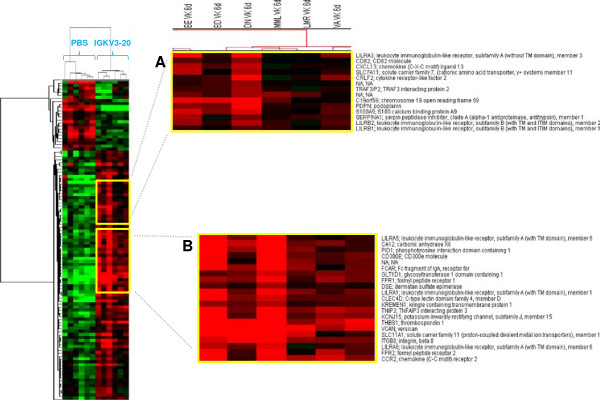
Supervised analysis based on IGKV3-20 induction at 6d. Heat map of gene sets differentially modulated by IGKV3-20 after 6 days. The heat map in (A) shows several genes whose expression is down-regulated in PBMCs of MML. The heat map in (B) shows several genes whose expression is strongly up-regulated in PBMCs of BE.
The comparison analysis at this late time-point confirmed the different clustering of samples BE and MML. Overall, 105 genes differentially expressed were identified, of which 82 up-regulated and 23 down-regulated upon IGKV3-20 stimulation. A list of modulated genes correlated with immunology functions is shown in Table 2. The number of differentially expressed genes at late time-point is drastically reduced compared to the early time-point, but it is still indicative of a late modulation of the immune response by IGKV3-20.
Table 2.
Immunology genes modulated by IGKV3-20 at 6 days
| Gene ID | Gene symbol | Gene name | Gene ID | Gene symbol | Gene name |
|---|---|---|---|---|---|
| 7960947 |
A2M |
Alpha-2-macroglobulin |
8093294 |
CCR2 |
Chemokine receptor 2 |
| 8127854 |
ME1 |
Malic enzyme 1, NADP(+)-dependent, cytosolic |
8063386 |
CEBPB |
CCAAT/enhancer binding protein (C/EBP), beta |
| 7948444 |
TCN1 |
Transcobalamin I |
8031374 |
FCAR |
Fc fragment of IgA, receptor for |
| |
|
|
7921873 |
FCGR3A |
Fc fragment of IgG, low affinity |
| |
|
|
Illa, receptor (CD16a) |
||
| |
|
|
8038899 |
FPR1 |
Formly peptide receptor 1 |
| |
|
|
8042942 |
HK2 |
Hexokinase 2 |
| |
|
|
8047086 |
NAB1 |
NGFI-A binding protein 1 (EGR1 binding protein 1) |
| |
|
|
7920244 |
S100A8 |
S100 calcium binding protein A8 |
| 7982597 | THBS1 | Thrombospodin 1 |
Down-regulated (left) and up-regulated (right) genes.
Among the up-regulated genes CD300E, CLEC4D and FCAR are mostly activated in sample BE (Figure 4B). Moreover, several members of the leukocyte immunoglobulin-like receptor (LILR) family (i.e., LILRA1, LILRA3 and LILRA5) are activated, indicating a relevant role for such innate immune receptors, expressed on monocytes and B cells, in the response elicited by the IGKV3-20 (Figure 4A and B)[27].
Even at 6 days the expression pattern induced by IGKV3-20 in PBMCs of BE strongly resembles the expression profile elicited by the same antigen in a cohort of healthy control subjects, as indicated by the dendrogram at the top of matrix in Figure 5.
Figure 5.
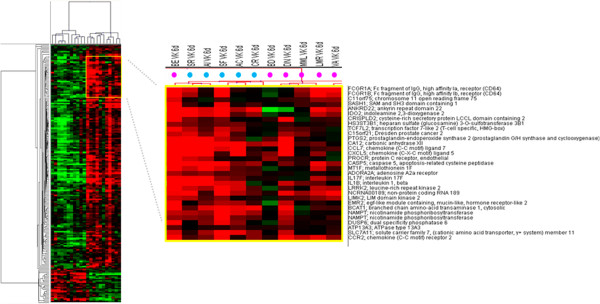
Supervised analysis based on IGKV3-20 induction at 6d. Heat map of gene sets differentially modulated by IGKV3-20 after 6 days in HCV-positive (pink dots) and HCV-negative healthy control (blue dots) subjects. The dendrogram at the top of the matrix indicates the degree of similarity between samples.
On the other hand, immune genes such as LILRA3, CXCL13, CRLF2 and CD82 are even down-regulated in sample MML, suggesting the inefficient delivery of co-stimulatory signals for the T cell receptor (TCR)/CD3 pathway for such a subject (Figure 4A) [28].
Identification of unique immune signatures in PBMCs of BE and MML
A subsequent supervised analysis was performed individually comparing sample BE or MML to all the other samples, and such analysis included all genes modulated by IGKV3-20 without subtracting the basal expression patterns (i.e., PBS).
In regards to PBMCs of subject BE, overall 102 differentially expressed genes were identified at 24 h post stimulation, of which 62 up-regulated and 40 down-regulated genes (data not shown).
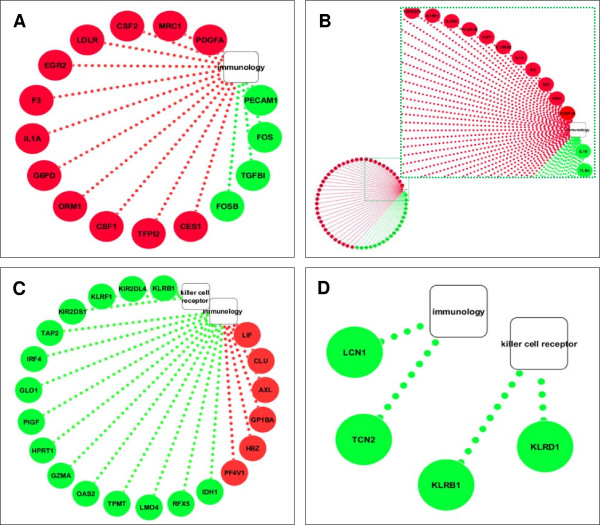
Among the up-regulated genes, several were identified as immunology genes and the resulting immunology network was visualized using Cytoscape (http://www.cytoscape.org) (Figure 6A).
Figure 6.
Unique immune signatures induced in PBMCs of BE and MML. Cytoscape analysis of immunology genes modulated by IGKV3-20 in PBMCs of BE at 24 h (A) and 6d (B). Cytoscape analysis of immunology genes and killer cell receptor genes modulated by IGKV3-20 in PBMCs of MML at 24 h (C) and 6d (D).
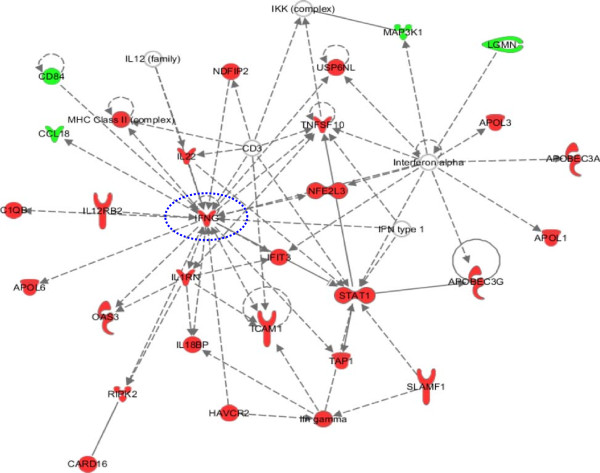
At 6 days post stimulation, overall 617 differentially expressed genes were identified, of which 349 up-regulated and 268 down-regulated genes (data not shown). Interestingly, a unique gene signature was identified, characterized by the up-regulation of Th1 cytokine (i.e., TNF and IFNγ) and cytokine receptor (i.e., IL2RB, IL18R1 and IL12RB2) genes, as well as high-affinity Fc-gamma receptor genes (i.e., FCGR1A and FCGR1B) (Figure 6B). All these genes contribute to the inflammatory response, promoting proliferation of natural killer (NK) cells, as well as T-cells of the Th1 phenotype, strongly suggesting a loop of specific activation of the IFNγ signaling [29], confirmed also by the IPA analysis (Figure 7).
Figure 7.
Ingenuity pathways analysis. IFNγ signaling pathway uniquely activated in PBMCs of subject BE after 6 days stimulation with IGKV3-20.
On the other hand, in PBMCs of subject MML, the analysis identified overall 479 differentially expressed genes at 24 h, whereas 122 genes were differentially expressed at 6 days (data not shown). However, marker genes of the immune response were not identified up-regulated and most of the identified genes were not even annotated.
Interestingly, several immunology and killer-cell-receptor genes (i.e., KLRD1, KLRB1, KLRF1, KIR2DL4, KIR2DS1) were found down-regulated (Figure 6C and D), suggesting a possible impairment of the NK cell function in such a subject [30].
The overall results suggest the identification of molecular markers of individual response to a specific antigen, which could represent a platform for the identification of common predictive signatures of response to vaccination.
Discussion
A major challenge in vaccinology is to predict vaccine efficacy [31-33]. Here, we used a multiparametric systems biology approach to identify gene signatures predictive of an immune response, using an experimental platform based on PBMCs from 6 HCV-positive subjects stimulated ex vivo with the IGKV3-20 light-chain protein, as candidate idiotype vaccine.
The cytokine pattern induced by IGKV3-20 was assessed by ELISA in culture supernatant of stimulated PBMCs, after 24 h or 6 days of incubation (Figure 1).
The results show that the stimulation induces an overall significant production of both Th1 (TNF-α) and Th2 cytokines (IL-6 and IL-10), with a prevalence of the latters. However, specific samples consistently show very different levels of TNF-α and IL-6 production, which are highest for samples BE and DN and lowest for sample MML. These results, although based on a small cohort, indicate a significant difference in the individual response to the same antigen and, in particular, suggest that subject BE is characterized by a relevant pro-inflammatory pattern with the highest levels of IL-6 and TNF-α and the lowest level of the anti-inflammatory IL-10 (Figure 1).
The global gene expression profile of PBMCs stimulated with IGKV3-20 for 24 h and 6 days confirmed such strong differences between BE and MML.
Indeed, in agreement with the cytokine expression pattern, the sample from subject BE shows the highest number of strongly activated genes, whereas the sample from subject MML shows the weakest transcriptional profile (Figures 2 and 4).
In particular, considering immune-related genes up-regulated at 24 h, the activation of a TNF-mediated inflammatory pattern in subject BE induced by IGKV3-20 is strongly suggested (Figure 2A). Moreover, the up-regulation of CCL18 and CD80 molecules suggests a significant activation of circulating APCs in this subject (Figure 2A). On the contrary, several immune-related genes are even down-regulated in PBMCs of MML, suggesting a possible impaired activation of a pro-inflammatory and/or immune response by the antigen.
The strong difference in transcriptional profile of immune-related genes between subjects BE and MML is confirmed also after 6 days of incubation with IGKV3-20 (Figure 4).
Indeed, BE shows the gene activation of several members of the LILR (i.e., LILRA1, LILRA3 and LILRA5) family of immunoreceptors, as well as CD300E, CLEC4D and FCAR (Figure 4A and B).
More importantly, the supervised analysis performed on the pool of genes modulated by IGKV3-20, without subtracting PBS pattern, identified a late transcriptional profile characterized by the up-regulation of TNF, IFNγ, IL2RB, IL18R1, IL12RB2, FCGR1A and FCGR1B genes (Figure 6B), which is unique for subject BE and suggestive of a possible Th1-polarization of the immune response.
In this respect, the pronounced pro-inflammatory pattern induced by IGKV3-20 in PBMCs of BE strongly resembles the expression profile elicited by the same antigen in a cohort of HCV-negative healthy control subjects, as indicated in Figures 3 and 5.
On the contrary, a global down-regulation of immune genes such as killer cell receptor genes in PBMCs of MML may even suggest the inefficient establishment of NK cell-mediated innate immune response to the candidate idiotype vaccine.
Overall, the multiparametric analysis performed on PBMCs loaded ex vivo with the IGKV3-20 candidate idiotypic vaccine shows that the identification of specific gene transcriptional patterns to confirm differences in the immune response evaluated by means of different parameters (e.g., cytokine profile) is feasible.
Indeed, subjects BE and MML are clearly different regardless the parameters used to analyze the ex vivo effect of the IGKV3-20 on their PBMCs, suggesting a possible marked diversity of their responsiveness to such an antigen if administered in vivo.
In conclusion, the present study represents a proof of concept and larger cohort studies will be needed to validate the results. Nevertheless, our results strongly suggest that our ex vivo screening platform is potentially useful to identify “proficient” prediction markers of individual responsiveness to a specific antigen, or classes of antigens (e.g., peptides, proteins, DNA), as well as to guide optimization of vaccine design.
Moreover, systems biology approaches not only allows the scrutiny of a global picture of vaccine-induced immune effect but can be also used to uncover new correlates of vaccine efficacy [34].
Competing interests
The authors declare that they have no competing interests.
Authors’ contributions
AP conducted the statistical analyses and wrote the paper; MT and MLT contributed to the statistical analyses; FMB and LB conceived and designed the study. All authors read and approved the final manuscript.
Contributor Information
Annacarmen Petrizzo, Email: annacarmen.petrizzo@tiscali.it.
Maria Tagliamonte, Email: mariatagliamonte@gmail.com.
Maria Lina Tornesello, Email: ml.tornesello@istitutotumori.na.it.
Franco M Buonaguro, Email: f.buonaguro@istitutotumori.na.it.
Luigi Buonaguro, Email: l.buonaguro@istitutotumori.na.it.
Acknowledgements
The study was funded by Italian Ministry of Research through the project “Alleanza Contro il Cancro” (Contract No. ACC 4). A.P. was Ph.D. student at University of Udine “Biomedical Science and Biotechnology” and recipient of fellowship granted through the project.
References
- Moradpour D, Blum HE. Pathogenesis of hepatocellular carcinoma. Eur J Gastroenterol Hepatol. 2005;17:477–483. doi: 10.1097/00042737-200505000-00002. [DOI] [PubMed] [Google Scholar]
- Zuckerman E, Zuckerman T, Levine AM, Douer D, Gutekunst K, Mizokami M, Qian DG, Velankar M, Nathwani BN, Fong TL. Hepatitis C virus infection in patients with B-cell non-Hodgkin lymphoma. Ann Intern Med. 1997;127:423–428. doi: 10.7326/0003-4819-127-6-199709150-00002. [DOI] [PubMed] [Google Scholar]
- Ferri C, Caracciolo F, Zignego AL, La CL, Monti M, Longombardo G, Lombardini F, Greco F, Capochiani E, Mazzoni A. Hepatitis C virus infection in patients with non-Hodgkin’s lymphoma. Br J Haematol. 1994;88:392–394. doi: 10.1111/j.1365-2141.1994.tb05036.x. [DOI] [PubMed] [Google Scholar]
- Ferri C, Longombardo G, La CL, Greco F, Lombardini F, Cecchetti R, Cagianelli MA, Marchi S, Monti M, Zignego AL. Hepatitis C virus chronic infection as a common cause of mixed cryoglobulinaemia and autoimmune liver disease. J Intern Med. 1994;236:31–36. doi: 10.1111/j.1365-2796.1994.tb01116.x. [DOI] [PubMed] [Google Scholar]
- De Re V, Caggiari L, Simula MP, De VS, Sansonno D, Dolcetti R. B-cell lymphomas associated with HCV infection. Gastroenterology. 2007;132:1205–1207. doi: 10.1053/j.gastro.2007.02.009. [DOI] [PubMed] [Google Scholar]
- Hollander N. Current vaccination strategies for the treatment of B-cell lymphoma and multiple myeloma. Crit Rev Immunol. 2009;29:399–418. doi: 10.1615/CritRevImmunol.v29.i5.30. [DOI] [PubMed] [Google Scholar]
- Rosenberg SA. Raising the bar: the curative potential of human cancer immunotherapy. Sci Transl Med. 2012;4:127ps8. doi: 10.1126/scitranslmed.3003634. [DOI] [PMC free article] [PubMed] [Google Scholar]
- Martorelli D, Guidoboni M, De RV, Muraro E, Turrini R, Merlo A, Pasini E, Caggiari L, Romagnoli L, Spina M, Mortarini R, Gasparotto D, Mazzucato M, Carbone A, Rosato A, Anichini A, Dolcetti R. IGKV3 proteins as candidate “off-the-shelf” vaccines for kappa-light chain-restricted B-cell non-Hodgkin lymphomas. Clin Cancer Res. 2012;18:4080–4091. doi: 10.1158/1078-0432.CCR-12-0763. [DOI] [PubMed] [Google Scholar]
- Buonaguro L, Petrizzo A, Tornesello M, Napolitano M, Martorelli D, Castello G, Beneduce G, De RA, Perrella O, Romagnoli L, Sousa V, De RV, Dolcetti R, Buonaguro FM. Immune signatures in human PBMCs of idiotypic vaccine for HCV-related lymphoproliferative disorders. J Transl Med. 2010;8:18. doi: 10.1186/1479-5876-8-18. [DOI] [PMC free article] [PubMed] [Google Scholar]
- Petrizzo A, Tornesello ML, Napolitano M, D’Alessio G, Salomone MA, Dolcetti R, De RV, Wang E, Marincola FM, Buonaguro FM, Buonaguro L. Multiparametric analyses of human PBMCs loaded ex vivo with a candidate idiotype vaccine for HCV-related lymphoproliferative disorders. PLoS One. 2012;7:e44870. doi: 10.1371/journal.pone.0044870. [DOI] [PMC free article] [PubMed] [Google Scholar]
- Aricò E, Wang E, Tornesello ML, Tagliamonte M, Lewis GK, Marincola FM, Buonaguro FM, Buonaguro L. Immature monocyte derived dendritic cells gene expression profile in response to virus-like particles stimulation. J Transl Med. 2005;3:45. doi: 10.1186/1479-5876-3-45. [DOI] [PMC free article] [PubMed] [Google Scholar]
- Buonaguro L, Monaco A, Arico E, Wang E, Tornesello ML, Lewis GK, Marincola FM, Buonaguro FM. Gene expression profile of peripheral blood mononuclear cells in response to HIV-VLPs stimulation. BMC Bioinforma. 2008;9(2):S5. doi: 10.1186/1471-2105-9-S2-S5. [DOI] [PMC free article] [PubMed] [Google Scholar]
- Buonaguro L, Tornesello ML, Gallo RC, Marincola FM, Lewis GK, Buonaguro FM. Th2 polarization in peripheral blood mononuclear cells from human immunodeficiency virus (HIV)-infected subjects, as activated by HIV virus-like particles. J Virol. 2009;83:304–313. doi: 10.1128/JVI.01606-08. [DOI] [PMC free article] [PubMed] [Google Scholar]
- Querec TD, Akondy RS, Lee EK, Cao W, Nakaya HI, Teuwen D, Pirani A, Gernert K, Deng J, Marzolf B, Kennedy K, Wu H, Bennouna S, Oluoch H, Miller J, Vencio RZ, Mulligan M, Aderem A, Ahmed R, Pulendran B. Systems biology approach predicts immunogenicity of the yellow fever vaccine in humans. Nat Immunol. 2009;10:116–125. doi: 10.1038/ni.1688. [DOI] [PMC free article] [PubMed] [Google Scholar]
- Gaucher D, Therrien R, Kettaf N, Angermann BR, Boucher G, Filali-Mouhim A, Moser JM, Mehta RS, Drake DR III, Castro E, Akondy R, Rinfret A, Yassine-Diab B, Said EA, Chouikh Y, Cameron MJ, Clum R, Kelvin D, Somogyi R, Greller LD, Balderas RS, Wilkinson P, Pantaleo G, Tartaglia J, Haddad EK, Sekaly RP. Yellow fever vaccine induces integrated multilineage and polyfunctional immune responses. J Exp Med. 2008;205:3119–3131. doi: 10.1084/jem.20082292. [DOI] [PMC free article] [PubMed] [Google Scholar]
- Eisen MB, Spellman PT, Brown PO, Botstein D. Cluster analysis and display of genome-wide expression patterns. Proc Natl Acad Sci U S A. 1998;95:14863–14868. doi: 10.1073/pnas.95.25.14863. [DOI] [PMC free article] [PubMed] [Google Scholar]
- Ross DT, Scherf U, Eisen MB, Perou CM, Rees C, Spellman P, Iyer V, Jeffrey SS, de RM V, Waltham M, Pergamenschikov A, Lee JC, Lashkari D, Shalon D, Myers TG, Weinstein JN, Botstein D, Brown PO. Systematic variation in gene expression patterns in human cancer cell lines. Nat Genet. 2000;24:227–235. doi: 10.1038/73432. [DOI] [PubMed] [Google Scholar]
- Milner CM, Higman VA, Day AJ. TSG-6: a pluripotent inflammatory mediator? Biochem Soc Trans. 2006;34:446–450. doi: 10.1042/BST0340446. [DOI] [PubMed] [Google Scholar]
- Ha H, Han D, Choi Y. TRAF-mediated TNFR-family signaling. Curr Protoc Immunol. 2009;11:Unit11. doi: 10.1002/0471142735.im1109ds87. [DOI] [PubMed] [Google Scholar]
- Heckmann BL, Zhang X, Xie X, Liu J. The G0/G1 switch gene 2 (G0S2): regulating metabolism and beyond. Biochim Biophys Acta. 1831;2013:276–281. doi: 10.1016/j.bbalip.2012.09.016. [DOI] [PMC free article] [PubMed] [Google Scholar]
- Worby CA, Dixon JE. Sorting out the cellular functions of sorting nexins. Nat Rev Mol Cell Biol. 2002;3:919–931. doi: 10.1038/nrm974. [DOI] [PubMed] [Google Scholar]
- Jansen PA, Kamsteeg M, Rodijk-Olthuis D, van Vlijmen-Willems IM, de Jongh GJ, Bergers M, Tjabringa GS, Zeeuwen PL, Schalkwijk J. Expression of the vanin gene family in normal and inflamed human skin: induction by proinflammatory cytokines. J Invest Dermatol. 2009;129:2167–2174. doi: 10.1038/jid.2009.67. [DOI] [PubMed] [Google Scholar]
- Fairfax BP, Davenport EE, Makino S, Hill AV, Vannberg FO, Knight JC. A common haplotype of the TNF receptor 2 gene modulates endotoxin tolerance. J Immunol. 2011;186:3058–3065. doi: 10.4049/jimmunol.1001791. [DOI] [PMC free article] [PubMed] [Google Scholar]
- Graham LM, Gupta V, Schafer G, Reid DM, Kimberg M, Dennehy KM, Hornsell WG, Guler R, Campanero-Rhodes MA, Palma AS, Feizi T, Kim SK, Sobieszczuk P, Willment JA, Brown GD. The C-type lectin receptor CLECSF8 (CLEC4D) is expressed by myeloid cells and triggers cellular activation through Syk kinase. J Biol Chem. 2012;287:25964–25974. doi: 10.1074/jbc.M112.384164. [DOI] [PMC free article] [PubMed] [Google Scholar]
- Arce I, Martinez-Munoz L, Roda-Navarro P, Fernandez-Ruiz E. The human C-type lectin CLECSF8 is a novel monocyte/macrophage endocytic receptor. Eur J Immunol. 2004;34:210–220. doi: 10.1002/eji.200324230. [DOI] [PubMed] [Google Scholar]
- Amarnath S, Mangus CW, Wang JC, Wei F, He A, Kapoor V, Foley JE, Massey PR, Felizardo TC, Riley JL, Levine BL, June CH, Medin JA, Fowler DH. The PDL1-PD1 axis converts human TH1 cells into regulatory T cells. Sci Transl Med. 2011;3:111ra120. doi: 10.1126/scitranslmed.3003130. [DOI] [PMC free article] [PubMed] [Google Scholar]
- Borges L, Hsu ML, Fanger N, Kubin M, Cosman D. A family of human lymphoid and myeloid Ig-like receptors, some of which bind to MHC class I molecules. J Immunol. 1997;159:5192–5196. [PubMed] [Google Scholar]
- Lagaudriere-Gesbert C, Lebel-Binay S, Wiertz E, Ploegh HL, Fradelizi D, Conjeaud H. The tetraspanin protein CD82 associates with both free HLA class I heavy chain and heterodimeric beta 2-microglobulin complexes. J Immunol. 1997;158:2790–2797. [PubMed] [Google Scholar]
- Mata-Espinosa DA, Hernandez-Pando R. Gamma interferon: basics aspects, clinic significance and terapeutic uses. Rev Invest Clin. 2008;60:421–431. [PubMed] [Google Scholar]
- Rajalingam R. Overview of the killer cell immunoglobulin-like receptor system. Methods Mol Biol. 2012;882:391–414. doi: 10.1007/978-1-61779-842-9_23. [DOI] [PubMed] [Google Scholar]
- Buonaguro L, Wang E, Tornesello ML, Buonaguro FM, Marincola FM. Systems biology applied to vaccine and immunotherapy development. BMC Syst Biol. 2011;5:146. doi: 10.1186/1752-0509-5-146. [DOI] [PMC free article] [PubMed] [Google Scholar]
- Berzofsky JA. Improving immunotherapy: revisiting the immunologist’s little secret. Sci Transl Med. 2012;4:120fs4. doi: 10.1126/scitranslmed.3003658. [DOI] [PMC free article] [PubMed] [Google Scholar]
- Ali OA, Emerich D, Dranoff G, Mooney DJ. In situ regulation of DC subsets and T cells mediates tumor regression in mice. Sci Transl Med. 2009;1:8ra19. doi: 10.1126/scitranslmed.3000359. [DOI] [PMC free article] [PubMed] [Google Scholar]
- Rappuoli R, Medaglini D. ADITEC: joining forces for next-generation vaccines. Sci Transl Med. 2012;4:128cm4. doi: 10.1126/scitranslmed.3003826. [DOI] [PubMed] [Google Scholar]


