

Abstract
We have previously shown that rats trained in a mixed-interval peak procedure (tone = 4s, light = 12s) respond in a scalar manner at a time in between the trained peak times when presented with the stimulus compound (Swanton & Matell, 2011). In our previous work, the two component cues were reinforced with different probabilities (short = 20%, long = 80%) to equate response rates, and we found that the compound peak time was biased toward the cue with the higher reinforcement probability. Here, we examined the influence that different reinforcement probabilities have on the temporal location and shape of the compound response function. We found that the time of peak responding shifted as a function of the relative reinforcement probability of the component cues, becoming earlier as the relative likelihood of reinforcement associated with the short cue increased. However, as the relative probabilities of the component cues grew dissimilar, the compound peak became non-scalar, suggesting that the temporal control of behavior shifted from a process of integration to one of selection. As our previous work has utilized durations and reinforcement probabilities more discrepant than those used here, these data suggest that the processes underlying the integration/selection decision for time are based on cue value.
Keywords: Time Perception, Rats, Multimodal
Life unfolds in time, and the perception of time in the seconds to minutes range (i.e., interval timing) is essential to an animal’s survival (Gallistel, 1990). Given the importance of temporal expectation, some have proposed that temporal perception is carried out by neural circuits dedicated to processing specific sensory/motor information (Ivry & Spencer, 2004). In support of this notion, Shuler and Bear (2006) have demonstrated that firing rates in primary visual cortex encode light-reward delays. In contrast, evidence of cross-modal transfer of duration information (Meck & Church, 1982a, 1982b; Roberts, 1982; Tees, 1999) suggests that inputs from sensory structures are sent to a central structure that is responsible for generating temporally controlled behavior. One approach that might provide some traction on this argument is assessing how subjects respond when temporal expectations associated with different modality cues conflict with one another.
Recent work from our lab has demonstrated a behavioral phenomenon, temporal memory averaging, in which two different temporal memories are combined into a single expectation (Swanton, Gooch, & Matell, 2009; Swanton & Matell, 2011). Specifically, rats were trained on a dual-duration, dual-modality, peak-interval procedure in which one modality stimulus (e.g., a tone) indicated probabilistic reinforcement availability after a short duration (e.g., 10s), whereas a different modality stimulus (e.g., a house light) indicated probabilistic reinforcement availability after a long duration (e.g., 20s). Following training, rats were tested under extinction contingencies with the simultaneous compound stimulus (i.e., tone + light). Remarkably, robust peak-shaped responding occurred at a time between the two criterion durations (i.e., around 16s), despite subjects never being reinforced at this time. Importantly, this compound peak exhibited the normal Gaussian shape, and clear superimposition of all three peak functions was seen after normalizing response rate and peak time, indicating scalar variability of the compound peak. These data were interpreted as resulting from the retrieval of the component temporal memories, which were then integrated into a single expectation that was timed in a normal manner. As it relates to the above question about the neural processes underlying temporal control, this finding of scalar averaging is largely incompatible with a temporally modulated output signal from visual and auditory cortices, as the sum of these temporal output signals (i.e., the sum of the two individual peak functions) would not be scalar.
Our initial observation of temporal memory averaging occurred in the context of an electrophysiological investigation (Matell, Shea-Brown, Gooch, Wilson, & Rinzel, 2011), and the experimental design required that response rates for the two cues be equal. Because longer durations produce diminished peak rates when tested within subjects, we utilized a higher reinforcement probability for the long duration (50% - 20s), than for the short duration (25% - 10s) to equate peak rates. In subsequent work exploring this phenomenon with different durations and duration ratios, we continued to equate incentive value of the cues by offsetting the longer reinforcement delay with an increased reinforcement probability. In all of these studies, the peak time on compound trials fell closer to the long criterion duration than the short criterion duration. Remarkably, post-hoc analyses suggested that the time of the compound peak could be accurately predicted by a weighted average of the criterion durations, in which the relative probability of reinforcement for each cue served as the weights. However, in all of these experiments, the reinforcement probabilities co-varied with the duration ratios, and therefore this relation might have been fortuitous.
The purpose of the present study was to evaluate whether rats utilize the reinforcement probabilities of the component cues as weights when integrating discrepant temporal memories. To this end, we directly varied the reinforcement probabilities of the component cues while keeping the criterion durations constant. In this way, any differences in peak times on compound trials would be tied to the reinforcement probabilities rather than to differences in absolute durations or duration ratios.
Experiment 1
Method
Subjects and Apparatus
Thirty adult male Sprague-Dawley rats (Rattus norvegicus; Harlan, Indianapolis, IN) approximately 6 months of age at the beginning of the experiment were used. Rats were housed in pairs with a 12 hr light:dark cycle (lights on at 8 a.m.). All behavioral testing was conducted during the light phase. The rats had ad libitum access to drinking water, but were kept on a restricted feeding schedule (Harlan 2019 Rat Diet) to maintain their body weights at 85–90% of free-feeding levels, adjusted for growth. Rodent chow was provided immediately following each daily session. Training and testing took place in 10 standard operant-conditioning chambers (30.5 × 25.4 × 30.5 cm, Coulbourn Instruments, Allentown, PA). The sides of the chambers were ventilated Plexiglas, and the front and back walls and ceiling were aluminum. The floor was composed of stainless steel bars. A pellet dispenser delivered 45-mg sucrose pellets (Formula F; Noyes Precision, Lancaster, NH) to a food magazine on the front wall of the chamber. Three nosepoke response apertures (2.5 cm opening diameter) with photobeam detection circuits were placed on the back wall of the chamber, and had yellow and green LED cue lights in their interior. The operant chambers were also equipped with an 11 lux houselight on the front wall of the chamber and a seven-tone audio generator which could play 95 dB tones through a speaker on the back wall of the chamber. Stimulus control and data acquisition were achieved using a standard operant-conditioning control program (Graphic State, Coulbourn Instruments), with a temporal resolution of 20 msec.
Procedure
The rats progressed through a sequence of nosepoke training, fixed-interval (FI) training with two stimuli/durations, peak-interval (PI) training with two stimuli/durations, and compound testing. Compound testing was identical to PI training, but with the addition of non-reinforced compound stimulus presentations on a small proportion of the trials. The discriminative stimuli were the houselight and a 4 kHz tone, and the modality-duration relationship was counterbalanced in each group (tone short/light long; light short/tone long). The short duration was 4s and the long duration was 12s. Upon reaching PI training, the rats were randomly divided into three groups with each group having different reinforcement probabilities in terms of the ratio of FI trials to PI trials. One group (20%/80%) was trained with a 20% reinforcement probability for the short duration and an 80% reinforcement probability for the long duration (2 short FI: 8 short PI; 8 long FI: 2 long PI), as this ratio led to equivalent mean response rates in our previous work (Swanton & Matell, 2011). Group 10%/90% was trained with a 10% reinforcement probability for the short duration and a 90% reinforcement probability for the long duration (1 short FI: 9 short PI; 9 long FI: 1 long PI). Group 50%/50% was trained with a 50% reinforcement probability for both durations (5 short FI: 5 short PI; 5 long FI: 5 long PI). Short and long trials were presented in equal numbers. Rats were run five days per week at approximately the same time each day. Two days before training commenced, rats were given twenty 45mg sucrose pellets in their home cage to acclimate them to the sucrose pellets.
Nosepoke training (5 sessions)
Rats were reinforced with a sucrose pellet on a fixed ratio 1 schedule on the center nosepoke aperture. A 2s “timeout” followed the delivery of each pellet to prevent subjects from breaking the photobeam multiple times in rapid succession (therein possibly jamming the food delivery port). Training continued until rats earned 60 reinforcements on two sequential sessions.
Fixed-interval training (10 sessions)
Trials commenced with the presentation of either the “short” stimulus (either a 4 kHz steady tone or illumination of the houselight; counter-balanced) or the “long” stimulus (the stimulus not used for the short duration). The first nosepoke entry into the center nosepoke aperture after the associated criterion duration elapsed was reinforced and the stimulus terminated. Responses made prior to the criterion duration had no programmed consequences. A variable, uniformly distributed 60–90s inter-trial interval (ITI) separated trials. Sessions lasted 2 hrs in this and all subsequent procedures.
Peak-interval training (45 sessions)
PI training was identical to FI training, except that non-reinforced probe trials were presented in addition to the reinforced trials. Probe trials were 3–4 times the criterion duration for the corresponding signal and terminated independently of behavior. The probability of reinforcement was as described above. Trial type (short versus long) was selected at random with replacement.
Compound testing (5 sessions)
Compound testing was identical to PI training, with the addition of compound stimulus probe trials composing 20% of all trials. On these trials, both the 4 kHz tone and the houselight commenced simultaneously, and terminated without reinforcement in a response-independent manner at a duration equivalent to the probe length for the long cue.
Analysis
The mean response rate (discrete nosepoke infrared beam breaks) as a function of signal duration on probe trials was computed using 1s bins. The data from each rat were pooled over 5 sessions to obtain sufficient trials to generate peak functions. Due to the skewed pattern of responding sometimes seen on compound trials (see results), rather than using a standard symmetrical Gaussian to describe the data, we fit (curve fitting package of MATLab, Cambridge, MA) the pooled responses with the dual asymmetric sigmoid function, Y = Y0 + A * (1/(1+exp(−1*((x-B+C/2)/D)))) * (1− (1/(1+exp(−1*((x-B−C/2)/E))))), with a lower bound of 0.25 for parameters D and E to prevent occasional fits with a sharp triangular shape (e.g., Swanton & Matell, 2011). This function captured the shape of the raw data irrespective of its skew (mean R2 = 0.84, 0.97, 0.93 for the short, compound and long response functions, respectively). The maximal height of each fitted function was taken as the peak rate, and the time of the peak rate (i.e., the mode of the function) was taken as the peak time. The width at half maximal responding served as a measure of peak spread. Because single trials analyses are quite sensitive to non-temporally controlled responding (Matell, Bateson, & Meck, 2006), and this sensitivity is heightened when response rates are low (as they were in the present study), we decided to supplement this analytic method by using the times at which average responding reached and declined to half-maximal levels, the left and right half max times, as proxies for the average start and stop times, respectively. To assess the asymmetry of the functions, we computed the proportion of the area under the curve that fell to the right of the peak time.
Single Trial Analysis
Single trial analyses were conducted using a variant of the method developed by Gallistel, Fairhurst, and Balsam (2004), and utilized for the peak procedure by Taylor, Horvitz, and Balsam (2007). Briefly, this algorithm steps forward in time through the cumulative response function for each trial and assesses whether the odds that a change in the rate of responding has occurred passes a specified threshold. Once a rate change is detected, the algorithm steps forward using this new rate, and assesses whether another rate change is evident. This approach is preferable to that used previously (e.g., Church, Meck, & Gibbon, 1994) in that it doesn’t assume a particular response pattern, and can identify multiple rate changes, which could potentially occur on compound trials. As increasing the odds required to identify a rate transition will diminish the number of rate transitions identified, we ran the algorithm on each trial with a range of odds from 20:1 (p<0.05) to 1000:1 (p<0.001). We then utilized the corrected Akaike Information Criterion (AICc) to evaluate the degree to which the identified step pattern accurately characterized the data while simultaneously minimizing the addition of new parameters (Burnham & Anderson, 2002). To minimize the contribution of outliers, the median start and stop times for each rat were used in the statistical analyses.
Statistical analysis
The parameters obtained from the fitted functions and single trial analyses were entered into a mixed-factors ANOVA in which duration (short, compound, long) served as a within-subjects factor, and the reinforcement percentage (10%/90%, 20%/80%, 50%/50%) served as a between-subjects factor. The modality-duration relationship (tone-short/light-long, light-short/tone-long) served as an additional between-subjects factor.
Results
The majority of subjects in all groups showed typical peak functions for both the short and long cue, peaking around the criterion durations of 4s and 12s. However, presumably due to the low number of reinforced short trials, a subset of rats in the 10%/90% and 20%/80% groups had extremely low response rates and/or unusually shaped response functions on short cue trials that prevented adequate fits of the data. Because the primary goal of this study was to examine the effect of reinforcement probability on compound responding, which we have previously found to result from a combinatorial operation on the trained durations, subjects whose response functions for the trained durations failed to show a peak shape and/or temporal control were removed from further analyses. This restriction led to the removal of four rats from the 10%/90% group (two from each modality-duration subgroup), two rats from the 20%/80% group (one from each modality-duration subgroup), and one rat in the 50%/50% group (light-short subgroup). While this resulted in a 23% reduction in subjects, it is important to note that this restriction was not based upon the data of primary interest, the response function generated on compound trials.
Figure 1 shows the rate-normalized peak functions for each cue as a function of the reinforcement percentage (rows), and the modality-duration relationship (columns). As can be seen in the figure, the compound peak function became earlier as the reinforcement probability for the short cue increased. This impression was confirmed by a repeated measures ANOVA on the peak times, which revealed the expected main effect of duration, an effect of probability, as well as their interaction [F(4,34) = 3.32, p<0.01]. There were no interactions of the modality-duration relationship with duration or probability. To probe the duration x probability interaction, the peak times for each duration were examined separately. No significant effects were found for either the short or long component durations. In contrast, the compound cue peak time varied as a function of reinforcement probability [F(2,17) = 8.24, p<0.01]. Polynomial contrasts demonstrated a significant linear trend (p<0.01), such that peak times decreased as the probability of reinforcement for the short duration increased. In addition, there was a trend for an impact of modality on compound peak times [F(1,17) = 3.96, p=0.063], as the light-short rats peaked earlier than the tone-short rats. Intriguingly, visual inspection of the response functions suggested that the light-short rats in the 50%/50% group tended to have compound response functions that overlapped the short component duration, whereas the compound peak function of the tone-short rats fell in-between the component durations. Indeed, the mean compound peak time in the 50%/50% light short group was actually earlier than the mean short peak time. This impression was supported by paired t-tests, showing a significant difference between the short and compound peak times in the tone-short, but not light-short rats in this group.
Figure 1.

Average peak functions for the short, compound, and long cues across modality-duration groups (columns) and reinforcement probability groups (rows).
Relative peak spread (i.e., peak spread/peak time) is a measure of scalar timing, or timescale-invariance, and is displayed in Figure 2. A repeated measures ANOVA on relative spread revealed a main effect of duration, which was moderated by modality [F(4,34) = 4.28, p<0.05]. The modality interaction resulted from relative spreads of the compound function being larger in the light-short subgroup than the tone-short subgroup [F(1,17) = 5.63, p<0.05], whereas there was no modality effect for the component cues. Probing this effect further by analyzing each modality group separately revealed that the significant effect of duration was moderated by probability in the tone-short rats [F(4,18) = 3.84, p<0.05]. While post-hoc tests failed to reveal the source of this effect, polynomial contrasts indicated that the relative width of the compound cue increased in a linear manner as the reinforcement probability for the short cue increased (p<0.05), whereas these changes were not seen for the component durations. In contrast, in the light-short rats, there was an effect of duration, but no impact of probability. In these rats, the compound function was significantly broader than the long function (p<0.05), with a weak trend for it to be broader than the short function (p= 0.079).
Figure 2.

Relative spread, peak rate, asymmetry, and times of half-maximal responding as a function of modality-duration relationship (columns), and reinforcement probability (abscissa).
Peak rates for the three cues are shown in Figure 2. A repeated measures ANOVA revealed a main effect of duration, as well as a duration x probability [F(4,34) = 13.88, p<0.001], duration x modality [F(2,34) = 4.15, p<0.05], and the 3-way, duration x probability x modality interaction [F(4,34) = 3.64, p<0.05]. As can be seen, responding for the short cue was particularly weak in the 10%/90% groups for both modalities, and increased in rate as a function of the reinforcement probability. This impression was confirmed by an ANOVA conducted on the short duration rates alone, which showed a main effect for reinforcement probability [F(2,17) = 8.98, p<0.005], but no effect of modality, nor an interaction. In contrast, responding to the long cue was generally robust, and no significant differences were seen. Responding to the compound cue differed as a function of probability, modality and their interaction [F(2,17) = 6.75, p<0.01]. An ANOVA on each modality separately revealed an effect of probability in the light-short/tone-long [F(2,10) = 23.52, p<0.001], but no effect in the tone-short/light-long group [F<1].
Although masked in the group averages, compound response functions were frequently asymmetrical in individual subjects. We computed the degree of asymmetry in these functions by computing the proportion of the area under the curve that fell to the right of the peak time. A repeated measures ANOVA on this asymmetry index revealed an effect of duration [F(2,34) = 7.34, p<0.01], as the compound functions were more positively skewed than either of the component functions (Figure 2). To examine this asymmetry in more detail, we computed the time at which the response function reached, and diminished to, half-maximal levels, which we refer to as the half left and half right times (Figure 2). A repeated measures ANOVA on half left times revealed significant main effects of duration and probability, as well as the duration x probability interaction [F(4,34) = 3.74, p<0.01] and duration x modality [F(2,34) = 5.01, p<0.05] interaction. Probing these effects by analyzing each duration separately revealed that compound and long half left times got earlier as the probability of reinforcement for the short duration increased, whereas short half-left times varied in a non-systematic manner with duration. Compound half left times were also earlier in light-short rats than tone-short rats (p<0.05). Half right times also had main effects of duration and probability, as well as their interaction [F(4,34) = 12.22, p<0.001]. Compound half right times became earlier as a function of the long reinforcement probability [F(2,17) = 13.53, p<0.05], whereas no differences were seen in half right times for the short or long durations.
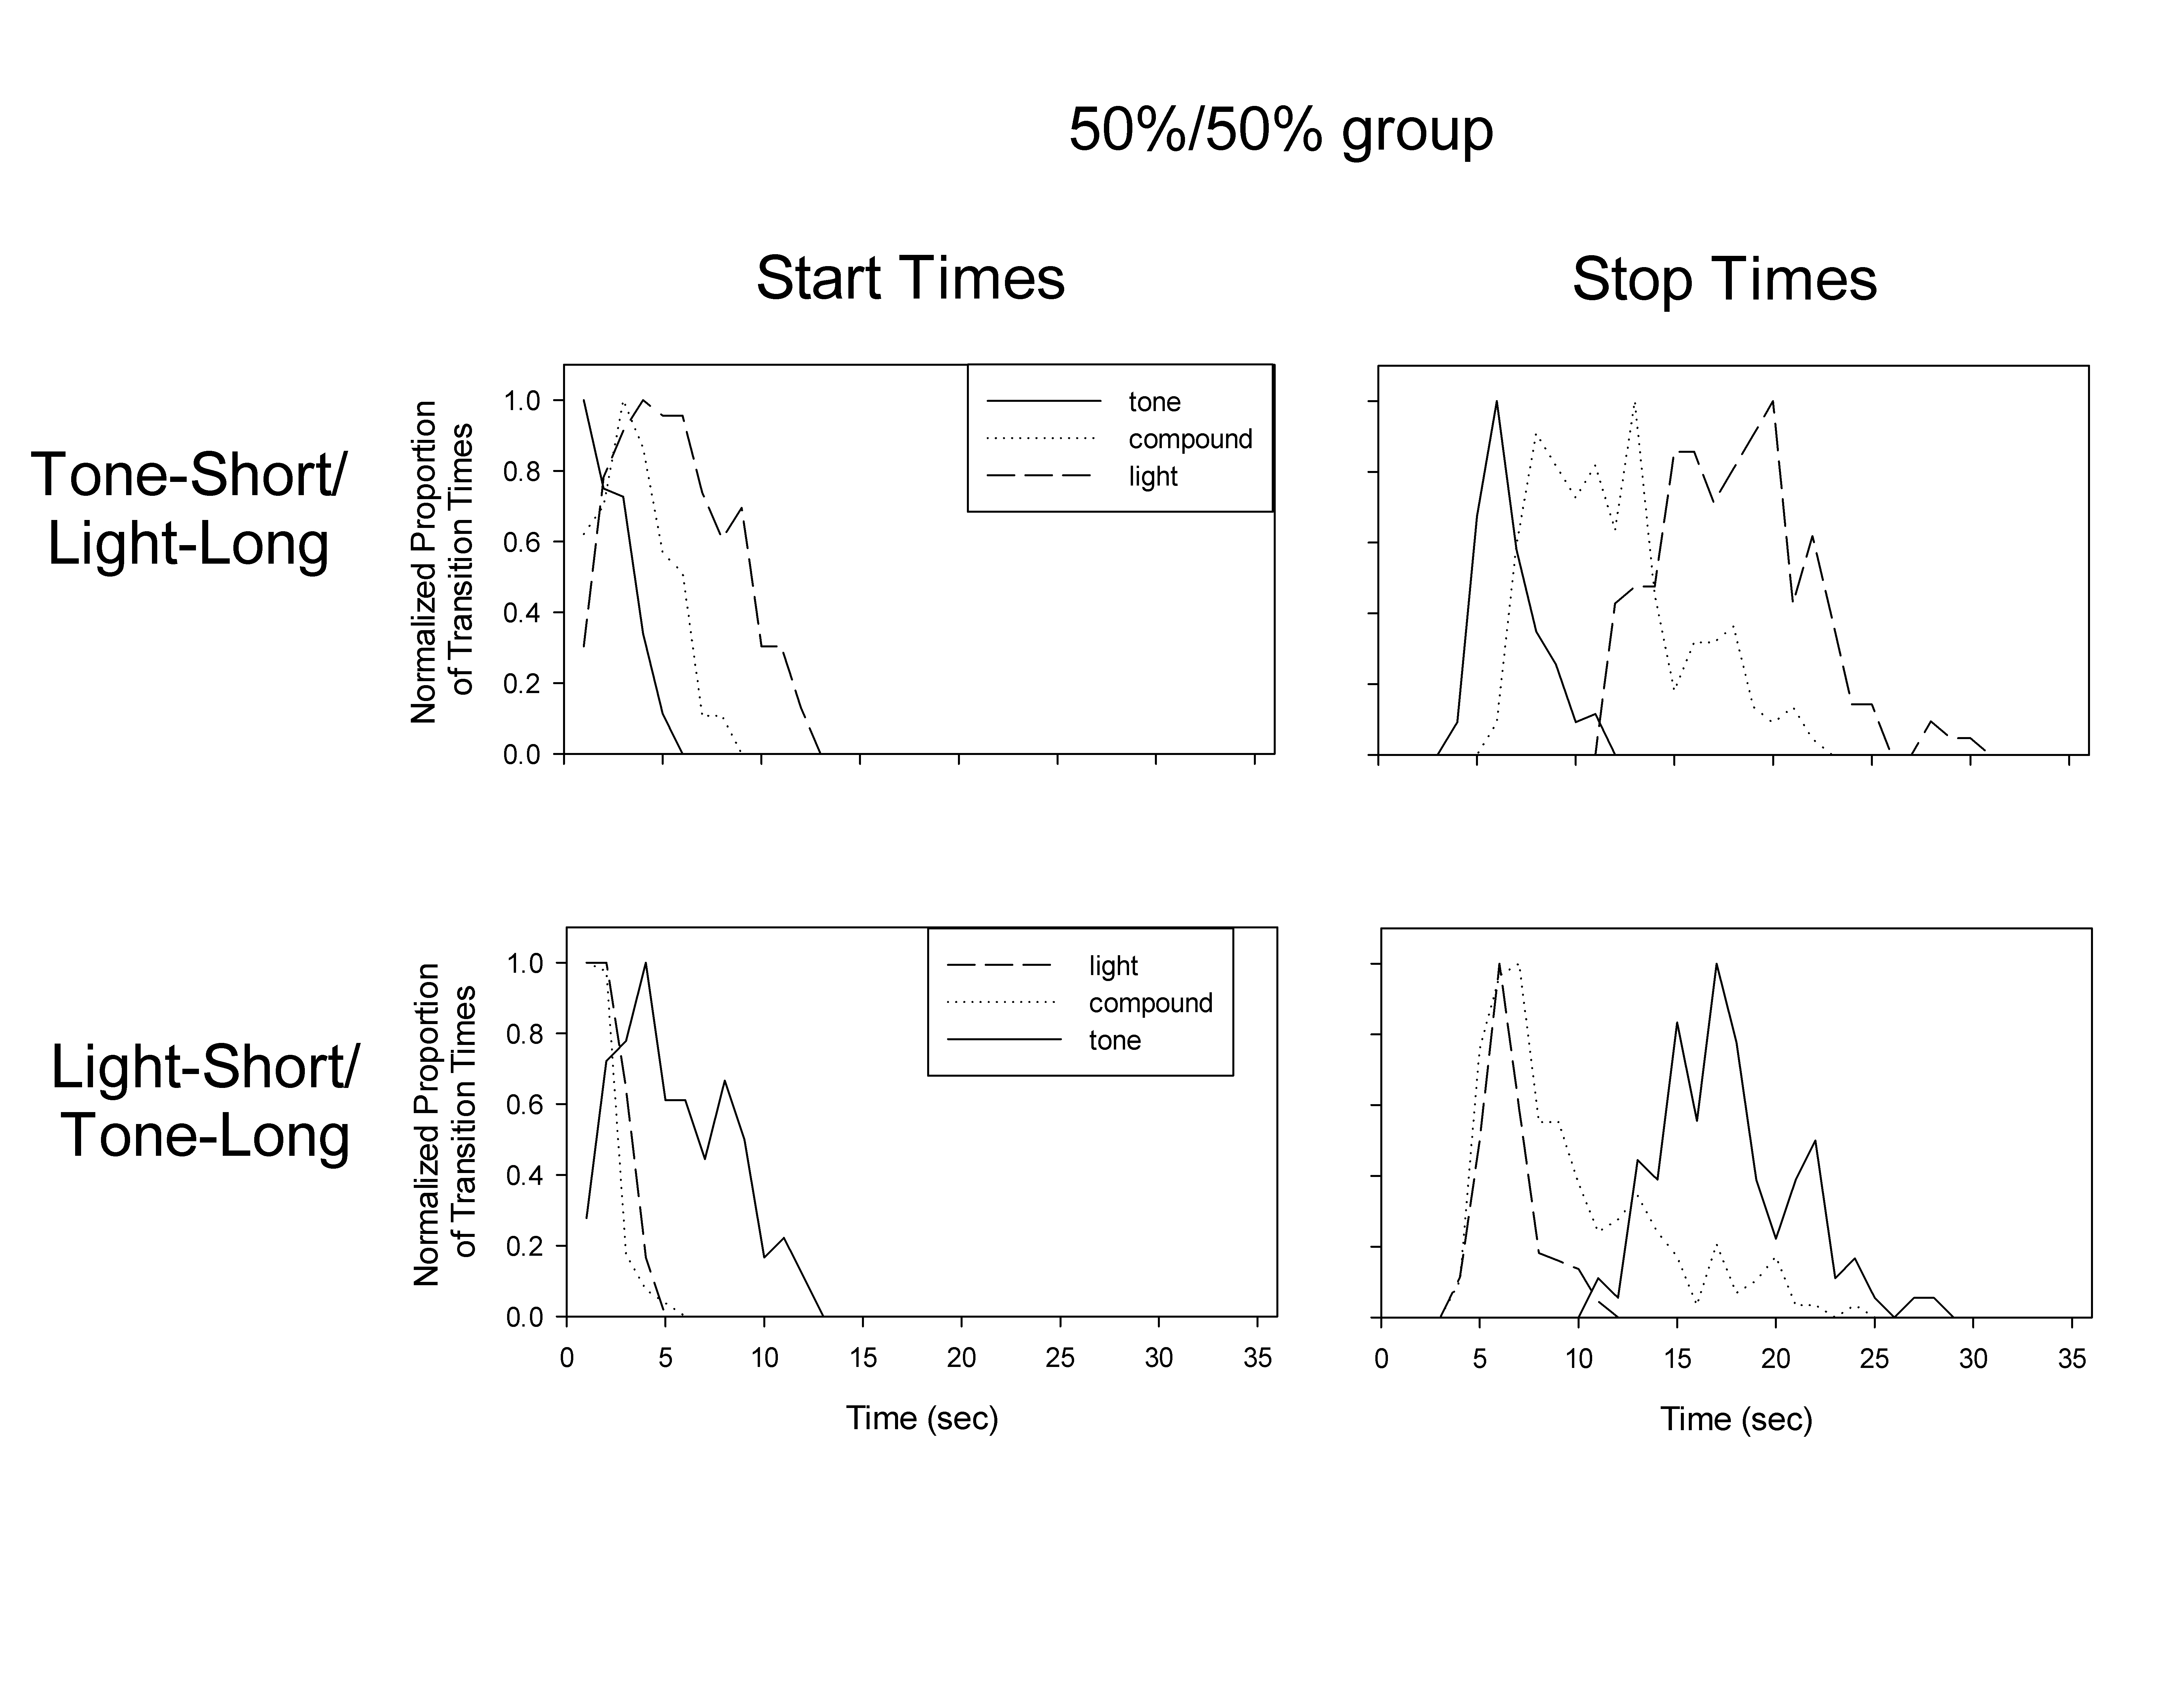
The rate change detection algorithm used to analyze the pattern of responding on single trials identified two response rate changes (i.e., low-high-low) as the most common pattern of responding, composing 49%, 77%, and 79% of short, compound and long trials, respectively. The low percentage of short trials that were best fit by a two-step function primarily resulted from there being a substantial number of trials (40%) that provided insufficient evidence of a rate change, principally due to the rats only making a single response. This was particularly true for the 10%/90% groups, in which the average number of responses per trial was 1.7 +/− 1.1. As such, these single trial statistics should be interpreted conservatively. Only 8% of the compound trials were best characterized by a response pattern more complex than a single low-high-low transition, which was a similar percentage to that found for the short (6%) and long (8%) component trials. Therefore, we restricted further analysis to the two step, low-high-low rate change trials. Table 1 shows the start and stop times for each duration, modality, and probability group. A repeated measures ANOVA on start times revealed the expected main effect of duration [F(2,34) = 55.7, p<0.001], a main effect of reinforcement probability [F(2,17) = 4.62, p<0.05], but no effects of the modality-duration relationship, and no interactions. The effect of reinforcement probability was primarily driven by earlier compound start times as the reinforcement probability of the short cue increased. For stop times, the expected main effect of duration was found, and this effect was moderated by the reinforcement probability [F(4,34) = 11.19, p<0.005]. This result was driven by earlier compound starts as the reinforcement probability for the short cue increased. No other effects or interactions were seen. Examination of the distributions of start and stop times (Supplementary Figures 1–3) revealed complete overlap of the short and compound start times, and partial overlap of the short and compound stop times, in the 50%/50% light-short/tone-long group, in a manner similar to that seen in the average peak functions.
Table 1.
Start and stop times (in seconds) on 2-step trials in Experiment 1.
| GROUP | SHORT | COMPOUND | LONG | |||||||||
|---|---|---|---|---|---|---|---|---|---|---|---|---|
| Start | S.D. | Stop | S.D. | Start | S.D. | Stop | S.D. | Start | S.D. | Stop | S.D. | |
| 10%/90% TS/LL | 4.0 | 0.4 | 6.7 | 0.5 | 6.5 | 0.7 | 15.3 | 2.9 | 8.0 | 0.7 | 18.2 | 1.0 |
| 10%/90% LS/TL | 6.5 | 2.0 | 8.6 | 1.1 | 7.7 | 3.1 | 16.3 | 5.9 | 9.9 | 3.4 | 20.4 | 3.0 |
| 20%/80% TS/LL | 3.9 | 1.4 | 7.9 | 1.2 | 5.5 | 0.9 | 15.6 | 2.1 | 7.8 | 1.8 | 19.2 | 2.1 |
| 20%/80% LS/TL | 3.8 | 2.6 | 7.8 | 1.1 | 4.6 | 2.6 | 15.3 | 1.6 | 6.8 | 1.4 | 17.8 | 1.2 |
| 50%/50% TS/LL | 4.0 | 1.5 | 7.4 | 1.1 | 4.5 | 1.5 | 12.1 | 1.8 | 7.3 | 1.8 | 19.5 | 1.9 |
| 50%/50% LS/TL | 2.9 | 0.7 | 7.5 | 1.1 | 2.6 | 0.7 | 9.2 | 2.4 | 7.6 | 2.2 | 19.4 | 1.4 |
One of the primary goals of this experiment was to assess whether the time at which the compound response functions peaked was systematically related to the reinforcement probabilities of the component durations. We had previously found excellent prediction of the compound peak time when using a reinforcement probability weighted geometric average of the component durations. We computed the ratio of the weighted or non-weighted average of the component times to the obtained compound time to assess predictive accuracy. Because of the non-scalar and skewed response form of the light-short group, we restricted this analysis to tone-short rats. In contrast to our past findings, both weighted and non-weighted geometric averages accurately predicted peak times (mean ratios = 0.96 +/− 0.04 and 1.05 +/− 0.03, respectively, with neither ratio reliably different from 1). However, after removing the rats from the 50%/50% group (as their weighted and non-weighted averages were identical, thereby hindering comparisons), the weighted average was an accurate predictor of the compound peak time (mean ratio = 1.02 +/− 0.03, with no difference in the ratio across the two groups (10%/90% = 1.03, 20%/80% = 1.01). As the response rates for the short and long cues were highly correlated with the reinforcement probabilities (R2 = 0.82), weighted averages using the relative response rates rather than the reinforcement probabilities were also highly predictive of the obtained compound peak times (10%/90% = 1.02, 20%/80% = 0.99, and these values did not differ from those obtained with the reinforcement probabilities. In contrast, the non-weighted probability average significantly under-predicted the obtained compound peak time (ratio = 0.88 +/− 0.03, significantly different from 1). Interestingly, the compound peak time of the rats in the 50%/50% group was earlier than the average of the component durations, although this effect only trended toward significance (p=0.078).
Discussion
The results of Experiment 1 showed that as the reinforcement probability for the short duration increased relative to the long duration, the response function for the compound cue shifted towards the short duration. However, as seen previously (Kurti, Swanton, & Matell, 2013; Swanton & Matell, 2011), the pattern of compound responding differed as a function of the modality-duration relationship, thus the results from each group are discussed separately.
In tone-short/light-long rats, the compound peak tended to fall in between the component duration peaks, and was approximately normal in shape and spread. We have interpreted such responding as indicating that when discrepant temporal memories are retrieved, a combinatorial operation (i.e., an averaging process) is applied to these discrepant memories, the result of which is then timed in an otherwise normal fashion. In the 10%/90% and 20%/80% groups, the compound peak time is closer to the long duration than the short duration, which mirrors what we have found previously (Kurti et al., 2013; Swanton et al., 2009; Swanton & Matell, 2011). This outcome suggests that the rats use the reinforcement probabilities of the component cues to bias their decisions about when to respond. Specifically the rats’ behavior in these groups was consistent with a reinforcement probability weighted average of the component peak times, and was inconsistent with a non-weighted average. As this outcome was an a priori prediction, and was the basis for the design of this experiment, these results provide additional support for the notion that was previously only a post-hoc description of the data. Thus, the current data suggests that under some conditions, when rats are cued to retrieve multiple temporal memories, they average these discrepant durations to obtain a singular expectation of the time of reinforcement, with a bias that directly reflects the relative probability of the individual expectations.
Surprisingly, an averaging process was an inaccurate predictor in the rats with equal reinforcement probabilities, who responded maximally at a time that was earlier than the average of the component durations. As there was also a tendency for the rats in the 50%/50% condition to have a compound peak function that was more skewed than the component functions, these data suggest that the differences in reinforcement density for the two component cues impact the combinatorial processes used when dealing with stimulus compounds. Indeed, inspection of the individual subjects’ response functions in this group revealed that some of the rats had compound response functions in which the left half of the function showed substantial overlap with the left half of the short response function. Intriguingly, this response form is similar to that seen previously in light-short/tone-long rats (albeit with equal valued cues), which resulted from initiating responding at the short cue start time, but terminating responding in between the component cue stop times, thereby leading to non-scalar, positively skewed peak functions (Swanton & Matell, 2011).
In contrast to the roughly normal response form in the tone-short/light-long rats, the compound response function in the light-short/tone-long rats was not scalar and was more positively skewed than the component functions. In the 10%/90% and 50%/50% groups, the compound function overlapped, at least partially, the component function of the more valuable cue. Specifically, in the 50%/50% group, the left half of the compound function overlapped with the left half of the more valuable short function, whereas in the 10%/90% group, the right half of the compound function overlapped with the right half of the more valuable long function. This pattern of responding is consistent with the preferential use of a selection process for one response decision (e.g., initiating responding solely based upon the short cue temporal memory), but the use of an integration process for the other response decision (e.g., terminating responding based upon both cues). Such an outcome suggests that the relative dissimilarity in reinforcement density moderates the use of selection processes over integration processes. Consistent with this notion, the extent to which the compound function deviated from normally shaped responding was smallest in the 20%/80% group. Intriguingly, there appeared to be a greater extent of overlap in the 50%/50% group, suggesting utilization of selection processes for both start and stop decisions. These data may indicate that the subjective values of the cues in the 50%/50% group (which has a short: long reinforcement density of 3:1) are less similar than the subjective values in the 10%/90% group (which has a short: long reinforcement density of 1:3). Such differences might emerge due to non-linear subjective estimates of duration and/or probability (Green & Myerson, 2004; Ho, Mobini, Chiang, Bradshaw, & Szabadi, 1999; Mazur, 2001), and would help to explain the differences in form in the 10%/90% and 50%/50% rats in the tone-short/light-long groups.
The fact that four rats from the 10%/90% group and two rats from the 20%/80% group were excluded from statistical analyses because they failed to demonstrate temporal control on short-cue trials is presumably due to the low number of reinforced short trials in these groups. Research conducted by Kaiser (2008, 2009) suggests that temporally controlled responding may have been acquired in these groups with additional training. Specifically, Kaiser showed that increasing the probability of probe trials (and therein decreasing the probability of reinforced trials) decreased the rate at which peak responding was acquired, a finding that may have implications for the duration of peak-interval training used in the present experiment. Rats in the present experiment received 45 days of PI training regardless of the probe-trial probabilities associated with the short and long cues. Had peak-interval training been lengthened in the 10%/90% and 20%/80% groups, in which the majority of short trials were non-reinforced probes, perhaps these rats would have acquired temporally controlled peak responding for the short cue. As there was a positive relationship between the low reinforcement probability of the short cue and the use of integration over selection process (in the tone-short/light-long rats), one possibility is that integration is potentiated by a weak representation of one of the component memories. However, previous work from our lab using similar reinforcement probabilities, but providing greater absolute numbers of reinforced trials, demonstrated that integration is quite clearly obtained under conditions in which the component durations are well represented (Kurti et al., 2013; Swanton, Gooch, & Matell, 2009; Swanton & Matell, 2011). Coupled with the differences in the use of integration versus selection processes as a function of modality given the same amount of training, it appears unlikely that the strategy used for dealing with discrepancy is strongly related to the rate of acquisition or the extent of training of the component cues.
As shown here, as well as previously across a range of durations using similarly valued cues (Kurti et al., 2013; Swanton & Matell, 2011), the modality-duration relationship appears to moderate the use of integration and selection processes. Indeed, it appears that the modality-duration relationship was a larger contributor to the use of selection over integration processes than reinforcement probability, as there was limited evidence of selection processes in the tone-short/light-long rats, and limited evidence of integration processes in light-short/tone-long rats. One possible explanation of the different response forms under equal density conditions (i.e., the 20%/80% condition) follows from modality differences in clock speed. Specifically, it has been demonstrated that auditory cues drive clock speed faster than visual cues (Droit-Volet, Meck, & Penney, 2007; Penney, Gibbon, & Meck, 2000; Wearden, Edwards, Fakhri, & Percival, 1998). Faster clock speeds should lead to greater subjective delays to reinforcement, and thus lower subjective value (Rachlin, 1992), for auditory stimuli as compared to equal-duration visual stimuli. As a result, a short auditory stimulus would be deemed more similar in value to a long visual stimulus than the opposite relation of a short visual stimulus and a long auditory stimulus, and therefore tone-short/light-long rats would be more likely to show integration over selection processes than light-short/tone-long rats.
If selection processes occur when stimulus values become highly dissimilar, then we should see behavior associated with temporal memory selection, rather than integration, in tone-short/light-long rats as the relative dissimilarity in cue value increases beyond that used in Experiment 1. Thus, the purpose of Experiment 2 was to explore whether reinforcement probability modulates integration-selection utilization by examining compound responding in tone-short rats using reinforcement probabilities that favor the short cue to a greater extent than that used in Experiment 1, thereby promoting the use of selection processes.
Experiment 2
In the light-short/tone-long rats in Experiment 1, the extent of skew and the degree of overlap of the compound functions showed a U-shaped pattern, with greater skew and overlap in the 10%/90% and 50%/50% groups than the 20%/80% group. As described above, this pattern is consistent with greater use of selection processes when the reinforcement densities of the component cues become dissimilar. In contrast, in the tone-short/light-long rats, there was limited evidence of non-scalar skewed responding in the 50%/50% group, and no evidence for such non-normal response patterns in the 10%/90% group. As described above, one explanation for this is that short tones and long lights may be more similar in value than short lights and long tones, therein generating responding consistent with integration versus selection, respectively. Such an explanation also explains why the tone-short/light-long rats in the 50%/50% condition of Experiment 1 had compound response functions that peaked in between the component durations, with a form that only hinted at a mix of integration/selection processes, whereas the light-short/tone-long 50%/50% rats showed compound responding that overlapped the light alone trials, indicating primary use of selection process.
To assess whether discrepant cue values modulate the use of selection and/or integration strategies, we trained and tested tone-short/light-long rats on a 4s/12s peak procedure with 3 different pairs of reinforcement probabilities: 50%/75%, 50%/50%, and 50%/25%. Thus, unlike Experiment 1 in which duration ratios were held constant at 4s: 12s but reinforcement probabilities for both the short and long cues varied, both duration ratios and the reinforcement probability for the short cue were held constant in Experiment 2. This arrangement allowed us to systematically assess whether moving from a ratio of reinforcement densities that slightly favored the short cue (i.e., 1.5: 1 short:long), clearly favored the short cue (3: 1), and overwhelmingly favored the short cue (6: 1) was associated with a corresponding change in the selection strategy from one of integration to one of selection.
Method
Subjects and Apparatus
Thirty adult male Sprague-Dawley rats (Rattus norvegicus; Harlan, Indianapolis, IN) approximately 4 months of age at the beginning of the experiment were used. One rat in the 50%/50% group died during training from unknown causes. In addition, one rat in the 50%/25% group was removed from further analysis as its peak time for the long cue (3.6s) was earlier than the peak time for the short cue (4.2s), thereby failing to demonstrate temporal discrimination with the component cues. All subject treatment and apparatus characteristics were equivalent to those in Experiment 1.
Procedure
The procedure was generally identical to Experiment 1 with the following differences. All rats were run with the tone as the short cue (4s) and light as the long cue (12s). The probability of reinforcement for the short tone cue was fixed at 50% for all groups. The reinforcement probability of the long light cue varied as a function of group (25%, 50%, 75%). Probe trials for all cues lasted 3–4 times the long duration (i.e., 36–48s). In contrast to Experiment 1, which equated the total numbers of trials for each cue, the probability of reinforcement was implemented by providing, on average, equal numbers of reinforced trials for each cue, but varying the number of probe trials. FI training lasted 10 sessions, and PI training lasted 30 sessions.
Results
Rate-normalized peak functions from the 3 groups of rats are shown in Figure 3. Peak responding to the compound cue appeared to get progressively earlier as the probability of reinforcement for the long cue diminished. However, while a repeated measures ANOVA on peak times revealed the expected effect of duration [F(2,50) = 274.56, p<0.001], there were no differences as function of group, nor an interaction.
Figure 3.

Average peak functions for the short (tone), compound, and long (light) cues as a function of the reinforcement probability of the long cue (rows).
Relative peak spread is shown in Figure 4. A repeated measures ANOVA revealed a main effect of duration, which was moderated by an interaction with probability [F(4,50) = 3.55, p<0.05]. Examining each group separately, we found that the compound peak width was broader than both the short peak width and long peak width in the 50%/50% group (both p<0.001), and was broader than the short (p<0.01) and trended toward being broader than the long (p=0.08) in the 50%/25% group. In the 50%/75% group, the compound peak was broader than the long width, but not the short width (p=0.15).
Figure 4.

Relative spread, peak rate, asymmetry, and times of half-maximal responding as a function of the reinforcement probability (abscissa).
Peak response rate is shown in Figure 4. The peak rates for the component cues appeared to reflect the associated reinforcement probabilities, staying steady for the short cue, but declining for the long cue as the reinforcement probability for the long cue fell. A repeated measures ANOVA revealed a main effect of duration [F(2,50) = 5.13, p<0.05], no effect of reinforcement probability, and a weak trend for an interaction [F(4,50) = 2.37, p=0.09]. An ANOVA on each duration individually confirmed that the effect of reinforcement probability moderated peak rates only for the long duration [F(2,27) = 6.60, p<0.01], as the 50%/25% group had a lower peak rate than the other two groups (p<0.01).
Asymmetry was significantly greater in the compound functions than the component functions [F(2,50) = 29.66, p<0.001], but there were no differences as a function of probability. The impact of probability on relative width and skew may be moderated based on the form of responding (i.e., under full selection processes, responding would take on the form of the component cue, which would be normally shaped and scalar). As in Experiment 1, to disambiguate selection from integration processes, we looked at the time at which the response function rose and fell to half maximal levels, the half left and half right times. The half left time differed as a function of duration, and this difference was moderated by probability [F(2,50) = 3.22, p<0.05]. Comparing half left times in each group separately revealed that the compound half left time was significantly different from the short half left time in the 50%/75% group (p<0.001), but these times did not differ in the 50%/50% group, nor in the 50%/25% group. The times at which the response functions descended to half maximum also showed a main effect of duration and probability, and there was a duration x probability interaction [F(2,50) = 7.91, p<0.001]. However, in all cases the compound half right time was significantly different than both the short and long half right times.
The rate change detection algorithm used to analyze the pattern of responding on single trials identified two rate changes (i.e., low-high-low) as the most common pattern of responding, composing 77%, 79%, and 84% of short, compound and long trials, respectively. Other common response patterns were one rate change (6.6% of all trials), no rate changes (4.5% of all trials), and a four rate change resulting from a two-step response (low-high-low-high-low on 4.3% of all trials). We restricted further analysis to the two rate change trials. Table 2 shows the start and stop times for each probability group and duration, and the distributions of start and stop times as a function of probability are shown in Supplemental Figures 4–6. A repeated measures ANOVA on start times revealed the expected main effect of duration, but no effect of, nor interaction with, probability. However, an examination of the compound trials alone revealed an effect of probability [F(2,27) = 4.47, p<0.05]. Examining each probability group separately revealed that start times were significantly different across all durations, with one exception. In the 50%/25% group, the start time for the compound cue was not different from the start time for the short cue. The complete overlap of start times can be clearly seen in Supplemental Figure 6. Stop times differed as a function of duration, and these differences were moderated by the reinforcement probability [F(4,50) = 4.55, p<0.005].
Table 2.
Start and stop times (in seconds) on 2-step trials in Experiment 2.
| GROUP | SHORT | COMPOUND | LONG | |||||||||
|---|---|---|---|---|---|---|---|---|---|---|---|---|
| Start | S.D. | Stop | S.D. | Start | S.D. | Stop | S.D. | Start | S.D. | Stop | S.D. | |
| 50%/75% | 2.5 | 1.3 | 6.8 | 3.9 | 4.7 | 1.2 | 14.2 | 1.6 | 6.2 | 1.3 | 18.4 | 0.9 |
| 50%/50% | 2.6 | 1.3 | 7.4 | 3.7 | 4.5 | 1.4 | 15.2 | 1.8 | 5.8 | 2.0 | 19.5 | 1.2 |
| 50%/25% | 2.2 | 0.3 | 6.7 | 2.5 | 3.4 | 0.6 | 14.6 | 3.1 | 5.6 | 1.3 | 21.5 | 1.3 |
Discussion
The results of Experiment 2 show that the form of compound responding in tone-short/light-long rats varied as the ratio of reinforcement densities increased from slightly favoring the short duration to heavily favoring the short duration. Specifically, the relative breadth and skew of the compound cue grew as the reinforcement probabilities began more heavily favoring the short duration. This increase in breadth and skew appeared to primarily result from a change in the time at which subjects initiated responding. Specifically, in the 50%/50% and 50%/25% groups, which favored the short duration over the long duration by factors of 3 and 6, respectively, the average time at which compound responding reached its half maximal rate overlapped that of the short cue. Furthermore, in the 50%/25% group, a complete overlap was also seen in the distribution of start times obtained from the single trials analysis. As such, these data are consistent with a selection process, rather than an integration process, being utilized for the decision to initiate responding in this group. In contrast, the decision to terminate responding fell in between the termination time of the component cues in all groups, suggesting that integration processes continued to be used for the stop decision (although the breadth of the distribution of stop times was increased in the 50%/25% group).
Given our previous results, in which scalar averaging occurred in tone-short/light-long rats when the reinforcement densities of the two cues were roughly equal (i.e., with 20%/80% reinforcement probabilities, the long duration is favored by a factor of 1.33), we anticipated that the 50%/75% condition, in which the reinforcement density for the short duration was 1.5 times that of the long duration, would lead to scalar averaging. However, compound responding in this case was not entirely scalar, in that the breadth of responding under the compound cue was significantly broader than that of the long cue. On the other hand, the time at which responding began and ended, as judged by the times at which responding reached half maximal rates, as well as the start and stop times from the single trials analysis, fell in-between those found for the component cues, suggesting that some degree of temporal memory integration occurred for both start and stop decisions. These results support the idea that integration processes are utilized to deal with discrepant duration expectations only when there is substantial similarity in the subjective value of the cues, and that selection processes are facilitated by value dissimilarity. Furthermore, these data are consistent with the notion presented earlier that tone-short/light-long compounding would generate selection processes as the reinforcement densities for the two cues, and thus the value of the cues, became substantially dissimilar.
To reiterate, we hypothesized that due to modality differences in clock speed (i.e., tones drive the clock faster than lights; Penney et al., 2000), short tones and long lights would be deemed to be more similar in duration (and thus more similar in anticipated value) than short lights and long tones, hence the use of a selection strategy by the light-short/tone-long rats versus an integration strategy by the tone-short/light-long rats in Experiment 1. As hypothesized, tone-short rats started to show selection processes as the reinforcement probabilities became more extreme than those used in Experiment 1. However, given that we have seen scalar averaging with quite different durations (e.g., 5s tone/30s light), and modality differences in clock speed are thought to be relatively small (e.g., 10%), it seems unlikely that clock speed differences alone can explain these results. As such, it will be useful for future work to examine whether there are differences in the rate at which duration and probability are discounted and combined to generate subjective value (Grace, 1999; Green & Myerson, 2004; Ho et al., 1999; Rachlin, Raineri, & Cross, 1991) as a function of the modality of predictive and/or concurrently present cues. Alternatively, there may be other modality differences (e.g., salience or associability) that contribute to the differences in integration versus selection strategies seen here.
General Discussion
Across these two experiments, we have shown that when different cues predict different delays to reinforcement availability, the reinforcement probabilities associated with these cues moderates the location and form of responding when both cues are simultaneously presented. These data suggest that the resulting discrepancy in the anticipated reward delay is dealt with by applying different strategies, ranging from complete behavioral control by a single cue (i.e., selection) to integration of the expected delays. Further, we suggest that the strategy evaluation observed in both experiments is based upon comparing the subjective values of the two cues, after factoring in the subjective delays and probabilities of expected reward. Specifically, when cue values were highly dissimilar rats used a selection strategy to guide temporally controlled responding whereas when cue values were highly similar, they integrated the discrepant expectations.
The present experiments, coupled with previous work from our laboratory (Kurti et al., 2013; Swanton & Matell, 2011), suggest that the use of a selection versus integration strategy is determined by both the delays to reward and the probability that responding will terminate in reward delivery. As these variables relate to expected value, it seems likely that other variables (e.g., reward magnitude and hedonic impact) that influence incentive salience will also modulate the response strategy. Recent work has shown an impact of motivational variables on both response rate and temporal control when timing a single duration (Galtress, Marshall, & Kirkpatrick, 2012; Kirkpatrick & Galtress, 2009). In contrast, Kurti and Matell (2011) manipulated nucleus accumbens dopamine levels and found an impact on peak rates but not peak times. Future research will be necessary to examine whether the relation between incentive value and the integration/selection strategy used for dealing with discrepant expectations is sensitive to reward valuation effects, as well identifying the neural structures responsible for strategy selection.
It is possible that the mode of responding required on short versus long trials may influence the value of cues, which would then be expected to modulate the use of selection versus integration processes. For example, increasing the response effort associated with the short cue should have opposite effects as increasing the probability of reinforcement of the short cue in the present experiment. In contrast, if the response options are physically distinct (e.g., the short reinforcement is earned with a nosepoke, whereas the long reinforcement is earned with a lever press), we would expect that this would generate either switching or selection-like behavior. Whether such physical separateness extends to the spatial domain is an interesting question. For example, requiring different spatially positioned responses for different durations associated with the same cue results in animals displaying switching-like behavior, initiating responding at the manipulandum that predicts the short delay to reinforcement (e.g., left nosepoke) and then switching to the other manipulandum (e.g., right nosepose) that predicts a long delay to reinforcement (Balci, Freestone, & Gallistel, 2009; Gallistel, King, & McDonald, 2004; Kheifets & Gallistel, 2012; Matell, King, & Meck, 2004). However, spatial integration has also been repeatedly seen (see below), suggesting that rats might, if given the option, respond in a spatially and temporally integrated manner.
The present finding that under certain conditions rats compute a probability-weighted, geometric average of the anchor durations on compound trials can be interpreted within the context of Scalar Expectancy Theory (SET), in which a pacemaker-accumulator process grows linearly as a function of time (Gibbon, 1977; Gibbon, Church, & Meck, 1984). When timing a single duration, temporal memories are randomly sampled from a distribution of past experiences, and responding is generated when the current value in the accumulator is proportionally similar to the retrieved memory. In this framework, two different memory distributions would be formed during training with the component cues, and the simultaneous presentation of these cues during compound testing would promote the retrieval of both long and short memory samples. Due to the resulting discrepancy in expectation, a combinatorial process would then be exerted on these memories, and the average expectation timed in a normal manner.
However, results from the single-trial analyses done here suggesting that different rules may be used for starting and stopping responding under some conditions is inconsistent with SET’s assumption that decision thresholds are tied to the same memory sample (see Matell & Henning, 2013). Furthermore, averaging of two random samples from two distinct memory distributions will result in substantially diminished memory variability for the compound expectation (similar to the diminished variability of a sample mean compared to the population variability), and this would lead to compound responding that is more precise than expected from scalar timing. As such, timing across multiple conditions may be better accommodated by SET by assuming independent thresholds operating on an “average” memory expectation (Matell, Kim, & Hartshorne, submitted). In contrast, scalar compound responding is generally inconsistent with the Behavioral Theory of Timing (Killeen & Fetterman, 1988), and its dynamic offshoot, the Learning to Time Theory (Machado, 1997). In these theories, the speed of an internal clock is tied to the reinforcement density specified by the component cues, and an organism progresses through a fixed sequence of behavioral states in response to clock ticks, with one state linked to operant responding. When timing two durations separately, and with the same probability of reinforcement for each duration, it is assumed that the same sequence of states occurs for both durations, with the longer duration cue driving the state transition process more slowly. In contrast, since the subjects in the present experiment timed the component durations accurately, despite vast differences in reinforcement densities, it is necessary to assume that the state tied to responding differs across both durations and conditions. Upon presentation of the compound cue, one might expect an average of the clock speeds associated with each component cue. However, because the states associated with responding differs for each cue, one would not anticipate responding would be scalar, but would depend on the degree of coverage and overlap of the strengthened response states (Matell & Henning, 2013). On the other hand, the non-scalar skewed response forms seen here under conditions with divergent reinforcement densities might be accommodated by these models. Our findings are also inconsistent with state-dependent network models, such as the Striatal Beat Frequency model (SBF) in which temporal memories are represented as cortico-striatal synaptic weights (Matell & Meck, 2000, 2004). The notion that organisms could quickly average synaptic strengths upon being presented with compound cues is neurophysiologically implausible. Similarly, as cortical inputs in SBF are not systematically tied to the durations being timed, it is unclear how averaging synaptic inputs would reliably produce maximal activity at an intermediate time.
As mentioned above, the decision to use a selection or integration strategy when presented with contradictory pieces of information is not limited to the temporal domain. For example, Cheng, Shettleworth, Huttenlocher, and Rieser (2007) utilized a selection/integration dichotomy to explain the different patterns of behavior generated in response to discrepant information regarding the spatial location of a target. Specifically, a number of experiments with both pigeons and rodents have demonstrated that the spatial information associated with multiple external landmarks can be combined as a vector average, in which different weights are used to identify the location to search for food (Cheng, 1986; Cheng, 1989; Collett, Cartwright, & Smith, 1986; Spetch, Cheng, & Mondloch, 1992). In contrast to this averaging of landmark cues, rats have been shown to rely on visual landmarks and dead-reckoning in a winner-take-all fashion when returning to a nest site after foraging (Shettleworth & Sutton, 2005). Specifically, when these sources are in conflict, rats utilize the landmark cues unless the discrepancy between the two information sources is substantial, in which case rats rely on dead-reckoning. These data suggest that the lack of overlap in the spatial mappings moderates the selection/integration processes. Similar integration and selection processes have been seen in a perceptual task. Nichols and Newsome (2002) examined the responses of non-human primates trained to saccade in the perceived direction of movement using a random dot motion display with varying degrees of motion coherence. On a proportion of trials, electrical stimulation of a column of visual area MT led subjects to respond as though they perceived motion in a direction in between the presented stimulus direction and the stimulated direction. Thus, these data indicated evidence of perceptual (or response) averaging. However, when the presented and stimulated directions were highly divergent (more than 140 degrees apart), subjects responded in line with either the presented or stimulated direction, indicating a selection process. These data again suggest that the discrepancy of perceptual information can moderate the integration/selection process used when trying to behave in response to conflicting information.
One intriguing aspect of the present work is that it appears that the similarity in incentive value, rather than time or probability, modulates the integration/selection strategy utilized to generate temporally controlled behavior. This makes sense from a Bayesian perspective, in that one should utilize the reliability and consequences associated with each source of information to determine the importance of their contribution (Cheng et al., 2007). Indeed, previous work in the spatial domain has shown that landmarks have differential influences on behavior as a function of their distance and/or predictability to the goal location (Chamizo, Rodrigo, & MacKintosh, 2006). However, the fact that value moderates the integration/selection tradeoff suggests that the strategy decision process operates at a stage downstream from the component information sources (i.e., cued expectations of time, probability, and/or their integrated values must be compared to determine whether a selection or integration process is optimal). Only once this behavioral strategy is determined can the appropriate temporal expectation be generated (i.e., integration or selection of the component memories), and only then can temporal control processes be initiated. Given that the comparison of auditory and visual cue values, as well as any resulting cross-modal integration of modality specific temporal memories, must occur prior to initiating temporal control processes, it is unlikely that these temporal control process operate within local, modality-specific structures, such as primary sensory cortices. Rather, these data are better accounted for by an amodal time production system. Nevertheless, we note that it remains possible that temporal, probability, and value memories are stored in sensory specific areas, and this information is transferred to downstream comparison and control regions. Indeed, an unpublished pilot study in our lab has found that within-modal compounds (e.g., left light = short delay, right light = long delay) result in selection behavior rather than integration behavior, suggesting that there may be a modality-specific mechanism for resolving discrepancy that utilizes different rules than that used for inter-modal discrepancies. As such, questions and hypotheses about local versus distributed timing will need to be refined to specify what aspects of the timing system (clock, memory, decision) are being included in these notions, and hypotheses regarding the form by which temporal memories can be represented and transferred across neural structures will need to be developed.
Supplementary Material
Highlights.
Rats integrate or select temporal memories when presented with a multimodal cue
The integration/selection process is moderated by reinforcement probability
Data support an amodal temporal production system over a distributed system
Acknowledgments
This research was supported in part by grants from the National Institute on Drug Abuse and Villanova University
Footnotes
Publisher's Disclaimer: This is a PDF file of an unedited manuscript that has been accepted for publication. As a service to our customers we are providing this early version of the manuscript. The manuscript will undergo copyediting, typesetting, and review of the resulting proof before it is published in its final citable form. Please note that during the production process errors may be discovered which could affect the content, and all legal disclaimers that apply to the journal pertain.
References
- Balci F, Freestone D, Gallistel CR. Risk assessment in man and mouse. Proc Natl Acad Sci U S A. 2009;106(7):2459–2463. doi: 10.1073/pnas.0812709106. [DOI] [PMC free article] [PubMed] [Google Scholar]
- Burnham KP, Anderson DR. Model Selection and Multimodel Inference: A Practical Information-Theoretic Approach. 2. New York: Springer; 2002. [Google Scholar]
- Chamizo VD, Rodrigo T, MacKintosh NJ. Spatial integration with rats. Learning & Behavior. 2006;34(4):348–354. doi: 10.3758/bf03193198. [DOI] [PubMed] [Google Scholar]
- Cheng K. A purely geometric module in the rat’s spatial representation. Cognition. 1986;23(2):149–178. doi: 10.1016/0010-0277(86)90041-7. [DOI] [PubMed] [Google Scholar]
- Cheng K. The vector sum model of pigeon landmark use. Journal of Experimental Psychology: Animal Behavior Processes. 1989;15(4):366–375. [Google Scholar]
- Cheng K, Shettleworth SJ, Huttenlocher J, Rieser JJ. Bayesian integration of spatial information. Psychol Bull. 2007;133(4):625–637. doi: 10.1037/0033-2909.133.4.625. [DOI] [PubMed] [Google Scholar]
- Church RM, Meck WH, Gibbon J. Application of scalar timing theory to individual trials. Journal of Experimental Psychology: Animal Behavior Processes. 1994;20(2):135–155. doi: 10.1037//0097-7403.20.2.135. [DOI] [PubMed] [Google Scholar]
- Collett TS, Cartwright BA, Smith BA. Landmark learning and visuo-spatial memories in gerbils. J Comp Physiol A. 1986;158(6):835–851. doi: 10.1007/BF01324825. [DOI] [PubMed] [Google Scholar]
- Droit-Volet S, Meck WH, Penney TB. Sensory modality and time perception in children and adults. Behav Processes. 2007;74(2):244–250. doi: 10.1016/j.beproc.2006.09.012. S0376-6357(06)00203-8 [pii] [DOI] [PubMed] [Google Scholar]
- Gallistel CR. The organization of learning. Cambridge, Mass: MIT Press; 1990. [Google Scholar]
- Gallistel CR, Fairhurst S, Balsam P. The learning curve: implications of a quantitative analysis. Proc Natl Acad Sci U S A. 2004;101(36):13124–13131. doi: 10.1073/pnas.0404965101. 0404965101 [pii] [DOI] [PMC free article] [PubMed] [Google Scholar]
- Gallistel CR, King A, McDonald R. Sources of variability and systematic error in mouse timing behavior. J Exp Psychol Anim Behav Process. 2004;30(1):3–16. doi: 10.1037/0097-7403.30.1.3. [DOI] [PubMed] [Google Scholar]
- Galtress T, Marshall AT, Kirkpatrick K. Motivation and timing: clues for modeling the reward system. Behav Processes. 2012;90(1):142–153. doi: 10.1016/j.beproc.2012.02.014. [DOI] [PMC free article] [PubMed] [Google Scholar]
- Gibbon J. Scalar expectancy theory and Weber’s Law in animal timing. Psychological Review. 1977;84:279–325. [Google Scholar]
- Gibbon J, Church RM, Meck WH. Scalar timing in memory. Annals of the New York Academy of Sciences. 1984;423:52–77. doi: 10.1111/j.1749-6632.1984.tb23417.x. [DOI] [PubMed] [Google Scholar]
- Grace R. The Matching Law And Amount-dependent Exponential Discounting As Accounts Of Self-control Choice. J Exp Anal Behav. 1999;71(1):27–44. doi: 10.1901/jeab.1999.71-27. [DOI] [PMC free article] [PubMed] [Google Scholar]
- Green L, Myerson J. A discounting framework for choice with delayed and probabilistic rewards. Psychol Bull. 2004;130(5):769–792. doi: 10.1037/0033-2909.130.5.769. 2004-18097-005 [pii] [DOI] [PMC free article] [PubMed] [Google Scholar]
- Ho MY, Mobini S, Chiang TJ, Bradshaw CM, Szabadi E. Theory and method in the quantitative analysis of “impulsive choice” behaviour: implications for psychopharmacology. Psychopharmacology (Berl) 1999;146(4):362–372. doi: 10.1007/pl00005482. 91460362.213 [pii] [DOI] [PubMed] [Google Scholar]
- Ivry RB, Spencer RM. The neural representation of time. Curr Opin Neurobiol. 2004;14(2):225–232. doi: 10.1016/j.conb.2004.03.013. [DOI] [PubMed] [Google Scholar]
- Kaiser DH. The proportion of fixed interval trials to probe trials affects acquisition of the peak procedure fixed interval timing task. Behav Processes. 2008;77(1):100–108. doi: 10.1016/j.beproc.2007.06.009. [DOI] [PMC free article] [PubMed] [Google Scholar]
- Kaiser DH. Fewer peak trials per session facilitate acquisition of peak responding despite elimination of response rate differences. Behav Processes. 2009;80(1):12–19. doi: 10.1016/j.beproc.2008.08.005. [DOI] [PubMed] [Google Scholar]
- Kheifets A, Gallistel CR. Mice take calculated risks. Proc Natl Acad Sci U S A. 2012;109(22):8776–8779. doi: 10.1073/pnas.1205131109. [DOI] [PMC free article] [PubMed] [Google Scholar]
- Killeen PR, Fetterman JG. A behavioral theory of timing. Psychological Review. 1988;95(2):274–295. doi: 10.1037/0033-295x.95.2.274. [DOI] [PubMed] [Google Scholar]
- Kirkpatrick K, Galtress T. Reward value effects on timing in the peak procedure. Learning and Motivation. 2009;40(2):109–131. doi: 10.1016/j.lmot.2008.05.004. [DOI] [Google Scholar]
- Kurti A, Swanton DN, Matell MS. The potential link between temporal averaging and drug-taking behavior. In: Arstila V, Lloyd D, editors. Subjective Time. MIT Press; 2013. (pp. in press) [Google Scholar]
- Kurti AN, Matell MS. Nucleus accumbens dopamine modulates response rate but not response timing in an interval timing task. Behav Neurosci. 2011;125(2):215–225. doi: 10.1037/a0022892. [DOI] [PMC free article] [PubMed] [Google Scholar]
- Machado A. Learning the temporal dynamics of behavior. Psychol Rev. 1997;104(2):241–265. doi: 10.1037/0033-295x.104.2.241. [DOI] [PubMed] [Google Scholar]
- Matell MS, Bateson M, Meck WH. Single-trials analyses demonstrate that increases in clock speed contribute to the methamphetamine-induced horizontal shifts in peak-interval timing functions. Psychopharmacology (Berl) 2006;188(2):201–212. doi: 10.1007/s00213-006-0489-x. [DOI] [PubMed] [Google Scholar]
- Matell MS, Henning AM. Temporal memory averaging and post-encoding alterations in temporal expectation. Behav Processes. 2013;95:31–39. doi: 10.1016/j.beproc.2013.02.009. [DOI] [PMC free article] [PubMed] [Google Scholar]
- Matell MS, Kim JS, Hartshorne L. Timing in a Variable Interval Procedure: Evidence for a Memory Singularity. Behavioural Processes. doi: 10.1016/j.beproc.2013.08.010. (in press) [DOI] [PMC free article] [PubMed] [Google Scholar]
- Matell MS, King GR, Meck WH. Differential modulation of clock speed by the administration of intermittent versus continuous cocaine. Behav Neurosci. 2004;118(1):150–156. doi: 10.1037/0735-7044.118.1.150. [DOI] [PubMed] [Google Scholar]
- Matell MS, Meck WH. Neuropsychological mechanisms of interval timing behavior. Bioessays. 2000;22(1):94–103. doi: 10.1002/(SICI)1521-1878(200001)22:1<94::AID-BIES14>3.0.CO;2-E. [DOI] [PubMed] [Google Scholar]
- Matell MS, Meck WH. Cortico-striatal circuits and interval timing: coincidence detection of oscillatory processes. Brain Res Cogn Brain Res. 2004;21(2):139–170. doi: 10.1016/j.cogbrainres.2004.06.012. [DOI] [PubMed] [Google Scholar]
- Matell MS, Shea-Brown E, Gooch C, Wilson AG, Rinzel J. A heterogeneous population code for elapsed time in rat medial agranular cortex. Behav Neurosci. 2011;125(1):54–73. doi: 10.1037/a0021954. [DOI] [PMC free article] [PubMed] [Google Scholar]
- Mazur JE. Hyperbolic value addition and general models of animal choice. Psychol Rev. 2001;108(1):96–112. doi: 10.1037/0033-295x.108.1.96. [DOI] [PubMed] [Google Scholar]
- Meck WH, Church RM. Abstraction of temporal attributes. Journal of Experimental Psychology: Animal Behavior Processes. 1982a;8(3):226–243. doi: 10.1037/0097-7403.8.3.226. [DOI] [Google Scholar]
- Meck WH, Church RM. Discrimination of intertrial intervals in cross-modal transfer of duration. Bulletin of the Psychonomic Society. 1982b;19(4):234–236. [Google Scholar]
- Nichols MJ, Newsome WT. Middle temporal visual area microstimulation influences veridical judgments of motion direction. J Neurosci. 2002;22(21):9530–9540. doi: 10.1523/JNEUROSCI.22-21-09530.2002. [DOI] [PMC free article] [PubMed] [Google Scholar]
- Penney TB, Gibbon J, Meck WH. Differential effects of auditory and visual signals on clock speed and temporal memory. J Exp Psychol Hum Percept Perform. 2000;26(6):1770–1787. doi: 10.1037//0096-1523.26.6.1770. [DOI] [PubMed] [Google Scholar]
- Rachlin H. Diminishing Marginal Value as Delay Discounting. J Exp Anal Behav. 1992;57(3):407–415. doi: 10.1901/jeab.1992.57-407. [DOI] [PMC free article] [PubMed] [Google Scholar]
- Rachlin H, Raineri A, Cross D. Subjective probability and delay. J Exp Anal Behav. 1991;55(2):233–244. doi: 10.1901/jeab.1991.55-233. [DOI] [PMC free article] [PubMed] [Google Scholar]
- Roberts S. Cross-modal use of an internal clock. J Exp Psychol Anim Behav Process. 1982;8(1):2–22. [PubMed] [Google Scholar]
- Shettleworth SJ, Sutton JE. Multiple systems for spatial learning: dead reckoning and beacon homing in rats. J Exp Psychol Anim Behav Process. 2005;31(2):125–141. doi: 10.1037/0097-7403.31.2.125. [DOI] [PubMed] [Google Scholar]
- Shuler MG, Bear MF. Reward timing in the primary visual cortex. Science. 2006;311(5767):1606–1609. doi: 10.1126/science.1123513. [DOI] [PubMed] [Google Scholar]
- Spetch ML, Cheng K, Mondloch MV. Landmark use by pigeons in a touch-screen spatial search task. Animal Learning & Behavior. 1992;20(3):281–292. [Google Scholar]
- Swanton DN, Gooch CM, Matell MS. Averaging of temporal memories by rats. J Exp Psychol Anim Behav Process. 2009;35(3):434–439. doi: 10.1037/a0014021. [DOI] [PMC free article] [PubMed] [Google Scholar]
- Swanton DN, Matell MS. Stimulus compounding in interval timing: the modality-duration relationship of the anchor durations results in qualitatively different response patterns to the compound cue. J Exp Psychol Anim Behav Process. 2011;37(1):94–107. doi: 10.1037/a0020200. [DOI] [PMC free article] [PubMed] [Google Scholar]
- Taylor KM, Horvitz JC, Balsam PD. Amphetamine affects the start of responding in the peak interval timing task. Behav Processes. 2007;74(2):168–175. doi: 10.1016/j.beproc.2006.11.005. S0376-6357(06)00253-1 [pii] [DOI] [PubMed] [Google Scholar]
- Tees RC. The effects of posterior parietal and posterior temporal cortical lesions on multimodal spatial and nonspatial competencies in rats. Behav Brain Res. 1999;106(1–2):55–73. doi: 10.1016/s0166-4328(99)00092-3. [DOI] [PubMed] [Google Scholar]
- Wearden JH, Edwards H, Fakhri M, Percival A. Why “sounds are judged longer than lights”: application of a model of the internal clock in humans. Q J Exp Psychol B. 1998;51(2):97–120. doi: 10.1080/713932672. [DOI] [PubMed] [Google Scholar]
Associated Data
This section collects any data citations, data availability statements, or supplementary materials included in this article.