Abstract
With an increased emphasis on genotyping of single nucleotide polymorphisms (SNPs) in disease association studies, the genotyping platform of choice is constantly evolving. In addition, the development of more specific SNP assays and appropriate genotype validation applications is becoming increasingly critical to elucidate ambiguous genotypes. In this study, we have used SNP specific Locked Nucleic Acid (LNA) hybridization probes on a real-time PCR platform to genotype an association cohort and propose three criteria to address ambiguous genotypes. Based on the kinetic properties of PCR amplification, the three criteria address PCR amplification efficiency, the net fluorescent difference between maximal and minimal fluorescent signals and the beginning of the exponential growth phase of the reaction. Initially observed SNP allelic discrimination curves were confirmed by DNA sequencing (n = 50) and application of our three genotype criteria corroborated both sequencing and observed real-time PCR results. In addition, the tested Caucasian association cohort was in Hardy-Weinberg equilibrium and observed allele frequencies were very similar to two independently tested Caucasian association cohorts for the same tested SNP. We present here a novel approach to effectively determine ambiguous genotypes generated from a real-time PCR platform. Application of our three novel criteria provides an easy to use semi-automated genotype confirmation protocol.
INTRODUCTION
With an increase in the number of publicly available single nucleotide polymorphisms (SNPs) in numerous publicly accessible databases, the task of performing genome wide association studies has become more feasible. It is therefore no coincidence that there has been a corresponding increase in the development of methods to perform high throughput SNP genotyping to investigate disease association using this vast number of available SNPs (1,2). Traditional gel based SNP genotyping methodologies, although still effective, now seem more beneficial for smaller scale SNP typing, with the non-gel based genotyping technologies evolving as the platform of choice for larger scale SNP genotyping efforts (3).
Detection of single base substitutions using a high affinity DNA analogue known as Locked Nucleic Acid (LNA) (4,5) for use in allelic discrimination assays has been achieved by various methods. SNP genotyping using LNA chemistry has been previously used in ELISA assays to capture LNA probes hybridizing to PCR amplicons within microtitre plates (6–8). Additionally, SNP genotyping has been achieved by combining fluorescence polarization and LNA oligonucleotides (9), whilst further development of microchip technology has resulted in SNP genotyping using LNA microarray assays (10,11). In addition, real-time PCR has been investigated as a platform to perform SNP genotyping with the utilization of LNA/DNA duplexes (12). Latorra et al. (12) modified an allele-specific PCR (AS-PCR) assay by substituting the 3′ end of the allele specific primer with a single LNA base, specific for SNP detection. SYBR Green dye was used for fluorescence detection to subsequently determine genomic DNA amplicons using a thermal melt analysis, and validation of real-time PCR genomic DNA amplicon size was performed by gel electrophoresis (12). Evaluation of real-time PCR reaction efficiencies was not performed. The present study incorporating a real-time PCR platform, utilized PCR amplicon primers in conjunction with LNA probes specific for and spanning the SNP of interest. Additionally, mathematical validation of PCR efficiencies and hence, observed genotypes was performed.
As real-time PCR has improved the ability to quantify mRNA levels in gene expression studies vis-à-vis cDNA replicates, the determination of PCR efficiency has increasingly become an important issue to attain accuracy and reliability. Interest in PCR efficiency determination has been primarily directed towards the analysis of mRNA expression levels by quantifying rare transcripts and small changes in gene expression (13–15). Furthermore, examining the amplification kinetics applying a model best fitting the raw fluorescent data, has also been used to assess PCR efficiency (16–19). Determining the reaction amplification kinetics ensures that the efficiency of each individual sample is independently calculated and validated.
Independent sample PCR efficiency is an important consideration for SNP genotyping due to variable efficiencies based on individual DNA templates. The present study investigated a centrifugal real-time PCR platform using LNA hybridization probes with subsequent SNP genotype validation. The centrifugal real-time PCR platform independently assesses the SNP of interest by reporting each specific dual labelled allele specific LNA probe spanning the SNP site on separate fluorophore channels. PCR amplification kinetics assessment was performed using a four-parametric sigmoidal curve fit model. Behaviour and therefore the amplification kinetics of individual genomic DNA templates were determined independently of each other to address three criteria. Criterion A, independent fluorophore channel evaluation of PCR amplification efficiency; Criterion B, independent fluorophore channel evaluation of spurious fluorescent signal gains due to background fluorescent noise, primer dimer formations and any residual reagents within the reaction; and Criterion C, simultaneous assessment of the estimated start of the exponential growth phases for both fluorophore channels. A true heterozygous sample should therefore satisfy Criteria A and B for both fluorophore channels along with Criterion C, whereas a true homozygous sample should satisfy Criteria A and B for one of the two fluorophore channels only, and Criterion C will not be satisfied.
Application of these three criteria for validating genotype ambiguity has been empirically tested in a migraine association Caucasian cohort with encouraging results pertaining to its validity and accuracy. Further validation was achieved through sequencing of individual DNA samples, confirming the results obtained from the real-time PCR allelic discrimination. In addition, both case and control groups satisfied Hardy-Weinberg equilibrium (HWE) conditions and allelic frequencies for the control group were very similar to two independently tested Caucasian association cohorts for the same tested SNP (20,21). The application of LNA fluorogenic hybridization probes for SNP discrimination and our three novel criteria to elucidate ambiguous genotypes has proved to be an accurate and reliable method. We feel that undetermined real-time PCR endpoint allelic discrimination analysis and/or ambiguous allelic discrimination curves can be confidently resolved by applying our three criteria for SNP genotype validation.
MATERIALS AND METHODS
SNP identification
The investigated SNP was a C→T transition previously identified within the tryptophan hydroxylase (TPH) gene (20). The TPH gene encodes the rate-limiting enzyme for the biosynthesis of the neurotransmitter serotonin [5-hydroxytryptophan (5-HT)].
LNA probes versus TaqMan MGB probes
TaqMan MGB probes (22,23) consist of a minor groove binder (MGB) conjugated to the 3′ non-fluorescent quencher of the allelic specific probe. This tripeptide, 1,2-dihydro-(3H)-pyrrolo[3,2-e]indole-7-carboxylate (CDPI3) binds to the minor groove of the DNA helix of the target sequence forming a highly stable nucleic acid duplex (22). Alternatively, LNA nucleotide analogues consist of a 2′-O,4′-C methylene bridge that reduces flexibility of the ribofuranose ring and locks the LNA structure into a rigid bicyclic formation (4,5,24). Similar in their ability to enhance discrimination between matched and mismatched hybridization probes of considerably shorter length, sequence-specific LNA probe design incorporates an LNA nucleotide complementary to the assayed SNP.
PCR primer, LNA probe design
PCR primers and LNA probes were designed and synthesized by Proligo (Paris, France). PCR primers flanking the TPH SNP producing an 89 bp amplicon were as follows; sense primer, 5′-AAT TTC TTT TTC ATA CTG TTC ACC A-3′; anti-sense primer, 5′-AAT TCA CTA ATG TTG CAG GAT ACA A-3′. Dual labelled LNA hybridization probes, complementary to the anti-sense genomic DNA strand and spanning the transition site were as follows; probe 1, 5′-(JOE) cagAaACgCtAttgat (BHQ1)-3′; probe 2, 5′-(FAM) tacAgAaATgCtAttgatt (BHQ1)-3′. LNA nucleotides are denoted in upper case, DNA nucleotides are denoted in lower case, and the LNA nucleotide complementary to the identified SNP is underlined. Additional DNA nucleotides at the 5′ and 3′ ends of LNA probe 2 were included to provide a similar melting temperature (Tm) to LNA probe 1. LNA probe 1 synthesized with the 5′ fluorescent reporter dye 6-carboxy-4′,5′-dichloro-2′,7′-dimethoxyfluorescein (JOE) is specific for the C allele. LNA probe 2 synthesized with the 5′ fluorescent reporter dye 6-carboxyfluorescein (FAM) is specific for the T allele. Adhering to recommended fluorescent reporter dyes and non-fluorescent quencher combinations, attached to the 3′ ends of both LNA probes is a non-fluorescent Black Hole Quencher™ (BHQ1). Incorporation of a non-fluorescent quencher molecule eliminates background fluorescence and provides enhanced noise-to-signal ratios.
Fluorogenic allelic discrimination can be inhibited if reporter dye spectral signals are indistinguishable from one another. Hence the choice of FAM and either JOE, TET, HEX or VIC can be selected for allelic discrimination. Given the excitation and emission spectral wavelength similarities between JOE, TET, HEX and VIC, we felt that either one of these reporter dyes would therefore be sufficient to detect the alternative allele in conjunction with the FAM reporter dye. Due to the design of VIC being the proprietary of Applied Biosystems, JOE and FAM reporter dyes were initially selected for amplification detection given their minimal cross talk (<1%) between fluorophore channels on the Rotor-Gene 3000™ real-time PCR instrument (Corbett Research).
Real-time PCR optimization
Genomic DNA (n = 10) samples extracted from peripheral blood using a modified salting out procedure from Miller et al. (25) were used to optimize the real-time SNP genotyping protocol in conjunction with a no DNA template H2O control. Real-time PCR was performed using the Rotor-Gene 3000™ multiplex system (Corbett Research) and data analysis conducted with the corresponding software interface (version 5.0) (Corbett Research). In a 25 µl reaction volume, 200 nM of each PCR primer, 100 nM of each LNA probe, 1× MasterAmp PCR PreMix I (Epicentre®), 1.0 U Taq polymerase (MBI Fermentas) and 24 ng of genomic DNA was added. Real-time PCR cycling conditions were: initial denaturation at 95°C for 4 min and then 45 cycles of 95°C for 15 s and 60°C for 45 s.
The allelic discrimination real-time PCR assay performed on the Rotor-Gene 3000™ with dual labelled LNA hybridization fluorogenic probes (Proligo) mirrors the 5′ nuclease assay as outlined previously by Livak (26). Perfectly matched LNA hybridization probes to their target sequence elevate the melting temperature (Tm) of the LNA probe/DNA duplex. The presence of a perfectly matched probe minimizes dissociation, prompting cleavage of the probe by the properties of Taq DNA polymerase. In addition, the homogeneous assay is conducted under competitive conditions. Therefore, a perfectly matched LNA probe to the target sequence will inhibit mismatched probes from hybridizing. Cleavage of the hybridized LNA probe releases the 5′ reporter dye, reducing its ability to be quenched and thus releasing emitted fluorescence directly proportional to the amount of PCR product for each respective allele.
DNA sequencing
All genomic DNA samples used for real-time PCR optimization (n = 10) and an additional 40 genomic DNA samples selected from the association cohort were sequenced to validate observed real-time PCR allelic discrimination curves and genotypes. A PCR product of a larger amplicon (367 bp) that flanked the real-time PCR primers, the LNA hybridization probes and the tested TPH SNP, was sequenced using published PCR primers and PCR annealing temperature (21). PCR amplification prior to DNA sequencing was carried out in a 20 µl reaction volume with 200 nM of each primer, 1× MasterAmp PCR PreMix I (Epicentre®), 0.8 U Taq polymerase (MBI Fermentas) and 40 ng of genomic DNA. Thermocycling was performed using the PC-960C cooled thermal cycler (Corbett Research) under the following conditions: initial denaturation at 94°C for 4 min, 35 cycles of 94°C for 1 min, 58°C for 1 min, 72°C for 30 s and a final extension step of 72°C for 5 min. ABI BigDye® Terminator (v1.1) Cycle Sequencing reaction preparation for both forward and reverse primers was performed according to the manufacturer’s instructions and electrophoresed using an ABI-377 automated DNA sequencer™. Editview™ and Sequencher™ software were used to assess and analyse all sequence data. The TPH promoter nucleotide sequence (GenBank™ accession number X83212), isolated and determined by Boularand et al. (27), provided the reference sequence for comparison of both forward and reverse sequencing reactions to genotype heterozygotes and homozygotes. Pairwise BLAST analysis between the TPH promoter nucleotide sequence and the reported SNP was performed to identify the SNP position at nucleotide 512 based on the transcription initiation site at nucleotide 2118 (20).
Association cohort genotyping
The optimized real-time PCR protocol (as described in Real-time PCR optimization), for the TPH C→T transition SNP was then used to obtain empirical genotype data from a migraine Caucasian association cohort of 275 migraineurs and 275 aged and sex matched controls. Diagnosis of migraine individuals was performed via questionnaire with clinical evaluation performed by a neurologist in accordance with specified criteria set by the International Headache Society (28) as previously described (29,30). Each individual real-time PCR assay was performed with known [CC], [CT] and [TT] genotypes (verified by DNA sequencing) in conjunction with a no DNA template H2O control.
RESULTS
Simulation studies
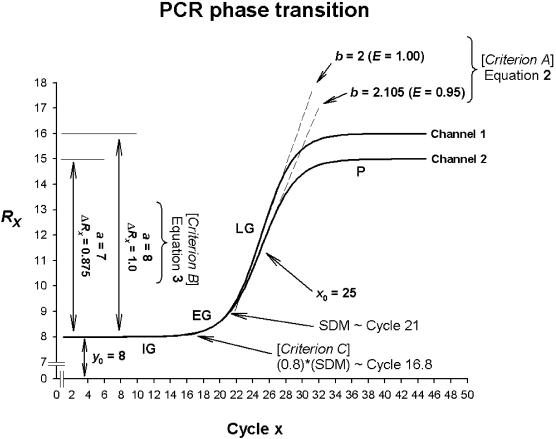
Four-parametric sigmoidal model. Simulation of parameter variables was determined with equation 1 using SigmaPlot (version 8.0, SPSS). The theoretical behaviour of PCR amplification divided into four reaction phases, initial ground (IG), exponential growth (EG), linear growth (LG) and plateau (P) (Fig. 1), best satisfies a sigmoidal relationship. Befitting individual sigmoidal relationships with differing slope factors, a four-parametric sigmoidal model with the variables y0, a, x0 and b (equation 1) adheres to the function:
Figure 1.
Simulated PCR phase transitions produced from SigmaPlot (version 8.0, SPSS) displaying amplification curves for a true heterozygous genotype. The theoretical behaviour of PCR amplification is determined by the initial ground (IG), exponential growth (EG), linear growth (LG) and plateau (P) phases, respectively. Based on a four-parameter sigmoid model (equation 1), the variables y0, a, x0 and b are obtained to determine ambiguous genotypes based on three criteria.
![]()
where f is the value of the function for each computed level of raw fluorescence (Rx) at each cycle x, y0 is the minimum fluorescence signal, a is the difference between the maximum and minimum fluorescence signals, x is the amplification cycle number, x0 is the point of inflection of the curve [at which the first derivative maximum (FDM) is computed] and b is the slope factor of the curve governing the rate of amplification.
Based on the four variables governing the theoretical sigmoidal function of the transitional phases of PCR, we have developed three criteria to elucidate ambiguous allelic discrimination. Differing rates of template amplification will constitute differing slope factors (b) and hence, efficiency of DNA template growth after each PCR cycle. The basis of Criterion A therefore addresses the rate of PCR amplification efficiency by evaluating the slope of the sigmoidal curve [(b), Fig. 1]. The amount of PCR product in fluorescence based PCR assays is directly proportional to the total amount of fluorescent signal emitted at the conclusion of the assay. The theoretical basis of Criterion B therefore firstly addresses the change in fluorescence (a) for each individual DNA sample independently of each other [(P–IG), Fig. 1]. To then normalize the net gain in fluorescent signal of the whole PCR assay (ΔRx), the change in fluorescence (a) is divided by the fluorescent signal emitted at the IG phase of the PCR [(y0), Fig. 1]. Whilst both Criteria A and B assess both fluorophore channels independently of each other, Criterion C examines the relationship between the two fluorophore channels simultaneously. The point at which the EG phase of the reaction is increasing most rapidly is estimated by determining the second derivative maximum (SDM) (∼Cycle 21) (Fig. 1) of the original sigmoidal curve fit (equation 1). The transition between IG and EG (i.e. the start of DNA template growth) can be further estimated to be 80% of the SDM (∼Cycle 16.8) (31). Therefore, Criterion C determines the standard deviation between both fluorophore channels for initiation of DNA template growth.
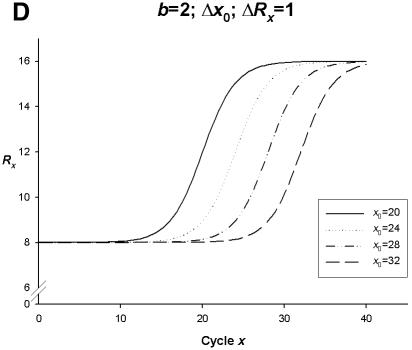
Sigmoid model variables. Genotype analysis is highly dependent upon the standard and quality of extracted DNA template. Various DNA extraction methods (e.g. salt precipitation, spin column extraction) may result in slight differences in the purity and yield of DNA template in readiness for amplification and subsequent genotyping analyses. To account for possible trace impurities, we have simulated various conditions that may account for varying PCR efficiencies including the amount of PCR product that alters the shape of the sigmoidal curve (Fig. 2A–D).
Figure 2.
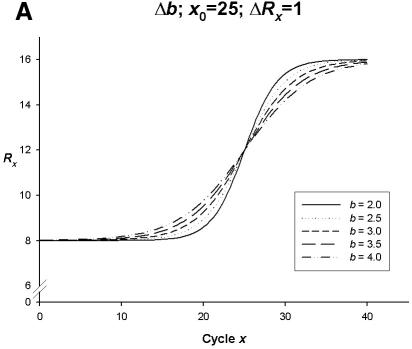
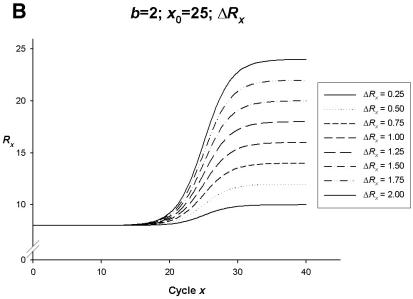
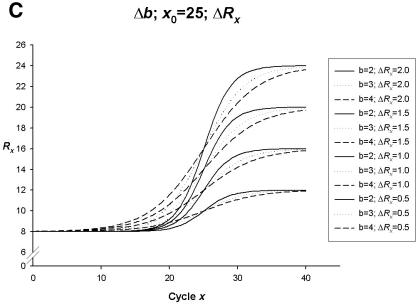
Simulation curves produced from SigmaPlot (version 8.0, SPSS) examining changes in PCR amplification efficiency (Δb), net fluorescent signal (ΔRx) and the point of inflection—FDM (Δx0). All simulations represent amplification on one fluorophore channel of the Rotor-Gene 3000™. The x-axis represents the amplification cycle number and on the y-axis is the raw fluorescent value (Rx). (A) Changes in amplification efficiency (Δb) with a constant point of inflection (x0 = 25) and a constant net fluorescent signal (ΔRx = 1.0). (B) Changes in net fluorescent signal gains (ΔRx) with a constant point of inflection (x0 = 25) and a constant PCR amplification efficiency (b = 2.0; E = 1.0). (C) Changes in amplification efficiency (Δb) and net fluorescent signal gains (ΔRx) with a constant point of inflection (x0 = 25). (D) Changes in the point of inflection (Δx0) (FDM) with a constant amplification efficiency (b = 2.0; E = 1.0) and constant net fluorescence signal gain (ΔRx = 1.0).
Based on the premise that a rate of amplification of b = 2 represents a complete doubling of DNA template after each cycle, we have designated this as a PCR efficiency equating to 1.0 (i.e. 100%). Hence PCR efficiency (E) under this model, is determined by equation 2:
![]()
Therefore, as depicted in Figure 2A, using a four-parametric sigmoid model, changes in amplification efficiency (Δb) with a constant point of inflection (x0 = 25) and a constant net fluorescent signal (ΔRx = 1.0) displays a decrease in PCR amplification efficiency being inversely proportional to the slope of the sigmoidal curve flattening out as b = 2.0 (E = 1.0) approaches b = 4.0 (E = 0.5). Therefore the steeper the rise in the curve from the start of EG, the more efficient (with respect to the rate of increase in DNA template after each cycle x) the PCR amplification.
The slope of a PCR amplification curve (Fig. 1), that is 100% efficient (b = 2), with a constant point of inflection (x0 = 25) can appear to fluctuate depending on the net fluorescent gain of individual DNA amplicons. The direct relationship between fluorescence signal and amplified DNA template can therefore be evaluated by the application of equation 3:
![]()
The direct relationship between emitted fluorescence and PCR product can however result from background fluorescent noise, primer dimer artefacts and/or residual PCR reagents. Considered as a net gain in fluorescence signal (ΔRx) of the reaction, the slope of a real-time PCR amplification curve may also alter in accordance with the amount of net fluorescent gain (Fig. 2B). The appearance of each curve does tend to vary from least efficient to most efficient, ΔRx = 25% gain to ΔRx = 200% gain, respectively. However, within each simulation, there is a complete doubling of DNA template with the appearance of each curve affected only by ΔRx. Therefore PCR amplification efficiency is not affected.
Simulating changes in PCR amplification efficiencies (Fig. 2A) or net gains in genomic DNA template fluorescent signal (Fig. 2B) with all other theoretical PCR parameters being constant can alter the appearance of individual amplification curves. We have further simulated changes in both PCR amplification efficiency (E) and net gains in fluorescent signal (ΔRx) with a constant point of inflection (x0 = 25) (Fig. 2C). Changes in amplification efficiency (Δb) and net fluorescent signal gains (ΔRx) with a constant point of inflection (x0 = 25) result in variations within the slopes of PCR amplification curves that can be adequately fitted to a four-parametric sigmoidal model. The simulated data set depicted in Figure 2C demonstrates the possible variability amongst individual genomic DNA templates selected for SNP genotype data analysis.
Simulated data in Figure 2D depict PCR amplification curves with variable points of inflection (Δx0) (FDM) with constant PCR amplification efficiency (b = 2.0; E = 1.0), and constant net gains in fluorescent signal (ΔRx = 1.0). The change in an individual amplification curve point of inflection (all other PCR parameters being constant) demonstrates a lateral shift of amplification curves to the right as x0 increases (x0 = 20 to x0 = 32) (Fig. 2D). Alternatively, a lateral shift of amplification curves to the left consequently witnesses a decrease in x0 (data not shown).
Empirical data analysis
Model curve fit analysis. Application of a four parametric sigmoid model (equation 1) to our raw fluorescent data using SigmaPlot (version 8.0, SPSS) provided the four deterministic variables (y0, a, x0, b) plus or minus their standard errors (±S.E.). In determining our amplification efficiency (E), net fluorescent gain (ΔRx) and calculation of the standard deviation (S.D.) of the start to EG between both fluorophore channels (Fig. 1), we have incorporated the S.E. of each variable to distinguish between true and false genotype calls. Genotype determination for ambiguous allelic discrimination was calculated using an in house designed Microsoft® Excel spreadsheet.
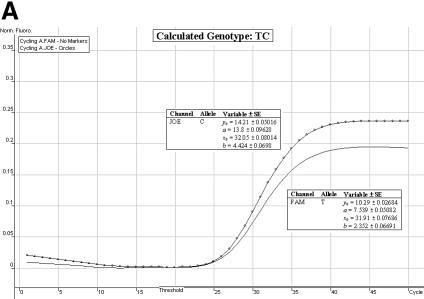
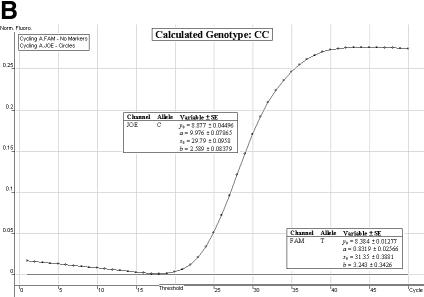
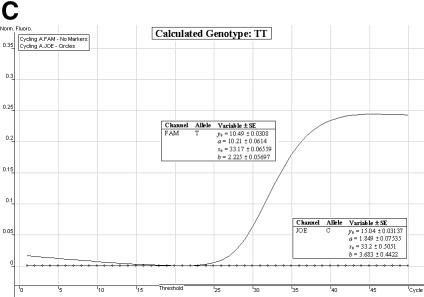
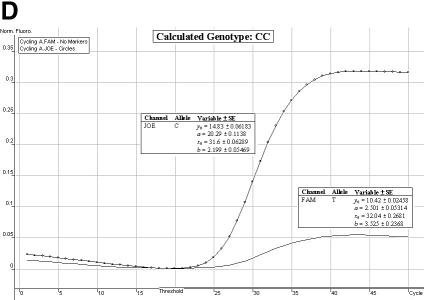
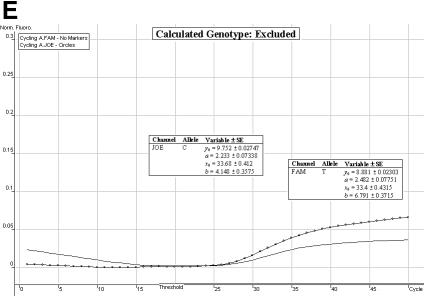
Genotype determination. We have found the allelic discrimination and scatter analysis applications of the Rotor-Gene 3000™ software in conjunction with LNA hybridization probes to be very efficient and accurate when calling genotypes (Fig. 3A–C). However, in some instances, there may be some ambiguity (stemming from DNA template quality and possible amounts of residual reagents within each individual sample) over the correct SNP genotype (Fig. 3D and E). The allelic discrimination curves depicted in Figure 3D may first suggest that this individual is heterozygous. However, the discrimination curve on the FAM channel may be representative of true amplification or an artefact spuriously emitting fluorescence. Therefore, the genotype of this individual cannot be called without ambiguity. The allelic discrimination curves depicted in Figure 3E offer scepticism as to their amplification efficiency and net gain in fluorescence signal.
Figure 3.
Allelic discrimination curves produced by the Rotor-Gene 3000™ analysis software. The x-axis represents the amplification cycle number and on the y-axis is the raw fluorescent value (Rx). (A) Example of a true heterozygote (TC) with the amplification curves for both fluorophore channels (JOE, FAM) satisfying the three proposed criteria. (B) Example of a true homozygote (CC) with the amplification curve of the JOE channel satisfying Criteria A and B. (C) Example of a true homozygote (TT) with the amplification of the other channel (FAM) satisfying Criteria A and B. (D) Example of an ambiguous heterozygote. Criteria A and B (allowing a 5% error) were not satisfied for the FAM fluorophore channel, and Criterion C was not met. Hence, a true homozygote (CC) is deduced. (E) Example of another (observational) ambiguous heterozygote. All three genotype criteria were not satisfied for both fluorophore channels (allowing a 5% error). Hence, this sample is excluded from genotypic and allelic association analyses.
We therefore suggest three criteria to evaluate ambiguous genotypes; Criterion A: PCR amplification efficiency (equation 2) is to be greater than 50% (E > 0.50) and Criterion B: net gain of fluorescent signal (equation 3) is to be greater than 25% (ΔRx > 0.25). Theoretically, a true heterozygote should progress from IG to EG of the PCR similarly on both fluorophore channels (Fig. 1). Therefore, Criterion C states between phase transition (from IG to EG), the standard deviation (S.D.) between both fluorophore channels is to be less than two (S.D. < 2). The point of IG and EG transition is estimated by first identifying where EG is increasing most rapidly. This is calculated by the second derivative maximum (SDM) of the original sigmoidal curve fit (equation 1). Therefore, the transition between IG and EG (i.e. the start of DNA template growth) can be estimated to be 80% of the SDM (31).
Satisfaction of all three criteria results in a sample being denoted as a true heterozygote (Fig. 3A), while satisfaction of Criteria A and B for one fluorophore channel only, and a failure of Criterion C denotes a true homozygous individual (Fig. 3B and C). The initial ambiguity experienced in Figure 3D was assessed by the three proposed criteria. The resulting analysis concluded a true homozygous individual (on the JOE channel) being determined. The raw fluorescent data obtained from the FAM channel failed to meet the criteria thresholds. When all three criteria are not met, samples are excluded for ensuing genotypic and allelic association analyses (Fig. 3E).
DNA sequencing validation. Following standard DNA sequencing, we confirmed the TPH C→T SNP allelic discrimination determined by using LNA hybridization probes and real-time PCR (n = 50, 16 homozygotes [CC], 23 heterozygotes [CT], 11 homozygotes [TT]). Of these 50 sequenced samples, 48 (96%) individually assessed at the 5% and 1% error thresholds confirmed DNA sequence analysis. The remaining two (4%) samples assessed by our criteria were excluded at both the 5 and 1% error thresholds.
Fluorophore channel preferential amplification. Of particular note, we observed in all heterozygous individuals an enhanced preference of amplification parameters of one fluorophore channel (JOE) over the other (FAM) (Fig. 3A). To accommodate for possible preferential amplification and/or enhanced hybridization of different fluorophores, we have allowed for a 5% error in calculating the amplification efficiency (equation 2). This 5% error applied to the weaker of the two channels must then be incorporated into Criterion A to establish PCR amplification efficiency for the weaker fluorophore channel only.
A 5% error threshold in amplification efficiency (equation 2) on the FAM fluorophore channel was selected to conservatively report (with 95% confidence) ambiguous genotypes calculated by our three criteria. We also adopted a more stringent 1% error threshold (99% confidence) to our calculated (ambiguous) genotypes for comparative purposes. From our total association cohort (n = 550), 131 (23.8%) individual genotypes were considered ambiguous by a discrepancy between the endpoint (scatter) analysis and the corresponding allelic discrimination curves, or, if there was some scepticism toward the observed allelic discrimination curves. Of the 131 ambiguous genotypes, six (4.6%) samples differed in their calculated genotypes at the 5% and 1% error thresholds (95% and 99% confidence levels, respectively). These six samples were sequenced (in addition to the 50 samples sequenced for real-time PCR genotype verification), of which five (83.3%) of the additional sequenced results confirmed the application of our criteria at the 95% confidence level. In total, of the 131 ambiguous genotypes, less than 1% could not be determined by applying a 5% error threshold (95% confidence) to the amplification efficiency (equation 2) on the FAM fluorophore channel.
Migraine genotypes. The TPH C→T SNP was genotyped in the migraine and control populations with genotypic and allelic frequencies presented in Table 1. Our observed allele frequencies in the Caucasian control population for the C (0.59) and T (0.41) alleles, respectively, were similar to two independent Caucasian cohorts for the same tested SNP (20,21). Originally identified by Rotondo et al. (20), the TPH C→T SNP tested in Italian, American Caucasian and American Indian populations displayed minor allele (T) frequencies between 0.40 and 0.45. In addition, Paoloni-Giacobino et al. (21), reported the TPH C→T SNP to be in linkage disequilibrium with three adjacent TPH SNPs in a Western European Caucasian cohort. Haplotypic frequencies of 0.59 and 0.41 were reported for the T–C–A–G and G–T–G–T haplotypes, respectively. Bolded nucleotides within the two haplotypes (21) indicate the C→T SNP tested in the present study. Migraine genotype data analysis in the present study, allowing for 5% error on the weaker channel, satisfied HWE conditions (P > 0.05). By not allowing for this 5% error on the weaker channel, our data significantly deviated from HWE (P < 0.01) with an over-representation of homozygotes identified on the stronger channel.
Table 1. Observed genotype and allele frequencies for the TPH C → T SNP.
| Cohort | Genotype | Allele | |||
|---|---|---|---|---|---|
| CC | CT | TT | C | T | |
| Migraine (n = 275) | 0.39 (98) | 0.44 (108) | 0.17 (41) | 0.62 (304) | 0.38 (190) |
| Control (n = 275) | 0.38 (89) | 0.43 (100) | 0.19 (45) | 0.59 (278) | 0.41 (190) |
Observed genotype and allele counts shown in parentheses.
DISCUSSION
The importance of population-based association studies, as a means of identifying genetic variants that contribute to complex phenotypic expression is now becoming more established (32). Risch and Merikangas (32) further suggest that large scale association genetic testing must be performed on variants within the actual gene itself or a polymorphic variant in strong linkage disequilibrium (LD) with a causative variant. The immense scale of such a task at first seemed highly impractical, but with the advent of the HapMap project identifying blocks of high LD within the genome, the reduction in the number of initial SNPs to be tested (known as tag SNPs) make the proposals of Risch and Merikangas (32) more realistic (33–36).
The significance and practicality of large scale SNP genotyping have resulted in emerging novel methodologies (3,37–39). In addition, the importance of determining PCR efficiency required for gene expression studies (13–15) and individual amplification reaction kinetics (16–19) has risen accordingly. The significance of evaluating the kinetics of PCR amplification for SNP genotyping is that it assesses each individual genomic DNA sample individually. Based on template quality and homogeneous variations within each sample reaction, fluctuations in amplification efficiencies are evidently observed, thus resulting in minimal ambiguous genotype determination.
In general, the individual sample allelic discrimination reported on the Rotor-Gene 3000™ is very efficient and accurate. However, there are certain circumstances when the allelic discrimination for one or both fluorophore channels is ambiguous and the sample genotype uncertain. To evaluate these ambiguous samples, we initially applied a four-parametric sigmoidal curve fit model (equation 1) to our empirical raw fluorescent data befitting the theoretical behaviour of PCR amplification (Fig. 1). In order to eliminate spurious genotypes, we have incorporated equation 1 and the behaviour of both fluorophore channels to determine three criteria for accurate allelic discrimination and genotyping. Criterion A: PCR amplification efficiency is to be greater than 50% (E > 0.5) (equation 2) with a 5% error in amplification efficiency allowed for the weaker of the two fluorophore channels to compensate any preferential amplification. Not allowing for this error in E, may result in an over-representation of the respective homozygous genotypes for the stronger channel and a corresponding under-representation of heterozygous genotypes. Criterion B: net fluorescence gain is to be greater than 25% (ΔRx > 0.25) (equation 3). A 25% increase in fluorescent signal from the initial single copy of template DNA eliminates possible increases in fluorescent signal due to background fluorescent noise, non-specific binding and/or unincorporated PCR reagents. Criterion C: the difference in the estimated start cycle number between the two fluorophore channels must be less than two. If Criteria A and B are met for both fluorophore channels and Criterion C is satisfied, then the individual sample is truly heterozygous (Fig. 3A). Theoretically, if the DNA sample is a heterozygote, then both LNA probes should hybridize to their respective target template sequence and thus produce two allelic discrimination curves portraying similar amplification characteristics (Fig. 1). The beginning of EG of the reaction on both channels (at amplification cycle x1 and x2) should occur almost simultaneously for it to be a true heterozygote. If Criteria A and B are met for only one of the fluorophore channels and Criterion C is not met, then the individual sample is truly homozygous for the successful fluorophore channel (Fig. 3B–D). We have observed that all samples that fail to meet the requirement of Criterion C also fail to meet the requirements of Criteria A and B for one of the fluorophore channels, hence, a true homozygote is the result. Samples to be excluded from analysis will not satisfy any of the three criteria (Fig. 3E).
Comparable in their sensitivity and specificity, LNA hybridization probes have been proven to be an effective alternative 5′ nuclease assay to the Applied Biosystems TaqMan MGB 5′ nuclease assay (40). Specific for allelic discrimination, dual layered TaqMan MGB probes and LNA hybridization probes are very similar in their assay performance. Provided raw fluorescent data for independent fluorophore channels can be obtained, there would be no inhibition to apply our three criteria to any real-time PCR instrument to assess ambiguous SNP allelic discrimination. LNA Hybridization probes designed specifically for the assayed SNP will be further enhanced with conjugated 5′ reporter dyes minimizing spectral overlap, with their appropriate 3′ non-fluorescent quencher molecule. It should be noted that another article has recently been published that also describes the use of LNA hybridization probes for real-time PCR SNP analysis, although this application did not incorporate corrections into the genotype calling (41).
We have found the use of allele specific hybridization probes containing LNA bases in conjunction with the Rotor-Gene 3000™ centrifugal real-time PCR platform to effectively address the issues of a reliable, efficient, high throughput SNP genotyping assay. Addition of LNA bases within the synthetic oligonucleotide ensures the stability and efficiency of hybridization to the target template sequence. We have also accommodated for variation between individual DNA sample templates that may give rise to fluctuating and/or ambiguous allelic discrimination between the respective fluorophore channels. By applying a four-parametric sigmoidal model to our raw fluorescent data, we have established three criteria to assess the validity and accuracy of possible ambiguous genotypes arising from the Rotor-Gene 3000™ software. True heterozygous individuals must satisfy the criteria set for (Criterion A) PCR amplification efficiency (E), (Criterion B) net fluorescent gain (ΔRx), and (Criterion C) EG initiation between both fluorophore channels. True homozygous individuals will satisfy Criteria A and B for one fluorophore channel only, whilst Criterion C will not be met. Confirmatory sequencing of samples (n = 50) and similarly matched allele frequencies from two independent Caucasian cohorts for the same tested SNP (20,21) has provided us with the confidence that implementation of the three criteria provides an accurate and reliable method to evaluate not only ambiguous genotypes, but all genotypes generated on the Rotor-Gene 3000™ centrifugal real-time PCR platform.
SUPPLEMENTARY MATERIAL
Supplementary Material is available at NAR Online.
Acknowledgments
ACKNOWLEDGEMENTS
PCR amplification primers and LNA hybridization probes were kindly designed by Dr Khalil Arar (Proligo, France). The authors also wish to thank Mr Brett Kennedy (Proligo, Australia) for LNA probe technical advice, Dr Wayne Pullan for mathematical discussion and Dr Kevin Ashton for real-time PCR technical discussion in reference to the manuscript.
REFERENCES
- 1.Tsuchihashi Z. and Dracopoli,N.C. (2002) Progress in high throughput SNP genotyping methods. Pharmacogenomics J., 2, 103–110. [DOI] [PubMed] [Google Scholar]
- 2.Syvanen A.C. (2001) Accessing genetic variation: genotyping single nucleotide polymorphisms. Nat. Rev. Genet., 2, 930–942. [DOI] [PubMed] [Google Scholar]
- 3.Shi M.M. (2001) Enabling large-scale pharmacogenetic studies by high-throughput mutation detection and genotyping technologies. Clin. Chem., 47, 164–172. [PubMed] [Google Scholar]
- 4.Petersen M. and Wengel,J. (2003) LNA: a versatile tool for therapeutics and genomics. Trends Biotechnol., 21, 74–81. [DOI] [PubMed] [Google Scholar]
- 5.Braasch D.A. and Corey,D.R. (2001) Locked nucleic acid (LNA): fine-tuning the recognition of DNA and RNA. Chem. Biol., 8, 1–7. [DOI] [PubMed] [Google Scholar]
- 6.Orum H., Jakobsen,M.H., Koch,T., Vuust,J. and Borre,M.B. (1999) Detection of the factor V Leiden mutation by direct allele-specific hybridization of PCR amplicons to photoimmobilized locked nucleic acids. Clin. Chem., 45, 1898–1905. [PubMed] [Google Scholar]
- 7.Jacobsen N., Fenger,M., Bentzen,J., Rasmussen,S.L., Jakobsen,M.H., Fenstholt,J. and Skouv,J. (2002) Genotyping of the apolipoprotein B R3500Q mutation using immobilized locked nucleic acid capture probes. Clin. Chem., 48, 657–660. [PubMed] [Google Scholar]
- 8.Jacobsen N., Bentzen,J., Meldgaard,M., Jakobsen,M.H., Fenger,M., Kauppinen,S. and Skouv,J. (2002) LNA-enhanced detection of single nucleotide polymorphisms in the apolipoprotein E. Nucleic Acids Res., 30, e100. [DOI] [PMC free article] [PubMed] [Google Scholar]
- 9.Simeonov A. and Nikiforov,T.T. (2002) Single nucleotide polymorphism genotyping using short, fluorescently labeled locked nucleic acid (LNA) probes and fluorescence polarization detection. Nucleic Acids Res., 30, e91. [DOI] [PMC free article] [PubMed] [Google Scholar]
- 10.Mouritzen P., Nielsen,A.T., Pfundheller,H.M., Choleva,Y., Kongsbak,L. and Moller,S. (2003) Single nucleotide polymorphism genotyping using locked nucleic acid (LNA). Expert Rev. Mol. Diagn., 3, 27–38. [DOI] [PubMed] [Google Scholar]
- 11.Moller S. and Mouritzen,P. (2002) SNP chip genotyping using LNA microarrays. Technical note, Genotyping applications LNA 7, Exiqon. http://www.exiqon.com/Technical%20Notes/LNA%207%20-%20SNP%20chip%genotyping%20using%20LNA%20microarrays.pdf
- 12.Latorra D., Campbell,K., Wolter,A. and Hurley,J.M. (2003) Enhanced allele-specific PCR discrimination in SNP genotyping using 3′ locked nucleic acid (LNA) primers. Hum. Mutat., 22, 79–85. [DOI] [PubMed] [Google Scholar]
- 13.Pfaffl M.W. (2001) A new mathematical model for relative quantification in real-time RT–PCR. Nucleic Acids Res., 29, e45. [DOI] [PMC free article] [PubMed] [Google Scholar]
- 14.Peirson S.N., Butler,J.N. and Foster,R.G. (2003) Experimental validation of novel and conventional approaches to quantitative real-time PCR data analysis. Nucleic Acids Res., 31, e73. [DOI] [PMC free article] [PubMed] [Google Scholar]
- 15.Livak K.J. (1997) Relative quantitation of gene expression. In ABI Prism 7700 Sequence Detection System User Bulletin No. 2, PE Applied Biosystems. http://docs.appliedbiosystems.com/pebiodocs/04303859.pdf
- 16.Liu W. and Saint,D.A. (2002) A new quantitative method of real time reverse transcription polymerase chain reaction assay based on simulation of polymerase chain reaction kinetics. Anal. Biochem., 302, 52–59. [DOI] [PubMed] [Google Scholar]
- 17.Liu W. and Saint,D.A. (2002) Validation of a quantitative method for real time PCR kinetics. Biochem. Biophys. Res. Commun., 294, 347–353. [DOI] [PubMed] [Google Scholar]
- 18.Tichopad A., Dzidic,A. and Pfaffl,M.W. (2002) Improving quantitative real-time PCR reproducibility by boosting primer-linked amplification efficiency. Biotechnol. Lett., 24, 2053–2056. [Google Scholar]
- 19.Tichopad A., Dilger,M., Schwarz,G. and Pfaffl,M.W. (2003) Standardized determination of real-time PCR efficiency from a single reaction set-up. Nucleic Acids Res., 31, e122. [DOI] [PMC free article] [PubMed] [Google Scholar]
- 20.Rotondo A., Schuebel,K., Bergen,A., Aragon,R., Virkkunen,M., Linnoila,M., Goldman,D. and Nielsen,D. (1999) Identification of four variants in the tryptophan hydroxylase promoter and association to behavior. Mol. Psychiatry, 4, 360–368. [DOI] [PubMed] [Google Scholar]
- 21.Paoloni-Giacobino A., Mouthon,D., Lambercy,C., Vessaz,M., Coutant-Zimmerli,S., Rudolph,W., Malafosse,A. and Buresi,C. (2000) Identification and analysis of new sequence variants in the human tryptophan hydroxylase (TpH) gene. Mol. Psychiatry, 5, 49–55. [DOI] [PubMed] [Google Scholar]
- 22.Afonina I., Zivarts,M., Kutyavin,I., Lukhtanov,E., Gamper,H. and Meyer,R.B. (1997) Efficient priming of PCR with short oligonucleotides conjugated to a minor groove binder. Nucleic Acids Res., 25, 2657–2660. [DOI] [PMC free article] [PubMed] [Google Scholar]
- 23.Kutyavin I.V., Afonina,I.A., Mills,A., Gorn,V.V., Lukhtanov,E.A., Belousov,E.S., Singer,M.J., Walburger,D.K., Lokhov,S.G., Gall,A.A. et al. (2000) 3′-minor groove binder-DNA probes increase sequence specificity at PCR extension temperatures. Nucleic Acids Res., 28, 655–661. [DOI] [PMC free article] [PubMed] [Google Scholar]
- 24.Latorra D., Arar,K. and Hurley,J.M. (2003) Design considerations and effects of LNA in PCR primers. Mol. Cell. Probes, 17, 253–259. [DOI] [PubMed] [Google Scholar]
- 25.Miller S.A., Dykes,D.D. and Polesky,H.F. (1988) A simple salting out procedure for extracting DNA from human nucleated cells. Nucleic Acids Res., 16, 1215. [DOI] [PMC free article] [PubMed] [Google Scholar]
- 26.Livak K.J. (1999) Allelic discrimination using fluorogenic probes and the 5′ nuclease assay. Genet. Anal., 14, 143–149. [DOI] [PubMed] [Google Scholar]
- 27.Boularand S., Darmon,M.C., Ravassard,P. and Mallet,J. (1995) Characterization of the human tryptophan hydroxylase gene promoter. Transcriptional regulation by cAMP requires a new motif distinct from the cAMP-responsive element. J. Biol. Chem., 270, 3757–3764. [DOI] [PubMed] [Google Scholar]
- 28.Headache Classification Committee of the International Headache Society. (1988) Classification and diagnostic criteria for headache disorders, cranial neuralgias and facial pain. Headache Classification Committee of the International Headache Society. Cephalalgia, 8 (Suppl.), 1–96. [PubMed] [Google Scholar]
- 29.Johnson M.P., Lea,R.A., Curtain,R.P., MacMillan,J.C. and Griffiths,L.R. (2003) An investigation of the 5-HT2C receptor gene as a migraine candidate gene. Am. J. Med. Genet., 117B, 86–89. [DOI] [PubMed] [Google Scholar]
- 30.Lea R.A., Dohy,A., Jordan,K., Quinlan,S., Brimage,P.J. and Griffiths,L.R. (2000) Evidence for allelic association of the dopamine beta-hydroxylase gene (DBH) with susceptibility to typical migraine. Neurogenetics, 3, 35–40. [DOI] [PubMed] [Google Scholar]
- 31.Corbett Research. (2003) Rotor-Gene 3000 Real-Time Amplification. Operator’s Manual Version 4.6. Corbett Research, Sydney.
- 32.Risch N. and Merikangas,K. (1996) The future of genetic studies of complex human diseases. Science, 273, 1516–1517. [DOI] [PubMed] [Google Scholar]
- 33.Daly M.J., Rioux,J.D., Schaffner,S.F., Hudson,T.J. and Lander,E.S. (2001) High-resolution haplotype structure in the human genome. Nature Genet., 29, 229–232. [DOI] [PubMed] [Google Scholar]
- 34.Goldstein D.B. and Weale,M.E. (2001) Population genomics: linkage disequilibrium holds the key. Curr. Biol., 11, R576–R579. [DOI] [PubMed] [Google Scholar]
- 35.Reich D.E., Cargill,M., Bolk,S., Ireland,J., Sabeti,P.C., Richter,D.J., Lavery,T., Kouyoumjian,R., Farhadian,S.F., Ward,R. et al. (2001) Linkage disequilibrium in the human genome. Nature, 411, 199–204. [DOI] [PubMed] [Google Scholar]
- 36.Gabriel S.B., Schaffner,S.F., Nguyen,H., Moore,J.M., Roy,J., Blumenstiel,B., Higgins,J., DeFelice,M., Lochner,A., Faggart,M. et al. (2002) The structure of haplotype blocks in the human genome. Science, 296, 2225–2229. [DOI] [PubMed] [Google Scholar]
- 37.Fan J.B., Chen,X., Halushka,M.K., Berno,A., Huang,X., Ryder,T., Lipshutz,R.J., Lockhart,D.J. and Chakravarti,A. (2000) Parallel genotyping of human SNPs using generic high-density oligonucleotide tag arrays. Genome Res., 10, 853–860. [DOI] [PMC free article] [PubMed] [Google Scholar]
- 38.Ye S., Dhillon,S., Ke,X., Collins,A.R. and Day,I.N. (2001) An efficient procedure for genotyping single nucleotide polymorphisms. Nucleic Acids Res., 29, e88. [DOI] [PMC free article] [PubMed] [Google Scholar]
- 39.Olivier M., Chuang,L.M., Chang,M.S., Chen,Y.T., Pei,D., Ranade,K., de Witte,A., Allen,J., Tran,N., Curb,D. et al. (2002) High-throughput genotyping of single nucleotide polymorphisms using new biplex invader technology. Nucleic Acids Res., 30, e53. [DOI] [PMC free article] [PubMed] [Google Scholar]
- 40.Letertre C., Perelle,S., Dilasser,F., Arar,K. and Fach,P. (2003) Evaluation of the performance of LNA and MGB probes in 5′-nuclease PCR assays. Mol. Cell. Probes, 17, 307–311. [DOI] [PubMed] [Google Scholar]
- 41.Ugozzoli L.A., Latorra,D., Pucket,R., Arar,K. and Hamby,K. (2004) Real-time genotyping with oligonucleotide probes containing locked nucleic acids. Anal. Biochem., 324, 143–152. [DOI] [PubMed] [Google Scholar]
Associated Data
This section collects any data citations, data availability statements, or supplementary materials included in this article.


