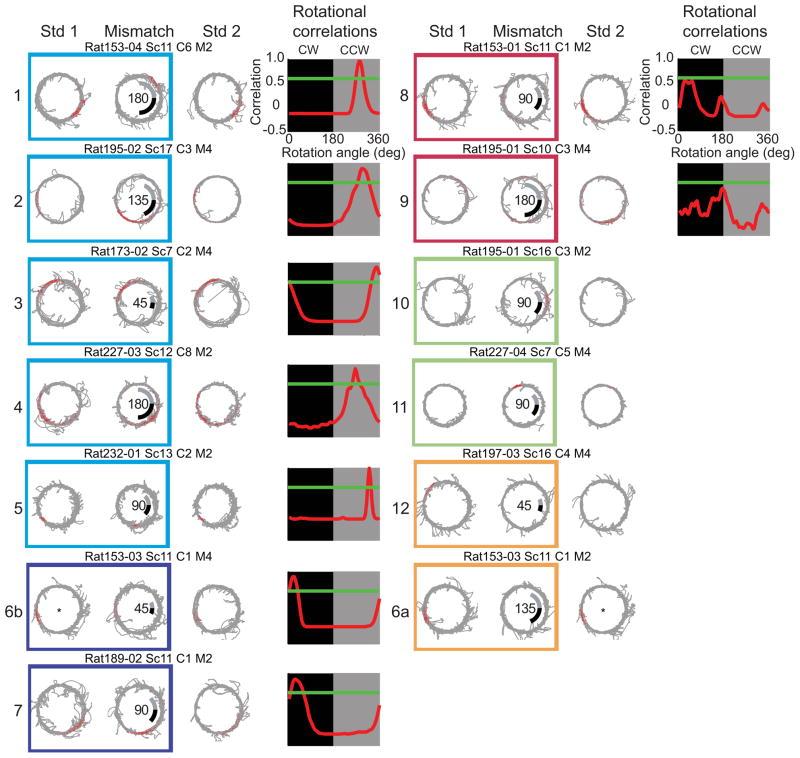
Figure 2.
CA3 cellular responses. Example spike (red points) and trajectory (grey line) plots of CA3 cells. Values in the center of mismatch sessions indicate the total mismatch angle. The grey and black lines show the amount of the local and global cue rotations, respectively. Boxes enclosing rate maps from Std1 and Mis sessions indicate cells categorized as clockwise (navy blue), counterclockwise (cyan), appear (green), disappear (orange), or ambiguous (maroon). A plot of the rotation correlation analysis between the Std1 and Mis sessions (red line) is shown to the right of each set of rate maps. Peak correlations above 0.6 (green line) located in the black or grey box indicated that the fields rotated CW or CCW, respectively. Asterisks indicate that the standard sessions for cell were the same sessions.

