Abstract
Objectives
To quantitatively compare tumor imaging by MRI and molecular bioluminescence imaging (BLI) and test the feasibility of monitoring the effect of MRI-guided laser ablation on tumor viability by 2D BLI and 3D DLIT in an orthotopic rat model of hepatocellular carcinoma (HCC).
Materials and Methods
This study was approved by the animal care committee. Rats underwent injection of N1S1 cells stably transfected with an empty vector (N=3) or a luciferase reporter (HSE-luc; N=4) into the liver. All rats underwent MR imaging to assess tumor establishment and volume and 2D BLI to assess tumor luminescence at day 7 with repeat MR imaging and 2D BLI and 3D diffuse luminescence tomography (3D DLIT) in select animals at day 14 and 21. MRI-guided laser ablation of the tumor was performed with pre and post-ablation 2D BLI and/or 3D DLIT (N=2). Tumors underwent histopathologic analysis to assess tumor viability.
Results
MR imaging demonstrated hyperintense T2-weighted lesions at 3/3 and 4/4 sites in empty vector and HSE-luc rats, respectively. 2D BLI quantitation demonstrated 23.0 fold higher radiance in the HSE-luc group compared to the empty vector group at day 7 (p<0.01) and a significant correlation with tumor volume by MRI (r=0.86; p<0.03). Tumor dimensions by 3D DLIT and MRI demonstrated good agreement. 3D DLIT quantitation better agreed with the % of non-viable tumor by histopathology than 2D BLI quantitation following MRI-guided laser ablation.
Conclusion
Bioluminescence imaging is a feasible as non-invasive, quantitative tool for monitoring tumor growth and therapeutic response to thermal ablation in a rat model of HCC.
Keywords: Magnetic Resonance Imaging, Laser Ablation, Bioluminescence Imaging, Hepatocellular Carcinoma, Animal Model
INTRODUCTION
Hepatocellular carcinoma (HCC) causes approximately 700,000 deaths each year worldwide and its incidence in the United States has tripled over the past 30 years.1-3 Despite significant efforts to reduce risk factors for HCC development such as Hepatitis B vaccination programs, blood supply screening for Hepatitis C and alcohol abuse programs, emerging risk factors for HCC such as non-alcoholic fatty liver disease (NAFLD) have continued to exacerbate the incidence of HCC.3,4 Liver transplantation or hepatic resection are potentially curative therapies in early-stage HCC but less than 20% of HCC patients are surgical candidates.5 Medications currently used for advanced HCC, including the multi-kinase inhibitor sorafenib, are not very effective in improving overall survival.5-7 HCC treatment is complicated by the fact that HCC frequently arises in the setting of chronic liver disease.8 As such, image-guided interventional oncologic (IO) therapies including percutaneous thermal ablation, trans-arterial chemoembolization (TACE) and radioembolization (TARE) have emerged as important, minimally-invasive treatment options in the multidisciplinary care of HCC patients because they allow for targeting neoplastic tissue while minimizing injury to the background liver.9 Unfortunately, current IO therapies suffer from relatively high recurrence rates and overall survival remains poor for these patients.10,11 There remains a critical need to accelerate the pre-clinical testing of novel combination therapies in order to translate more effective therapeutic strategies into clinical trials.
Small animal tumor models are critical for both mechanistic as well as therapeutic studies in pre-clinical oncology research.12 With the rapid increase in image-guided IO therapies for various solid organ malignancies, the need for translational animal tumor models is critical not only for elucidating the mechanistic basis for tumor sensitivity or resistance to thermal ablative therapies but also for developing and testing novel combination therapies for pre-clinical therapeutic efficacy. 13,14 Recently, MRI-guided laser ablation was determined to be safe and feasible in an orthotopic rat model of HCC.15 However, historically, there have been significant limitations in non-invasive techniques for in vivo anatomic, functional and/or quantitative assessment of tumor biology and therapeutic response in small animal tumor models.16-18
In recent years, molecular bioluminescence imaging (BLI) has emerged as a valid, sensitive and quantitative tool for non-invasive morphologic and functional imaging of tumor progression and biology utilizing small animal tumor models with cancer cells stably expressing firefly luciferase under the control of a specific gene promoter or non-specific promoter.17,18 In vivo BLI has several distinct advantages in that it is non-invasive, convenient, affords longitudinal, quantitative assessment within the same animal and offers excellent sensitivity.17,18 Beyond two-dimensional (2D) planar BLI, recent advancements include the ability to acquire three-dimensional diffuse luminescence tomographic images (3D DLIT).19 In addition to monitoring tumor growth and morphology, BLI has previously been used to examine response to a variety of anti-cancer therapeutics including chemotherapy and radiation in small animal tumor models.17,20,21. Nonetheless, despite the introduction of 3D DLIT, comparison of tumor imaging by MRI and 3D DLIT has not been explored. In addition, the feasibility of non-invasively monitoring interventional oncologic (IO) therapies such as thermal ablation in small animal models with 2D BLI or 3D DLIT imaging has not been examined.
The aim of the present investigation was to quantitatively compare tumor imaging by MRI and molecular bioluminescence imaging (BLI) and test the feasibility of monitoring the effect of MRI-guided laser ablation on tumor viability by 2D BLI and 3D DLIT in an orthotopic rat model of hepatocellular carcinoma (HCC).
METHODS
Stable Transfection
To develop a stably transfected cell line with a heat shock elements luciferase reporter (HSE-luc), the N1S1 (ATCC, Manassas, VA) rat hepatocellular carcinoma (HCC) cell line was co-transfected with the HSE-luc vector or an empty control vector (Panomics/Affymetrix, Santa Clara, CA) and a pcDNA3.1-Geneticin® vector (Invitrogen, Carlsbad, CA) using Fugene6 (Roche, Indianapolis, IN) per manufacturer instruction. Following transfection, cells were suspended in T75 tissue culture flasks in complete media for 3 days followed by media supplemented with Geneticin® (G418) selective antibiotic (Invitrogen) at a final concentration of 250ug/ml and incubated for 7-10 days in a 37°C, 5% CO2 humidified incubator to allow for positive selection. Following positive selection, cells were single-cell cloned in 96-well, U-bottom plates to generate a clonal population of stably transfected cells. Once growth of clonal populations was established, 50-75 colonies each were transferred to 24-well plates with drug-free complete media to allow expansion of the clonal population.
In Vitro Testing
Following expansion of the clonal population, non-transfected, empty vector and HSE-luc N1S1 cells were plated in equal numbers in a white, 96-well, clear-bottom plate (Corning, Lowell, MA) with at least 3 replicates per group. Steady-Glo™ luciferase reagent (Promega, Madison, WI) was added to each well per manufacturer’s instruction and the plate was read on a DTX 880 microplate reader (Beckman Coulter, Brea, CA) to measure the relative luciferase activity. Next, at least 10 clones from each group were selected for further testing with the luciferase assay system as previously described and clones with the highest relative luminescence for the HSE-luc vector and the lowest relative luminescence for the empty vector groups were selected for further clonal expansion in T75 flasks in G418 complete media and again tested for luciferase activity. The clones were further expanded and snap frozen in liquid N2 to save for future use. The transfected cells were cultured in G418 complete media until one week prior to experiments and in G418-free complete media during the 7 days prior to experimentation.
In Vivo Testing
All studies approved by the institutional animal care and use committee (IACUC) and conducted in accordance with institutional guidelines. To demonstrate in vivo proof of concept that the stably transfected cell lines can generate tumors and be imaged using molecular bioluminescence imaging (BLI), 3×10⁶ HSE-luc (N=4) or empty vector (N=3) cells were injected in 150ul of incomplete media into a subcapsular location in the liver of 7 male Sprague-Dawley rats (Charles River Labs, Wilmington, MA) using methods previously described.15
Imaging
After 7 days, all rats underwent 3.0T Fast Spin Echo (FSE) T2 MRI to establish tumor induction, location and size as previously described.15 Following MRI, rats underwent 2D bioluminescence imaging (BLI) using the IVIS200 imaging system (Caliper—a PerkinElmer Company, Waltham, MA) 15 minutes following a subcutaneous injection of D-Luciferin (Gold Biotechnology®, St. Louis, MO) at a dose of 150mg/kg per manufacturer’s instruction.18,22,23 In addition, select rats underwent repeat MRI and 2D BLI at 14 (N=4) and 21 (N=2) days post injection to monitor for longitudinal tumor growth. Select HSE-luc rats underwent 3D diffuse luminescence tomography (DLIT) at 14 (N=2) and 21 (N=2) days post injection by acquiring a structured light image followed by a sequential series of images using 20 nm-wide filters centered on wavelengths from 560nm to 660nm. 3D DLIT takes into account the source emission spectrum, as well as the scattering and absorption of light in tissue and thereby can estimate the 3D location and brightness of the luminescent source.19,24
MRI-Guided Laser Ablation
To test the feasibility of monitoring the effect of MRI-guided laser ablation on tumor viability by molecular bioluminescence imaging (BLI), two MRI-confirmed HSE-luc N1S1 tumor-bearing rats underwent percutaneous laser ablation using methods previously described.15 Briefly, all laser ablation experiments were performed using an FDA approved 980-nm laser generator (Visualase, Houston, Texas). A bare 400 μm core optical laser fiber with a 1.0-cm diffusing tip was inserted into the tumor through a 22-gauge introducer needle under intermittent MR imaging. The tumors were ablated at power settings of 2W and 1.5W for 2min, respectively. The first rat underwent a pre-ablation MRI and 2D BLI imaging followed by repeat 2D BLI imaging at 6 and 24 hours post ablation. The second rat underwent a pre-ablation MRI and 2D BLI and 3D DLIT imaging followed by repeat imaging at 24 hours post ablation. After the final BLI/DLIT scan, the rats were euthanized using CO2 inhalation for pathologic analysis.
Pathology
To assess for tumor coagulative necrosis and correlate the gross and microscopic pathology with the molecular imaging data, liver and tumor specimens were harvested, placed in 10% neutral buffered formalin (Fisher Scientific/Acros, Waltham, MA), embedded in paraffin, sectioned with a microtome and stained with hematoxylin-eosin (H&E) stain. H&E stained sections were reviewed by an experienced pathologist in a blinded and random fashion to estimate % area of tumor necrosis using semiquantitative methods.25 Briefly, serial histologic sections from each tumor were manually traced over the entire tumor area and areas of overt tumor coagulative necrosis using a Leica DMLB microscope (Leica Microsystems), a Micropublisher 3.3 RTV camera (Q-Imaging, Surrey, BC), and the MetaVue™ Imaging System (V.6.3r2, Universal Imaging Corp., Downington, PA). The planar area of necrotic tumor (μm2) was divided by the planar tumor surface area (μm2) over serial histologic sections to estimate % tumor necrosis, assuming that the ablation created an approximately cylindrical volume of tumor ablation.
Image Analysis
MRI DICOM images from all datasets were transferred to a workstation and tumor induction and dimensions were measured from the FSE T2 images in the axial, coronal or sagittal planes by an MR radiologist blinded to the study groups. Tumor volumes were calculated using the formula for an ellipsoid by multiplying the maximum longitudinal diameter of the tumor in millimeters (mm) in the superior-inferior (SI), lateral-medial (LM) and anterior-posterior (AP) planes by 0.523 as the correction factor [SI x LM x AP x 0.523]. 2D BLI and 3D DLIT image datasets were analyzed using Living Image 4.2 software (Caliper—a PerkinElmer Company). A regions of interest (ROI) was automatically segmented onto the 2D planar BLI image with a 25% max threshold and the total flux (photon/s) and average radiance (photons/s/cm2/sr) calculated for each animal. 3D DLIT datasets for HSE-luc rats underwent 3D tomographic reconstruction to generate axial, coronal and sagittal BLI images.19 Furthermore, 3D DLIT images were evaluated with the built-in 3D software tool to calculate total flux (photon/s), source volume (mm3) and source depth (mm) per manufacturers instruction. In addition, tumor dimensions (mm) were measured from the 3D tomographic images as described for MRI. Select MRI DICOM images and 3D DLIT image datasets were co-registered using the 3D Multi-Modality Tools in Living Image Software 4.2 (Caliper—a PerkinElmer Company).
Statistical Analysis
Statistical analyses were performed using JMP Version 9.0.3 (SAS Institute, Cary, NC). Relative luminescence (RLU) of the cell lines in vitro was calculated as mean ± SD and analyzed using one way analysis of variance (ANOVA) followed by post-hoc pair-wise comparison between non-transfected, HSE-luc and empty vector groups using student’s t-test. Tumor volume (mm3) and average radiance (p/s/cm2/sr) were analyzed between the HSE-luc and empty vector groups at day 7 using the student’s t-test (or Mann-Whitney test). The correlation between tumor volume (mm3) and average radiance (p/s/cm2/sr) was analyzed in the HSE-luc and empty vector groups using the Spearman correlation coefficient (r). The agreement in measured tumor dimensions (mm) between MRI and 3D DLIT was analyzed using the Bland-Altman method.26 Percent (%) change in total flux (photon/s), average radiance, source volume (mm3) and source depth (mm) from pre-ablation to post-ablation was calculated. The level for statistical significance was set at p<0.05.
RESULTS
In Vitro Testing
The mean (±SD) relative luminescence (RLU) was 3.3±1.5, 51.6±9.9 and 191.6±33.1 RLU for the non-transfected, empty vector and HSE-luc N1S1 cell groups, respectively. Overall, the mean relative luminescence differed significantly by cell group (p<0.0001). The mean relative luminescence was significantly greater in both the empty vector and HSE-luc cells compared to non-transfected cells (p<0.001) and almost four fold higher in the HSE-luc compared to empty vector N1S1 cell group (p<0.001).
Tumor Growth
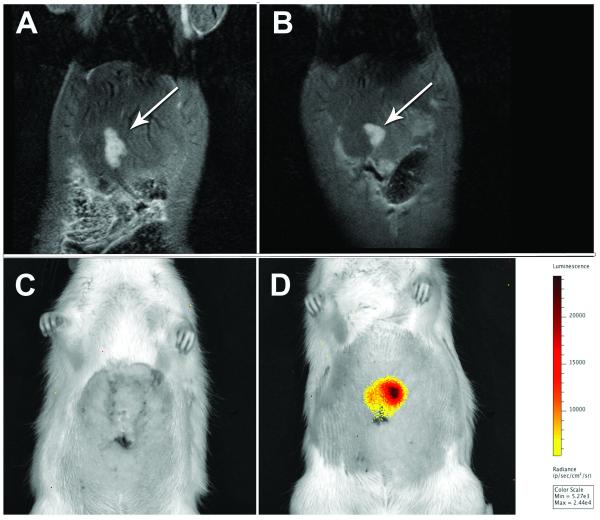
3.0T MR imaging demonstrated hyperintense T2-weighted liver lesions in both the HSE-luc and empty vector group by day 7 (Figure 1a, 1b). MR imaging revealed solitary liver lesions at 3/3 (100.0%) sites in empty vector and 4/4 (100.0%) sites in HSE-luc rats. The median (range) tumor volume was 124.0 mm3 (45.8-266.4 mm3) in the empty vector and 82.7 mm3 (67.8-128.3 mm3) in HSE-luc rats. Overall, the median tumor volume did not differ significantly by group (p>0.05).
Figure 1.
Comparison of N1S1 empty vector and HSE-luc rat tumor models by 3.0T Fast Spin Echo (FSE) T2 MRI and 2D bioluminescence imaging (BLI) 7 days post cell injection. Representative coronal FSE T2-weighted MR images show (A) empty vector (white arrow) and (B) HSE-luc tumors (white arrow). Corresponding 2D BLI images show bioluminescent signal (radiance; p/s/cm2/sr) in (D) HSE-luc tumor (white arrow) but no signal in (C) empty vector tumor.
2D Bioluminescence Imaging (BLI)
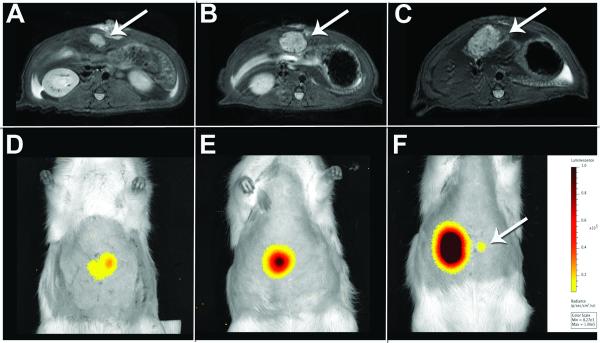
In vivo quantitation of bioluminescence from 2D BLI images (Figure 1c, 1d) demonstrated a 23.1 fold higher average radiance (p/sec/cm2/sr) in the N1S1 HSE-luc compared to the N1S1 empty vector group by day 7-post cell injection (mean±SD: 11,305±970.1 v. 489.0±48.8 p/s/cm2/sr, respectively; p<0.01) (see Figure, Supplemental Digital Content 1). Two HSE-luc and two empty vector rats underwent repeat BLI at day 14. In the HSE-luc group, there was a 4.6 and 1.2 fold increase in average radiance by day 14 in two rats respectively while the average radiance remained unchanged in the two empty vector rats. Because the bioluminescent signal remained unchanged after two weeks in the empty vector group, no further BLI imaging was conducted. Two HSE-luc rats underwent further BLI imaging at day 21 which demonstrated a 3.5 and 1.0 fold increase in the average radiance from day 14. (Figure 2)
Figure 2.
Longitudinal assessment of N1S1 HSE-luc rat tumor model by 3T FSE T2-weighted MRI and 2D bioluminescence imaging. Axial FSE T2-weighted MR and corresponding 2D BLI image of N1S1 tumor (white arrow) at day 7 (A, D), 14 (B, E) and 21 (C, F) in the same rat. MR images demonstrate a time-dependent increase in tumor size with a corresponding increase in average radiance by 2D BLI. A small focus of luminescent signal was visualized by week 3 (F; white arrow) and determined to be a small intrahepatic metastasis by 3D diffuse luminescence tomography and pathology (Figure S2).
Average radiance v. tumor volume
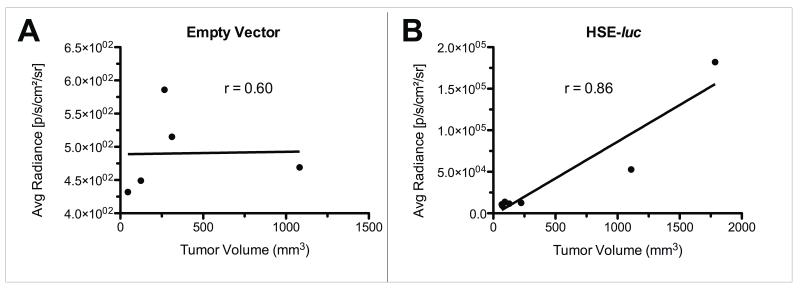
Correlation of the BLI average radiance (p/s/cm2/sr) with tumor volume (mm3) measured by MRI demonstrated a significant correlation in the N1S1 HSE-luc group (r=0.86; p<0.03; N=7) but not in the empty vector group (r=0.60; p=0.35; N=5) (Figure 3).
Figure 3.
Spearman correlation of tumor volume (mm3) by MRI and average radiance (p/s/cm2/sr) by 2D BLI between empty vector and HSE-luc tumor groups. Data demonstrate no correlation between average radiance and tumor volume in (A) the empty vector group (N=5; r=0.60; p>0.05) but a significant correlation in (B) the HSE-luc tumor group (N=7; r=0.86; p<0.03).
3D Diffuse Luminescence Tomography (DLIT)
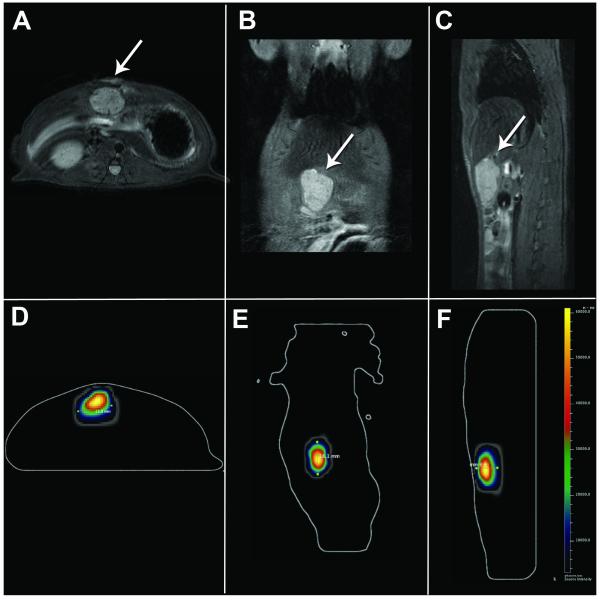
3D tomographic reconstruction of 3D DLIT datasets (N=4) was feasible and generated corresponding axial, coronal and sagittal BLI images for cross-sectional analysis throughout the source volume and comparison to corresponding cross-sectional MR tumor images. (Figure 4) 3D quantitation of volumetric bioluminescence (photon/s), source depth (mm) and volume (mm3) was feasible (see Tumor Ablation).
Figure 4.
Comparison of FSE T2-weighted MR images and corresponding axial, coronal and sagital 3D diffuse luminescence tomography (DLIT) images from HSE-luc rat at day 14-post injection. Representative axial (A, D), coronal (B, E) and sagital (C, F) FSE T2 MR and corresponding 3D DLIT images demonstrate anatomic location (white arrow by MRI) and brightness.
Furthermore, a small foci of luminescent signal on both the 2D BLI (Figure 2f) and 3D DLIT images at Day 21 but not well visualized by MRI was confirmed to be a small intrahepatic metastasis at gross pathology and microscopic pathology (see Figure, Supplemental Digital Content 2). The small metastasis demonstrated a source depth of 4.2mm, source volume of 1.34mm3 and a total flux of 4.2×10⁵ photons/s on 3D DLIT quantitation.
Tumor Dimensions by MRI and 3D BLI
Comparison of tumor dimensions (mm) measured from 3D DLIT tomographic reconstructions and corresponding axial, coronal and sagittal MR images (Figure 4) demonstrated good agreement by Bland-Altman analysis with a bias of 0.04mm (-2.7 to 2.8 mm, 95% limits of agreement). (see Figure, Supplemental Digital Content 3)
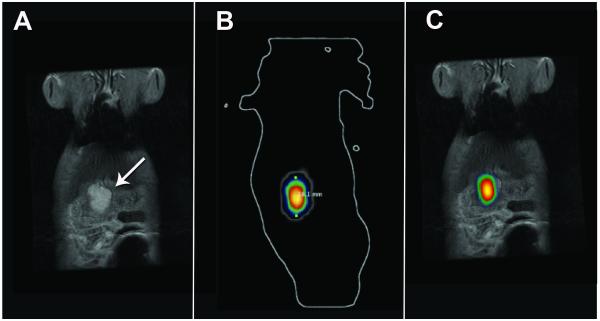
Furthermore, co-registration of corresponding MRI DICOM and 3D DLIT tomographic images was feasible using 3D Multi-Modality Tools in the Living Image Software and demonstrated good agreement between the tumor morphology and location of the bioluminescent source. (Figure 5; also see Video, Supplemental Digital Content 4)
Figure 5.
Co-registration of 3T FSE T2-weighted MRI and 3D diffuse luminescence tomography (DLIT) images using 3D Multimodality Tools in Living Image Software. (A) Coronal FSE T2-weighted MR image of tumor (white arrow) and (B) Corresponding coronal 3D DLIT image; (C) Co-registered coronal FSE T2 MR and 3D DLIT image.
MR-guided laser ablation
To test the feasibility of monitoring the effect of MRI-guided laser ablation on tumor viability by molecular bioluminescence imaging (BLI), two HSE-luc tumor-bearing rats underwent baseline BLI followed by 3.0T MR-guided laser ablation and post-ablation BLI at 6 and/or 24 hours to assess therapeutic response. The first rat with an MRI-confirmed 8.0mm tumor underwent a pre-ablation 2D BLI scan followed by laser ablation of the tumor at a power setting of 2 watts (W) for 2 minutes. Repeat 2D BLI imaging demonstrated a 59.9% and a 95.4% decrease in average radiance from baseline at 6 hours and 24 hours post-ablation (13,840 to 5,540 to 637 p/s/cm2/sr, respectively). Gross and microscopic pathology confirmed approximately 27.8% of the total tumor area demonstrated morphologic evidence of coagulative necrosis.
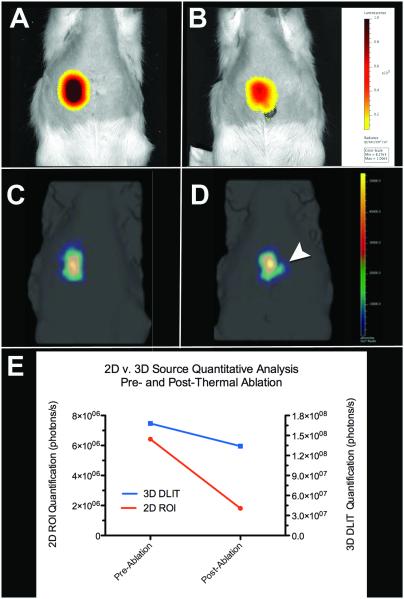
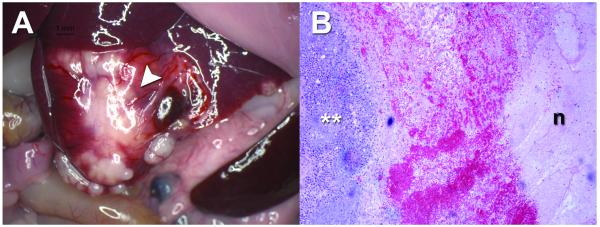
2D BLI and 3D DLIT imaging was used in the second ablation study. A second rat with an MRI-confirmed 18.0 mm tumor underwent pre-ablation 2D BLI (Figure 6a) and 3D DLIT (Figure 6c) imaging followed by an intentional partial laser ablation of the tumor at a power setting of 1.5W for 2 minutes. Repeat 2D BLI imaging at 24 hours post-ablation demonstrated a time-dependent decrease in the bioluminescent signal with an 80% reduction in average radiance (182,000 to 36,400 p/s/cm2/sr) and 71.8% reduction in total flux (6.42×10⁶ to 1.81×10⁶ p/s) from baseline (Figure 6b). Quantitative analysis of repeat 3D DLIT imaging at 24 hours post-ablation demonstrated a 20.2% reduction in total flux (1.68×10⁸ to 1.34×10⁸ p/s), a 16.7% decrease in source volume (659.9 to 549.4 mm3), and a 1.5mm increase in source depth (8.3 to 9.8mm) from baseline (Figure 6d, 6e). Gross pathology confirmed a medial necrotic zone of tissue and a lateral area of grossly viable tissue (Figure 7a). Microscopic pathology (Figure 7b) confirmed that approximately 14.9% of the total tumor area demonstrated morphologic evidence of coagulative necrosis.
Figure 6.
2D BLI and 3D DLIT assessment of MR-guided laser ablation at baseline and 24-hours post-ablation. (A) 2D BLI and (C) 3D DLIT pre ablation imaging and corresponding (B) 2D and (D) 3D post-ablation imaging. (E) Quantitative analysis of 2D (red line) and 3D (blue line) bioluminescence (photons/s). (B) 2D BLI and (D) 3D DLIT images (white arrowhead) demonstrate decreased bioluminescent signal at 24 hours post ablation; quantitative analysis demonstrates approximately a 72% reduction and 20% reduction in bioluminescent signal by 2D and 3D quantification, respectively.
Figure 7.
Gross and microscopic pathology of N1S1 tumor 24 hours post laser ablation. (A) Gross image demonstrates a white-yellow tumor with a medial zone of ablation and evidence of surface hemorrhage (white arrowhead); (B) Photomicrograph of representative H&E stained section (from white arrowhead in A) demonstrates viable tumor (white **), a hemorrhagic transition zone and a lateral zone of necrosis (n). (H&E; original magnification, x5).
DISCUSSION
In this feasibility study an orthotopic rat HCC model stably transfected to express firefly luciferase was utilized for non-invasive anatomic, functional and quantitative imaging of in vivo tumor growth and response to MR-guided thermal ablation using both 2D and 3D molecular bioluminescence imaging (BLI). BLI has the potential to be a readily accessible, powerful tool for repeatable, quantitative imaging of interventional oncologic (IO) therapies in the pre-clinical setting.
Previous IO studies in small animal models have largely relied on correlation of end-point analyses such as histopathology and immunohistochemistry with or without post-ablation imaging. 27-30 Nonetheless, limitations in this approach have been reported.31 In addition, dependency on end-point analyses requires euthanasia at a pre-determined time point. As such, each animal cannot serve as its own control, time-dependent analyses are less feasible within the same animal and ultimately biological variability and consequently, sample size requirements increase and efficiency decreases for a given study. Current small animal imaging techniques including ultrasound (US), computed tomography (CT), magnetic resonance imaging (MRI) and positron emission tomography (PET) allow for non-invasive, in vivo tumor imaging but may be less accessible or cost-effective for pre-clinical research or may not provide functional information (US, CT, MRI).15,32
Increasing evidence suggests that the tumor microenvironment is a critical modifier of both tumorigenesis and therapeutic efficacy, particularly in HCC.33,34 In order to move beyond subcutaneous tumor models in pre-clinical oncology research to more biologically relevant orthotopic or heterotopic tumor models, non-invasive, quantitative and functional imaging techniques are needed. In this study, stable transfection of the N1S1 rat HCC cell line with a luciferase reporter (HSE-luc) resulted in significantly greater luminescence in the HSE-luc group compared to empty vector group both in vitro and in vivo with 2D BLI over time and thus validates the transfection and model development methodology. The data suggested that the transfection methods resulted in low background luminescence in vitro in the empty vector group and an approximately 4.0 fold increase in constitutive luciferase expression in the HSE-luc group. Given the relatively high constitutive luciferase expression in the N1S1 HSE-luc cells, this cell line was further used for the in vivo experiments and the in vivo data demonstrated significantly greater constitutive luciferase expression in the N1S1 HSE-luc group compared to the empty vector group, in agreement with the in vitro data.
Regarding comparative tumor imaging, 2D BLI signal correlated well with N1S1 tumor volume by MRI. These data agree with previous findings in a mouse glioblastoma model.35 Moreover, 3D diffuse luminescence tomography (DLIT) of tumor location, morphology and luminescence was feasible and agreed well with the tumor location and size by MR imaging. Recently, investigators have integrated BLI with MRI using manual co-registration of 2D BLI images onto coronal MRI images in both mouse and rat tumor models, thereby allowing greater correlation of the morphologic and functional imaging.36-38 In this study, the use of optical imaging software (Multimodality Tools, Living Image, Caliper—a PerkinElmer Company) allowed for co-registration of 3D DLIT images with MR data. In addition, bioluminescence imaging was sensitive for identification of a small intrahepatic metastasis that was not visualized on MRI but visualized by both 2D BLI and 3D DLIT and confirmed by pathology.
Furthermore, 2D BLI and 3D DLIT were feasible for quantitatively measuring time-dependent change in tumor bioluminescence following MR-guided laser ablation. BLI is known to provide a relative measure of cell viability or function.39 However, correlation of the 2D BLI data with histopathology suggested that 2D BLI may be underestimating tumor viability. In the second ablation experiment, the change in total flux by 3D DLIT quantitation suggested that there was approximately a 20% decrease in signal as a measure of tumor viability post-ablation and these data better agreed with the % of non-viable, necrotic tumor by histopathology (14.9%) than 2D BLI quantitation (70-80% decrease). Because 3D DLIT determines the absolute light intensity as opposed to the relative intensity at the animal’s surface, 3D DLIT may be more accurate for volumetrically assessing therapeutic efficacy of thermal ablation.19
This study has several limitations. The experiments outlined in this pilot study utilized a small number of animals. In addition, longitudinal assessment of tumor growth was limited to three weeks and laser ablation assessment for 24 hours post-treatment. However, in a small number of animals, the data suggested BLI is feasible for anatomic, functional and quantitative tumor imaging and that 3D DLIT may be more accurate than 2D BLI for functional quantitation of source bioluminescence following thermal ablation. Given the discrepancy in quantitative data between 3D DLIT and 2D BLI, further work is needed to better understand these differences. Specifically, the comparative accuracy and precision of quantitative 3D DLIT versus 2D BLI as a measure of tumor viability following percutaneous thermal ablation requires further investigation in a larger sample size in this model. Moreover, the decrease in bioluminescent signal by BLI as a non-invasive measure of tumor viability following thermal ablation requires longitudinal assessment and further validation against gold standard pathology techniques such as triphenytetrazolium choloride (TTC) vital staining and histopathologic assessment of necrosis at longer time points.40 Additionally, BLI is not feasible for imaging de novo tumor models, large animal models or patients due to requirements for genetic manipulation of cancer cells in vitro and/or current limitations of equipment size. PET/CT or PET/MR would be more feasible imaging modalities for acquiring similar functional and morphologic information in de novo tumor models or patients. Finally, the techniques outlined warrant expansion to other small animal models of HCC such as the Morris hepatoma or AS30D models.41,42
Image-guided thermal ablative therapies are critically important treatment options in the multidisciplinary care of patients with HCC but novel therapeutic strategies are needed to further improve patient prognosis.43,44 There is growing evidence that the synergistic effect of multimodal therapies such as thermal ablation combined with systemic or regional therapies may result in improved treatment efficacy and survival.43,45-47 However, translational animal models of HCC are needed for pre-clinical development and testing of novel therapies.12 In the HCC model outlined, bioluminescence imaging may serve as a powerful non-invasive, quantitative and cost-effective tool for longitudinal assessment of therapeutic response to thermal ablative therapies and may help to accelerate pre-clinical testing of combination interventional oncologic (IO) therapies for translation to clinical trials for the growing number of patients with HCC.2,3
Supplementary Material
Supplemental Digital Content 1 (Figure)—Comparison of quantitative 2D bioluminescent radiance (p/s/cm2/sr) between N1S1 empty vector (N=3) and HSE-luc (N=4) tumors at day 7-post cell injection. Data demonstrate significantly higher radiance in the HSE-luc group compared to the empty vector group (mean±SD: 11,305±970.1 v. 489.0±48.8 p/s/cm2/sr, respectively; p<0.01)
Supplemental Digital Content 2 (Figure)——3D diffuse luminescence tomography (DLIT) and gross pathology of small intrahepatic metastasis of N1S1 HSE-luc tumor at day 21 post injection. (A) 3D DLIT demonstrates a small foci of luminescent signal adjacent to main tumor (white arrowhead). (B) Corresponding gross pathology confirms 1-2mm tumor metastasis (white arrowhead) 5-6mm from the tumor mass (t).
Supplemental Digital Content 3 (Figure)——Agreement in tumor dimensions measured by 3D diffuse luminescence tomography (DLIT) and 3T MRI as the gold standard. Bland-Altman analysis demonstrates good agreement within 2-3 mm between the two modalities for measuring tumor dimensions.
Supplemental Digital Content 4 (Video)——Co-registration of three dimensional (3D) maximum intensity projection (MIP) reconstruction from FSE T2 MRI and 3D DLIT image in an N1S1 HSE-luc rat at day 14 post injection. Video clip of 3D MIP demonstrates the location and morphology of the tumor and the brightness of the bioluminescent tumor signal co-registered to the MR image.
Acknowledgements
Infrastructure support provided by NIH construction grant NIH C06 RR018898 and Center for Translational Science Activities (CTSA) grant NIH UL1 RR024150. Research support provided in part by SIR Foundation Allied Scientist Training Grant and RSNA Research Scholar Grant.
Contributor Information
Scott M. Thompson, Medical Scientist Training Program (MSTP), College of Medicine, Mayo Clinic, Rochester, MN
Matthew R. Callstrom, Assistant Professor of Radiology, Department of Radiology, Mayo Clinic, Rochester, MN
Bruce Knudsen, Department of Laboratory Medicine and Pathology, Mayo Clinic, Rochester, MN.
Jill L. Anderson, Department of Physiology and Biomedical Engineering, Mayo Clinic, Rochester, MN.
Shari L. Sutor, Division of Oncology Research, Mayo Clinic, Rochester, MN.
Kim A. Butters, Department of Laboratory Medicine and Pathology, Mayo Clinic, Rochester, MN.
Chaincy Kuo, Caliper Life Sciences—a PerkinElmer Company, Alameda, CA.
Joseph P. Grande, Department of Laboratory Medicine and Pathology, Mayo Clinic, Rochester, MN.
Lewis R. Roberts, Division of Gastroenterology and Hepatology, Mayo Clinic, Rochester, MN.
David A. Woodrum, Department of Radiology, Mayo Clinic, Rochester, MN.
REFERENCES
- 1.Everhart JE, Ruhl CE. Burden of digestive diseases in the United States Part III: Liver, biliary tract, and pancreas. Gastroenterology. 2009;136:1134–1144. doi: 10.1053/j.gastro.2009.02.038. [DOI] [PubMed] [Google Scholar]
- 2.Yang JD, Roberts LR. Hepatocellular carcinoma: A global view. Nat Rev Gastroenterol Hepatol. 2010;7:448–458. doi: 10.1038/nrgastro.2010.100. [DOI] [PMC free article] [PubMed] [Google Scholar]
- 3.Yang JD, Kim B, Sanderson SO, et al. Hepatocellular carcinoma in olmsted county, Minnesota, 1976-2008. Mayo Clin Proc. 2012;87:9–16. doi: 10.1016/j.mayocp.2011.07.001. [DOI] [PMC free article] [PubMed] [Google Scholar]
- 4.Marrero JA, Fontana RJ, Su GL, et al. NAFLD may be a common underlying liver disease in patients with hepatocellular carcinoma in the United States. Hepatology. 2002;36:1349–1354. doi: 10.1053/jhep.2002.36939. [DOI] [PubMed] [Google Scholar]
- 5.Yang JD, Roberts LR. Epidemiology and management of hepatocellular carcinoma. Infect Dis Clin North Am. 2010;24:899–919. viii. doi: 10.1016/j.idc.2010.07.004. [DOI] [PMC free article] [PubMed] [Google Scholar]
- 6.Cheng AL, Kang YK, Chen Z, et al. Efficacy and safety of sorafenib in patients in the Asia-Pacific region with advanced hepatocellular carcinoma: a phase III randomised, double-blind, placebo-controlled trial. Lancet Oncol. 2009;10:25–34. doi: 10.1016/S1470-2045(08)70285-7. [DOI] [PubMed] [Google Scholar]
- 7.Llovet JM, Ricci S, Mazzaferro V, et al. Sorafenib in advanced hepatocellular carcinoma. The New England journal of medicine. 2008;359:378–390. doi: 10.1056/NEJMoa0708857. [DOI] [PubMed] [Google Scholar]
- 8.Yang JD, Kim WR, Coelho R, et al. Cirrhosis is present in most patients with hepatitis B and hepatocellular carcinoma. Clin Gastroenterol Hepatol. 2011;9:64–70. doi: 10.1016/j.cgh.2010.08.019. [DOI] [PMC free article] [PubMed] [Google Scholar]
- 9.Lencioni R, Crocetti L, De Simone P, et al. Loco-regional interventional treatment of hepatocellular carcinoma: techniques, outcomes, and future prospects. Transpl Int. 2010;23:698–703. doi: 10.1111/j.1432-2277.2010.01109.x. [DOI] [PubMed] [Google Scholar]
- 10.Altekruse SF, McGlynn KA, Dickie LA, et al. Hepatocellular carcinoma confirmation, treatment, and survival in surveillance, epidemiology, and end results registries, 1992-2008. Hepatology. 2012;55:476–482. doi: 10.1002/hep.24710. [DOI] [PMC free article] [PubMed] [Google Scholar]
- 11.Tiong L, Maddern GJ. Systematic review and meta-analysis of survival and disease recurrence after radiofrequency ablation for hepatocellular carcinoma. Br J Surg. 2011;98:1210–1224. doi: 10.1002/bjs.7669. [DOI] [PubMed] [Google Scholar]
- 12.Li Y, Tang ZY, Hou JX. Hepatocellular carcinoma: insight from animal models. Nat Rev Gastroenterol Hepatol. 2011;9:32–43. doi: 10.1038/nrgastro.2011.196. [DOI] [PubMed] [Google Scholar]
- 13.Aravalli RN, Golzarian J, Cressman EN. Animal models of cancer in interventional radiology. Eur Radiol. 2009;19:1049–1053. doi: 10.1007/s00330-008-1263-8. [DOI] [PubMed] [Google Scholar]
- 14.Aravalli RN, Steer CJ, Sahin MB, et al. Stem cell origins and animal models of hepatocellular carcinoma. Dig Dis Sci. 2010;55:1241–1250. doi: 10.1007/s10620-009-0861-x. [DOI] [PubMed] [Google Scholar]
- 15.Thompson SM, Callstrom MR, Knudsen B, et al. Development and Preliminary Testing of a Translational Model of Hepatocellular Carcinoma for MR Imaging and Interventional Oncologic Investigations. J Vasc Interv Radiol. 2012;23:385–395. doi: 10.1016/j.jvir.2011.11.018. [DOI] [PMC free article] [PubMed] [Google Scholar]
- 16.Kagadis GC, Loudos G, Katsanos K, et al. In vivo small animal imaging: current status and future prospects. Med Phys. 2010;37:6421–6442. doi: 10.1118/1.3515456. [DOI] [PubMed] [Google Scholar]
- 17.O’Neill K, Lyons SK, Gallagher WM, et al. Bioluminescent imaging: a critical tool in pre-clinical oncology research. J Pathol. 2010;220:317–327. doi: 10.1002/path.2656. [DOI] [PubMed] [Google Scholar]
- 18.Klerk CP, Overmeer RM, Niers TM, et al. Validity of bioluminescence measurements for noninvasive in vivo imaging of tumor load in small animals. Biotechniques. 2007;43:7–13. 30. doi: 10.2144/000112515. [DOI] [PubMed] [Google Scholar]
- 19.Kuo C, Coquoz O, Troy TL, et al. Three-dimensional reconstruction of in vivo bioluminescent sources based on multispectral imaging. J Biomed Opt. 2007;12:024007. doi: 10.1117/1.2717898. [DOI] [PubMed] [Google Scholar]
- 20.Tuli R, Surmak A, Ford E, et al. Bioluminescence image-guided irradiation and tumor monitoring in a preclinical pancreatic cancer mouse model. Journal of Clinical Oncology (Meeting Abstracts) 2011;29 [Google Scholar]
- 21.Sun H, Pisle S, Gardner ER, et al. Bioluminescent imaging study: FAK inhibitor, PF-562,271, preclinical study in PC3M-luc-C6 local implant and metastasis xenograft models. Cancer Biol Ther. 2010;10:38–43. doi: 10.4161/cbt.10.1.11993. [DOI] [PMC free article] [PubMed] [Google Scholar]
- 22.Inoue Y, Kiryu S, Izawa K, et al. Comparison of subcutaneous and intraperitoneal injection of D-luciferin for in vivo bioluminescence imaging. Eur J Nucl Med Mol Imaging. 2009;36:771–779. doi: 10.1007/s00259-008-1022-8. [DOI] [PubMed] [Google Scholar]
- 23.Inoue Y, Kiryu S, Watanabe M, et al. Timing of imaging after d-luciferin injection affects the longitudinal assessment of tumor growth using in vivo bioluminescence imaging. Int J Biomed Imaging. 2010;2010:471408. doi: 10.1155/2010/471408. [DOI] [PMC free article] [PubMed] [Google Scholar]
- 24. [Accessed January 9, 2012];Caliper-LifeSciences. IVIS 200 Series. http://www.caliperls.com/products/preclinical-imaging/ivis-imagingimagingsystem-200-series.htm.
- 25.Diaz Encarnacion MM, Griffin MD, Slezak JM, et al. Correlation of quantitative digital image analysis with the glomerular filtration rate in chronic allograft nephropathy. Am J Transplant. 2004;4:248–256. doi: 10.1046/j.1600-6143.2003.00311.x. [DOI] [PubMed] [Google Scholar]
- 26.Bland JM, Altman DG. Statistical methods for assessing agreement between two methods of clinical measurement. Lancet. 1986;1:307–310. [PubMed] [Google Scholar]
- 27.Guo Y, Zhang Y, Klein R, et al. Irreversible electroporation therapy in the liver: longitudinal efficacy studies in a rat model of hepatocellular carcinoma. Cancer Res. 2010;70:1555–1563. doi: 10.1158/0008-5472.CAN-09-3067. [DOI] [PMC free article] [PubMed] [Google Scholar]
- 28.Yang W, Ahmed M, Elian M, et al. Do liposomal apoptotic enhancers increase tumor coagulation and end-point survival in percutaneous radiofrequency ablation of tumors in a rat tumor model? Radiology. 2010;257:685–696. doi: 10.1148/radiol.10100500. [DOI] [PMC free article] [PubMed] [Google Scholar]
- 29.Solazzo SA, Ahmed M, Schor-Bardach R, et al. Liposomal doxorubicin increases radiofrequency ablation-induced tumor destruction by increasing cellular oxidative and nitrative stress and accelerating apoptotic pathways. Radiology. 2010;255:62–74. doi: 10.1148/radiol.09091196. [DOI] [PMC free article] [PubMed] [Google Scholar]
- 30.Lee EW, Chen C, Prieto VE, et al. Advanced hepatic ablation technique for creating complete cell death: irreversible electroporation. Radiology. 2010;255:426–433. doi: 10.1148/radiol.10090337. [DOI] [PubMed] [Google Scholar]
- 31.Cho YK, Kim Y, Rhim H. Pitfalls in the radiological and pathological correlation of tumour response rates of hepatocellular carcinoma following radiofrequency ablation. J Clin Pathol. 2009;62:1071–1073. doi: 10.1136/jcp.2009.069716. [DOI] [PubMed] [Google Scholar]
- 32.Bradbury MS, Hambardzumyan D, Zanzonico PB, et al. Dynamic small-animal PET imaging of tumor proliferation with 3′-deoxy-3′-18F-fluorothymidine in a genetically engineered mouse model of high-grade gliomas. J Nucl Med. 2008;49:422–429. doi: 10.2967/jnumed.107.047092. [DOI] [PMC free article] [PubMed] [Google Scholar]
- 33.Newell P, Villanueva A, Friedman SL, et al. Experimental models of hepatocellular carcinoma. J Hepatol. 2008;48:858–879. doi: 10.1016/j.jhep.2008.01.008. [DOI] [PMC free article] [PubMed] [Google Scholar]
- 34.Yang JD, Nakamura I, Roberts LR. The tumor microenvironment in hepatocellular carcinoma: Current status and therapeutic targets. Semin Cancer Biol. 2011;21:35–43. doi: 10.1016/j.semcancer.2010.10.007. [DOI] [PMC free article] [PubMed] [Google Scholar]
- 35.Hsu AR, Cai W, Veeravagu A, et al. Multimodality molecular imaging of glioblastoma growth inhibition with vasculature-targeting fusion toxin VEGF121/rGel. J Nucl Med. 2007;48:445–454. [PubMed] [Google Scholar]
- 36.Inoue Y, Masutani Y, Kiryu S, et al. Integrated imaging approach to tumor model mice using bioluminescence imaging and magnetic resonance imaging. Mol Imaging. 2010;9:163–172. [PubMed] [Google Scholar]
- 37.Song HT, Jordan EK, Lewis BK, et al. Rat model of metastatic breast cancer monitored by MRI at 3 tesla and bioluminescence imaging with histological correlation. J Transl Med. 2009;7:88. doi: 10.1186/1479-5876-7-88. [DOI] [PMC free article] [PubMed] [Google Scholar]
- 38.Inoue Y, Izawa K, Tojo A, et al. Monitoring of disease progression by bioluminescence imaging and magnetic resonance imaging in an animal model of hematologic malignancy. Exp Hematol. 2007;35:407–415. doi: 10.1016/j.exphem.2006.11.006. [DOI] [PubMed] [Google Scholar]
- 39.Koo V, Hamilton PW, Williamson K. Non-invasive in vivo imaging in small animal research. Cell Oncol. 2006;28:127–139. doi: 10.1155/2006/245619. [DOI] [PMC free article] [PubMed] [Google Scholar]
- 40.Joshi CN, Jain SK, Murthy PS. An optimized triphenyltetrazolium chloride method for identification of cerebral infarcts. Brain Res Brain Res Protoc. 2004;13:11–17. doi: 10.1016/j.brainresprot.2003.12.001. [DOI] [PubMed] [Google Scholar]
- 41.Guo Y, Klein R, Omary RA, et al. Highly malignant intra-hepatic metastatic hepatocellular carcinoma in rats. Am J Transl Res. 2010;3:114–120. [PMC free article] [PubMed] [Google Scholar]
- 42.Thompson SM, Callstrom MR, Knudsen B, et al. AS30D Model of Hepatocellular Carcinoma: Tumorigenicity and Preliminary Characterization by Imaging, Histopathology, and Immunohistochemistry. Cardiovasc Intervent Radiol. doi: 10.1007/s00270-012-0466-1. Epub 25Aug 2012. [DOI] [PMC free article] [PubMed] [Google Scholar]
- 43.Lencioni R. Loco-regional treatment of hepatocellular carcinoma. Hepatology. 2010;52:762–773. doi: 10.1002/hep.23725. [DOI] [PubMed] [Google Scholar]
- 44.McWilliams JP, Yamamoto S, Raman SS, et al. Percutaneous ablation of hepatocellular carcinoma: current status. J Vasc Interv Radiol. 2010;21:S204–213. doi: 10.1016/j.jvir.2009.11.025. [DOI] [PubMed] [Google Scholar]
- 45.Poff JA, Allen CT, Traughber B, et al. Pulsed high-intensity focused ultrasound enhances apoptosis and growth inhibition of squamous cell carcinoma xenografts with proteasome inhibitor bortezomib. Radiology. 2008;248:485–491. doi: 10.1148/radiol.2482071674. [DOI] [PMC free article] [PubMed] [Google Scholar]
- 46.Kagawa T, Koizumi J, Kojima S, et al. Transcatheter arterial chemoembolization plus radiofrequency ablation therapy for early stage hepatocellular carcinoma: comparison with surgical resection. Cancer. 2010;116:3638–3644. doi: 10.1002/cncr.25142. [DOI] [PubMed] [Google Scholar]
- 47.Kadivar F, Soulen MC. Enhancing ablation: synergies with regional and systemic therapies. J Vasc Interv Radiol. 2010;21:S251–256. doi: 10.1016/j.jvir.2010.01.048. [DOI] [PubMed] [Google Scholar]
Associated Data
This section collects any data citations, data availability statements, or supplementary materials included in this article.
Supplementary Materials
Supplemental Digital Content 1 (Figure)—Comparison of quantitative 2D bioluminescent radiance (p/s/cm2/sr) between N1S1 empty vector (N=3) and HSE-luc (N=4) tumors at day 7-post cell injection. Data demonstrate significantly higher radiance in the HSE-luc group compared to the empty vector group (mean±SD: 11,305±970.1 v. 489.0±48.8 p/s/cm2/sr, respectively; p<0.01)
Supplemental Digital Content 2 (Figure)——3D diffuse luminescence tomography (DLIT) and gross pathology of small intrahepatic metastasis of N1S1 HSE-luc tumor at day 21 post injection. (A) 3D DLIT demonstrates a small foci of luminescent signal adjacent to main tumor (white arrowhead). (B) Corresponding gross pathology confirms 1-2mm tumor metastasis (white arrowhead) 5-6mm from the tumor mass (t).
Supplemental Digital Content 3 (Figure)——Agreement in tumor dimensions measured by 3D diffuse luminescence tomography (DLIT) and 3T MRI as the gold standard. Bland-Altman analysis demonstrates good agreement within 2-3 mm between the two modalities for measuring tumor dimensions.
Supplemental Digital Content 4 (Video)——Co-registration of three dimensional (3D) maximum intensity projection (MIP) reconstruction from FSE T2 MRI and 3D DLIT image in an N1S1 HSE-luc rat at day 14 post injection. Video clip of 3D MIP demonstrates the location and morphology of the tumor and the brightness of the bioluminescent tumor signal co-registered to the MR image.


