

Abstract
Orexin receptor antagonism represents a novel approach for the treatment of insomnia that directly targets sleep/wake regulation. Several such compounds have entered into clinical development, including the dual orexin receptor antagonists, suvorexant and almorexant. In this study, we have used equilibrium and kinetic binding studies with the orexin-2 (OX2) selective antagonist radioligand, [3H]-EMPA, to profile several orexin receptor antagonists. Furthermore, selected compounds were studied in cell-based assays of inositol phosphate accumulation and ERK-1/2 phosphorylation in CHO cells stably expressing the OX2 receptor that employ different agonist incubation times (30 and 5 min, respectively). EMPA, suvorexant, almorexant and TCS-OX-29 all bind to the OX2 receptor with moderate to high affinity (pKI values ≥ 7.5), whereas the primarily OX1 selective antagonists SB-334867 and SB-408124 displayed low affinity (pKI values ca. 6). Competition kinetic analysis showed that the compounds displayed a range of dissociation rates from very fast (TCS-OX2-29, koff = 0.22 min−1) to very slow (almorexant, koff = 0.005 min−1). Notably, there was a clear correlation between association rate and affinity. In the cell-based assays, fast-offset antagonists EMPA and TCS-OX2-29 displayed surmountable antagonism of orexin-A agonist activity. However, both suvorexant and particularly almorexant cause concentration-dependent depression in the maximal orexin-A response, a profile that is more evident with a shorter agonist incubation time. Analysis according to a hemi-equilibrium model suggests that antagonist dissociation is slower in a cellular system than in membrane binding; under these conditions, almorexant effectively acts as a pseudo-irreversible antagonist.
Linked ArticlesThis article is part of a themed section on Orexin Receptors. To view the other articles in this section visit http://dx.doi.org/10.1111/bph.2014.171.issue-2
Keywords: orexin, kinetics, equilibrium, suvorexant, almorexant, EMPA, association, dissociation, ERK, inositol phosphate
Introduction
The family of orexin receptors (also known as hypocretin receptors) belongs to the superfamily of GPCRs. It has two receptor subtypes, known as OX1 and OX2; both are known to couple to Gq/11 leading to increases in intracellular Ca2+ concentrations via the activation of phospholipase C (Sakurai et al., 1998). The OX2 subtype has also been shown to regulate cAMP signalling via activation of both Gs and Gi proteins (Tang et al., 2008).
OX1 and OX2 receptors are localized almost exclusively in the brain; OX1 is most highly expressed in the hypothalamus and locus coreruleus, whereas OX2 is also predominantly localized within the hypothalamus as well as the cortex. Orexins A and B are the natural peptide hormones for OX1 and OX2. Both are derivatives of prepro-orexin through proteolytic cleavage sharing approximately 50% sequence homology. Orexin-A has been found to be equipotent for OX1 and OX2 whereas orexin-B is 10-fold selective for OX2 over OX1 (Sakurai et al., 1998). Although initially identified as controlling food intake, it is now widely recognized that the orexinergic system is an important regulator of the arousal state, encompassing feeding behaviour, sleep/wake regulation, reward and regulation of respiration and the cardiovascular system.
Although largely located within the hypothalamus, orexinergic neuronal cell bodies are known to project towards the pituitary (Peyron et al., 1998). Hormone secretions from these glands are known for the role they play in the maintenance of the circadian rhythms. A morning ‘surge’ in levels of orexin peptides promotes arousal and wakefulness. Levels are maintained throughout the day but drop off at night during the transition from wakefulness to sleep. Prepro-orexin knockout (KO) mice show characteristics associated with narcolepsy (Scammell et al., 2000); the disruption of the ability to release these peptides essentially resulting in a disrupted circadian rhythm. Similarly, KO mice lacking orexin receptors also show signs of narcolepsy, an effect that is more pronounced in mice lacking the OX2 receptor than the OX1 subtype (Scammell et al., 2000). This evidence highlights the important role of the orexin-signalling pathway, particularly the OX2 receptor, in the maintenance of the sleep/wake cycle. Furthermore, this system appears to be well conserved across mammalian species, up to and including humans (Wong et al., 2011).
Currently, the main courses of treatment for insomnia are benzodiazepine and ‘benzo-like’ drugs which act to enhance the effect of neurotransmitter GABA, resulting in sedative, hypnotic and anxiolytic actions, making them commonly used to treat a wide range of disorders aside from insomnia (Durlach et al., 2002). Side effects are also varied, ranging from depression, dependence and sexual dysfunction to more paradoxical aggression and impulsivity; for these reasons, they are only available under prescription and treatments are limited to 4 weeks to avoid addiction. Newer treatments used are drugs such as zolpidem that, although chemically distinct from benzodiazepines, are also positive allosteric modulators of GABAA receptors and share similar benefits and risks (Wagner et al., 1998). Particularly with respect to insomnia, they share the more acute side effects of disrupting sleep architecture and reducing rapid eye movement as well as producing drowsiness, cognitive deficits and a lack of coordination the morning after administration.
Investigations using the dual orexin receptor antagonists (DORAs), almorexant and suvorexant, show that they act to promote sleep without disrupting the normal circadian rhythm. This has been shown both preclinically and in man (Hoever et al., 2012a,b2012b). This presents a promising more directed approach to treating insomnia than the existing drug therapies. A major hope for orexin receptor antagonists is that they will act more selectively to regulate the sleep/wake cycle (by preventing the drive to stay awake) and lack the general CNS depressant effects of GABAA receptor-targeting therapies. Clearly, the duration of action of orexin antagonist hypnotics will depend on both the pharmacokinetics (the rate of clearance from the site of action) and drug-receptor kinetics (the residence time of the antagonist on the orexin receptor). While pharmacokinetics is routinely considered as part of drug discovery, receptor kinetics is only more recently being appreciated as an important component of drug action (Malerczyk et al., 1998; Behm et al., 2010). Examples are mainly found for drug targets requiring slow binding kinetics such as the muscarinic M3 receptor where antagonists are used to treat chronic obstructive pulmonary disease. Tiotropium was found to have a very long receptor half-life (>12 h) making it suitable for once daily administration via inhalation (Dowling and Charlton, 2006). Another example are atypical antipsychotic drugs used to treat schizophrenia, which act as antagonists of the dopamine D2 receptor. These vary in their propensity to cause extrapyramidal side effects, an effect which appears to be directly related to the dissociation rate from the receptor; fast dissociating antagonists are more able to equilibrate with synaptic dopamine levels to avoid such adverse effects (Kapur and Seeman, 2001).
In this study, we have used competitive kinetics radioligand binding and cell-based functional assays to investigate the kinetics of binding of orexin-2 receptor antagonists (Figure 1), including the clinically evaluated dual orexin receptor antagonists, almorexant and suvorexant. Binding studies suggest that almorexant and, to a lesser extent, suvorexant, dissociate slowly from the orexin-2 receptor, whereas high affinity antagonists such as EMPA exhibit significantly faster binding kinetics. These observations were supported by cell-based inositol phosphate and ERK-1/2 assays, where slowly dissociating antagonists prevented assays reaching equilibrium, depressing the maximal response to orexin-A and appearing insurmountable under the conditions tested. Furthermore, using an operational model of orthosteric antagonism that is suitable for interrogating competitive ligand-receptor interactions under conditions of hemi-equilibrium, we have demonstrated that it is possible to delineate ligand dissociation rates from functional assay data sets.
Figure 1.

Chemical structures of compounds tested along with details of selectivity for OX1 versus OX2 receptor subtypes. T = tritium.
Methods
Radioligand binding
Cell membranes from HEK293 cells transiently expressing the human OX2 receptor (Supporting Information) were incubated with [3H]-EMPA in Krebs assay buffer (8.5 mM HEPES, 1.3 mM CaCl2, 1.2 mM MgSO4, 118 mM NaCl, 4.7 mM KCl, 4 mM NaHCO3, 1.2 mM KH2PO4, 11 mM glucose, pH 7.4) in a total assay volume of 0.25 mL with a final DMSO concentration of 1%. After 90 min incubation at room temperature, the reaction was terminated by rapid filtration through GF/B 96-well glass fibre plates with 5 × 0.25 mL washes with ddH2O using a Tomtec cell harvester. Bound radioactivity was determined through liquid scintillation using Lablogic SafeScint and detected on a microbeta liquid scintillation counter. Non-specific binding was determined as that remaining in the presence of a 10 μM saturating concentration of the antagonist EMPA. Saturation studies were carried out by incubating membranes (2 μg protein/well) with a range of concentrations of [3H]-EMPA (0.4 nM–15 nM). Radioligand concentrations were determined using SafeScint and a Beckman LS 6000 liquid scintillation counter. Competition binding was performed incubating membranes (2 μg protein/well) with 1.5 nM concentration of [3H]-EMPA and a range of concentrations of the test compound.
Association kinetics for the radioligand were determined by adding the same cell membrane (2 μg protein/well) to wells containing Krebs buffer with 1% DMSO and 1.5 nM radioligand at various time points up to a total of 3 h. Dissociation kinetics were determined by pre-equilibrating membranes and [3H]-EMPA for 90 min; a saturating concentration of cold EMPA (100 μM) was then added at various time points to prevent re-association of the radioligand as it dissociates from the receptor.
Kinetics of binding of unlabelled compounds was determined using the method of Motulsky and Mahan (1984) In brief, association curves for [3H]-EMPA in the absence or presence of three concentrations of competitive antagonist (typically 0.3, 1 and 3 x KI value). Association and dissociation rate constants for unlabelled compounds were determined by global analysis of the association data sets, as previously described (Dowling and Charlton, 2006); association and dissociation rate constants for [3H]-EMPA were fixed allowing the model to provide estimates of kon and koff for the test compounds. Ligand-receptor half-lives were calculated as 0.693/koff.
Functional inositol phosphate and ERK1/2 phosphorylation assays
Cell-based inositol phosphate (Cisbio BioAssays, Codolet, France) and ERK1/2 phosphorylation (Surefire, PerkinElmer, Waltham, MA, USA) functional assays were performed in 96-well plates 24 h after seeding with CHO cells stably expressing the human orexin-2 receptor at a density of 25 000 cells/well; full assay details are in the Supporting Information.
Data analysis
For [3H]-EMPA saturation binding studies, data were globally fitted using Prism 5.04 (GraphPad, San Diego, CA, USA) with a rectangular hyperbola taking into account one site-total and non-specific binding to determine receptor number (Bmax) and the dissociation rate constant (KD)
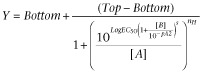
where Y is radioligand binding, Bmax is the total receptor density, [A] is the radioligand concentration, KD is the equilibrium dissociation constant of the radioligand and NS is the fraction of non-specific radioligand binding. For radioligand inhibition binding experiments, a one-site binding equation was fitted to the specific binding of each competitive ligand
where Top and Bottom are the maximal and minimal asymptotes of the curve, respectively, Log[B] is the concentration of competitor, LogIC50 is the logarithm of the concentration of inhibitor that reduces half the maximal radioligand binding for each binding site and nH is the Hill slope. IC50 values were converted to KI values (equilibrium dissociation constant) using the equation of Cheng and Prusoff (1973).
Association and dissociation rate constants for [3H]-EMPA binding were determined by global analysis of the association and dissociation binding curves according to mono-exponential association and decay curves to generate estimates of the dissociation (koff) and observed association (kobs) rates for ligand binding; the association rate constant (kon) was determined according to the following relationship
The kinetic equilibrium dissociation constant KD was calculated as koff/kon; ligand-receptor half-life was calculated as 0.693/koff. For competition kinetics, the [3H]-EMPA curves in the presence and absence of test antagonist, data were fitted to the methods of Motulsky and Mahan (1984) using following equation(s), as described in Dowling and Charlton (2006)
where t is time (min), Y is specific binding, k1 is the kon value for [3H]-EMPA, k2 is the koff value for [3H]-EMPA, [L] is the concentration of [3H]-EMPA used (nanomolar), and [I] is the concentration of unlabelled antagonist (nanomolar). Fixing the above parameters allowed the following to be simultaneously calculated: Bmax is total binding, k3 is the association rate of unlabelled ligand (M−1·min−1) or kon and k4 is the dissociation rate of unlabelled ligand (min−1) or koff.
Concentration-response curves to orexin-A were analysed according to the following equation
where Top and Bottom are the maximal and minimal asymptotes of the curve, respectively, Log[B] is the concentration of competitor, LogEC50 is the logarithm of the concentration of inhibitor that produces a half-maximal response and nH is the Hill slope. Curve-shift data sets for each antagonist in functional assays were analysed according to the same equation with the Bottom and slope parameters shared across all data sets; the value of Top was left to float to determine, if any, the degree of depression of the maximal agonist response.
For antagonists with minimal or no depression in the maximal response, data were fitted according to the following equation
 |
where Top represents the maximal asymptote of the curves, Bottom represents the minimum asymptote of the curves, LogEC50 represents the logarithm of the agonist EC50 in the absence of antagonist, [A] represents the concentration of orexin-A, [B] represents the concentration of the antagonist, nH represents the Hill slope of the agonist curve, s represents the Schild slope for the antagonist, and pA2 represents the negative logarithm of the concentration of antagonist that shifts the agonist EC50 by a factor of 2. In the absence of antagonist ([B] = 0), this equation becomes the standard four-parameter logistic equation for fitting agonist concentration-response data.
Competitive ligand-receptor interactions in functional assays are traditionally analysed using the method of Arunlakshana and Schild (1959) whereas irreversible antagonism can be quantified using the method of Gaddum et al. (1955). However, many functional assays, while profiling competitive antagonists, are run under conditions in which equilibrium may not be reached (‘hemi-equilibrium’) and as such they depress the maximal agonist response. Accordingly, the functional data for suvorexant and almorexant were fitted according to a combined operational and hemi-equilibrium model for competitive antagonism under non-equilibrium conditions (Kenakin, 2009)
where [A] and [B] represent the concentrations of orexin-A and antagonist, respectively, KA and KB represent the respective equilibrium dissociation constants, koff is the dissociation rate constant for the antagonist (min−1), t is the assay incubation time (min), τ is the operational efficacy of orexin-A (comprising cell- and agonist-dependent properties) and Em is the maximal system response. All parameters were shared across all data sets except t and Em, which were fixed to the assay incubation time, and 100 (if required), respectively. For almorexant, a comparison between a data fits with the koff unconstrained and constrained to zero was made using Akaike's Information Criterion (Motulsky and Christopoulos, 2003). In all cases, potency and affinity values were estimated as logarithms (Christopoulos, 1998). Data shown are the mean ± SEM.
Results
Equilibrium [3H]-EMPA binding
Specific binding of [3H]-EMPA represented greater than 95% of total binding and was fully saturable. Non-specific binding was minimal and increased linearly with radioligand concentration (data not shown). [3H]-EMPA bound to the OX2 receptor with high affinity (KD = 1.4 ± 0.2 nM; n = 3) and in a monophasic manner with a maximal binding capacity of 16.5 ± 0.3 pmol mg·protein−1. Ligand depletion at the KD concentration accounted for less than 5% of the total radioligand added.
Figure 2 shows the inhibition of [3H]-EMPA binding by a range of orexin receptor antagonists; all antagonists tested fully displaced [3H]-EMPA specific binding. Compounds that are reported to be either dual orexin receptor antagonists or OX2-selective showed high affinities for the OX2 receptor, with suvorexant, almorexant, EMPA and TCS-OX2-29 having pKI values of 8.9 ± 0.2, 8.0 ± 0.1, 8.9 ± 0.3 and 7.5 ± 0.4, respectively (Table 1959). Compounds which have been reported to be selective for the OX1 receptor displayed low affinity for the OX2 receptor with SB-408124 and SB-334867 having pKI values of 6.0 ± 0.2 and 6.1 ± 0.2, respectively (see Table 1959).
Figure 2.

Competition for [3H]–EMPA binding to OX2-expressing HEK293 cell membranes showing the displacement of increasing concentrations by test compounds. Data are representative of at least five independent experiments; error bars show SEM.
Table 1.
Kinetic binding parameters of various orexin receptor antagonists at the OX2 receptor (in ascending order of half life)
| Antagonist | kon (M–1·min–1) | koff (min–1) | t½ (min) | Kinetic pKD | Competition pKI |
|---|---|---|---|---|---|
| TCS-OX2-29 | 1.6 ± 0.075 × 10⁶ | 0.22 ± 0.026 | 3.2 ± 0.42 | 6.9 ± 0.034 | 7.5 ± 0.20 |
| EMPAa | 5.0 ± 1.7 × 10⁷ | 0.094 ± 0.013 | 7.8 ± 1.0 | 8.6 ± 0.24 | 8.9 ± 0.20 |
| SB 334867 | 7.5 ± 6.4 × 10³ | 0.077 ± 0.065 | 25 ± 11 | 5.1 ± 0.22 | 6.1 ± 0.13 |
| SB 408124 | 4.6 ± 2.2 × 10³ | 0.017 ± 0.0043 | 53 ± 13 | 5.3 ± 0.24 | 6.0 ± 0.090 |
| Suvorexant | 2.9 ± 0.34 × 10⁶ | 0.012 ± 0.0028 | 79 ± 20 | 8.4 ± 0.13 | 8.9 ± 0.14 |
| Almorexant | 1.1 ± 0.14 × 10⁶ | 0.0050 ± 0.0017 | 242 ± 138 | 8.3 ± 0.13 | 8.0 ± 0.042 |
All kinetic data were obtained from competition kinetic studies with the exception of [3H]–EMPA that was obtained through direct association and dissociation measurements (Figure 3). Data represent mean ± SEM of n ≥ three independent experiments.
Kinetic [3H]-EMPA binding
Direct kinetic binding studies indicated that [3H]-EMPA associates rapidly with the OX2-receptor, reaching equilibrium within 30 min; dissociation occurs over a similar time frame when the ligand-receptor complex is exposed to a saturating concentration of unlabelled EMPA ( Figure 3). The dissociation rate constant (koff) was estimated to be 0.09 ± 0.01 min−1, leading to a calculated half-life of 7.8 min. Further analysis yielded an estimate for the association rate constant (kon) of 5.0 ± 1.7 × 10⁷ M−1·min−1.
Figure 3.
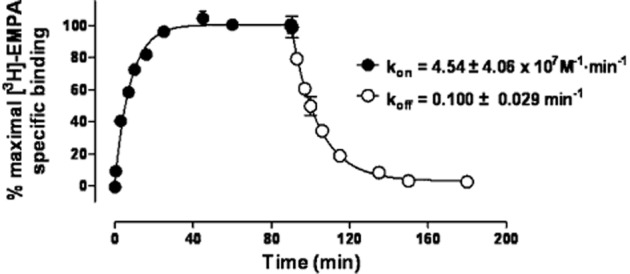
Kinetic binding profile of [3H]–EMPA binding to OX2-expressing HEK293 cell membranes. Association (closed circles) and dissociation (open circles) expressed as percentage of maximum specific binding and globally fit using Prism 5.04. Data are representative of three independent experiments and vertical lines show SEM.
In order to determine the binding kinetics of the test antagonists, a competition kinetics method was performed (Motulsky and Mahan, 1984; Dowling and Charlton, 2006). Figure 4 shows the effect of multiple concentrations of unlabelled test compounds on the association binding kinetics of [3H]-EMPA. By fixing the association and dissociation rate constants for [3H]-EMPA to the values previously determined, it was possible to obtain kinetic parameters for binding of the test compounds; these are summarized in Table 1959. The rank order of dissociation half-lives for the test compounds was almorexant > suvorexant > SB-408124 > SB-334867 > EMPA > TCS-OX2-29. The varying profiles of the association curves are consistent with those described in Dowling and Charlton (2006), whereby for a competing compound with slower kinetics than [3H]-EMPA, the binding of the rapidly associating radioligand overshoots the eventual level of equilibrium binding (the final time point of each curve represents what would be detected in a normal equilibrium competition binding assay at each concentration). The difference in profiles for fast and slow binders is best exemplified by TCS-OX2-29 and almorexant, which show a 44-fold difference in estimated dissociation rate (Figure 4; Table 1959). It is notable that, despite identical equilibrium binding affinities, EMPA and suvorexant display very different kinetics of binding. In order to verify the kinetic approach, the pKD values for the test antagonists were calculated as a ratio of estimated koff and kon values; a comparison between these values and the competition pKI values is shown in Table 1959 and Figure 5A. Deming linear regression the two (compared with a line of y = x) demonstrates that the two methods of obtaining compound affinities produce comparable results, validating the indirect kinetic method. Interestingly, comparison of the equilibrium binding-derived affinity with both kon (Figure 5B) and koff (Figure 5C) showed that there is a clear correlation between association rate and equilibrium affinity, whereas there appears to be no correlation between affinity and dissociation rate.
Figure 4.
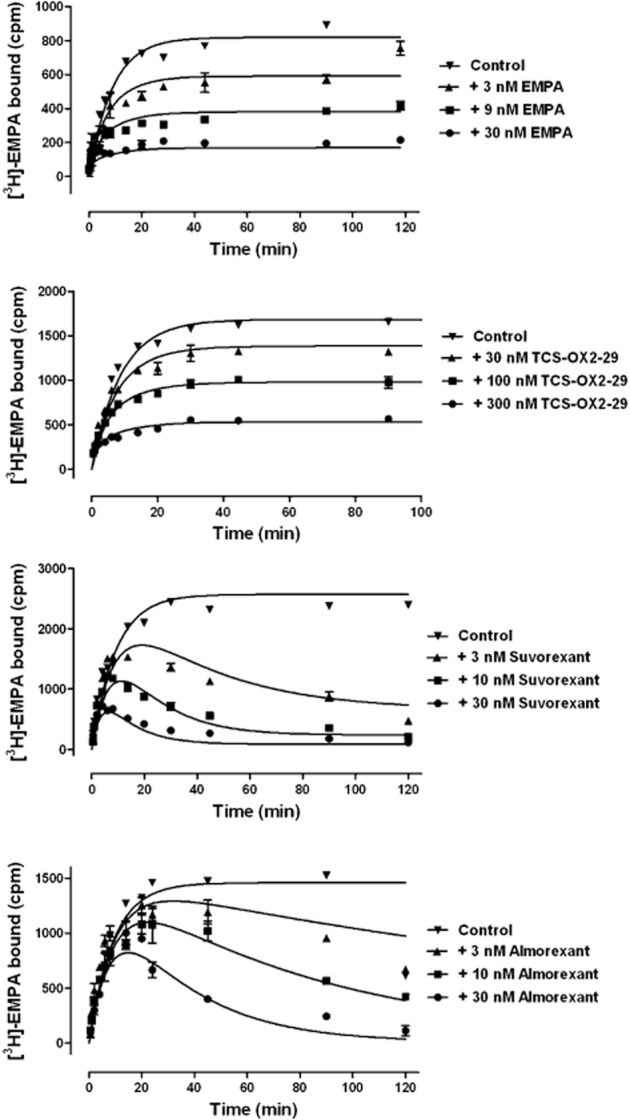
Competition kinetics curves for [3H]-EMPA binding to OX2-expressing (HEK293) cell membranes in the presence of increasing concentrations of EMPA, TCS-OX2-29, suvorexant and almorexant. Plates were incubated at room temperature for the time points indicated. Data are representative of at least three independent experiments and vertical lines show SEM.
Figure 5.

Deming linear correlations between (A) kinetically derived pKD and pKI values derived from equilibrium competition binding (slope = 1.2 ± 0.1; slope significantly non-zero, P < 0.01, extra sum of squares F-test) and (B) Log kon and equilibrium competition binding pKI values (slope = 1.3 ± 0.3; slope significantly non-zero, P < 0.01, extra sum of squares F-test). (C) Lack of correlation of Log koff and equilibrium competition binding pKI values. Dotted line shows y = x, vertical and horizontal lines show SEM.
Inositol phosphate accumulation and pERK1/2 assays
In order to determine whether the kinetics of ligand binding had meaningful effects in commonly used cell-based functional assays, the antagonist profile of EMPA, TCS-OX2-29, suvorexant and almorexant versus orexin-A activation was determined in inositol phosphate accumulation and ERK1/2 phosphorylation assays, which employ 30 min and 5 min agonist incubation times, respectively.
Orexin-A potently stimulated inositol phosphate accumulation in CHO-OX2 cells, with a pEC50 = 8.4 ± 0.1 (n = 3; Figure 6). Both TCS-OX2-29 and EMPA caused a concentration-dependent, parallel, rightward shift in the concentration response curve to orexin-A (Figure 6), with minimal effect on the maximum asymptote of the curve (Figures 6 and 8). Schild analysis estimated pA2 values of 7.4 ± 0.1 and 7.9 ± 0.2 for TCS-OX2-29 and EMPA, respectively, with Schild slope values not significantly different from unity (1.07 ± 0.04 and 1.12 ± 0.08, respectively; two-tailed T-test: P = 0.22 and P = 0.27, respectively). These data are consistent with a competitive mechanism of action under equilibrium conditions.
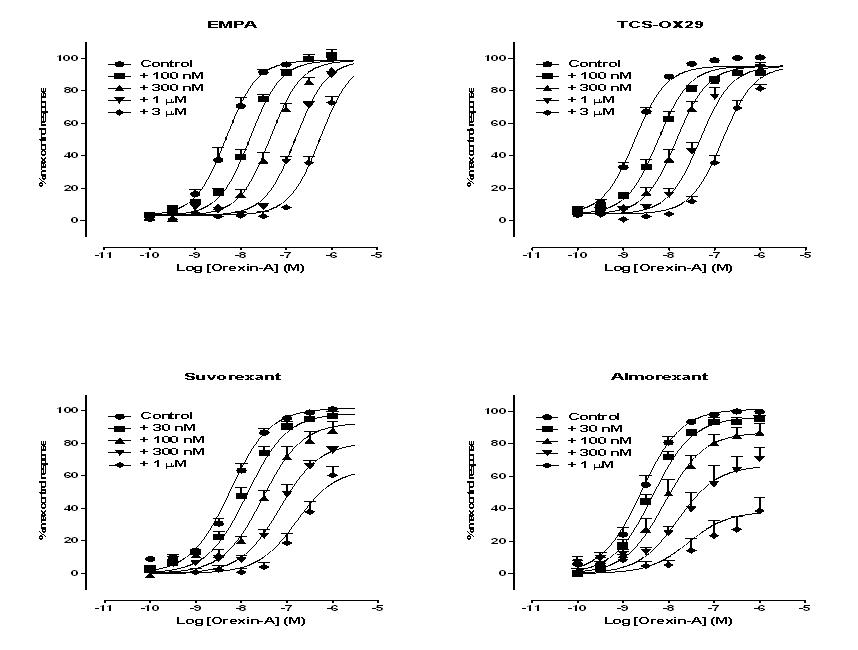
Figure 6.

Effect of increasing concentrations of (A) EMPA, (B) TCS-OX-29, (C) suvorexant and (D) almorexant on orexin-A stimulated inositol phosphate accumulation in CHO-hOX2 cells. Data were fitted according to a four-parameter logistic equation with values for the minimum asymptote and Hill slopes shared across all of the data sets. Data represent the mean of at least three independent experiments; vertical lines show SEM.
Figure 8.
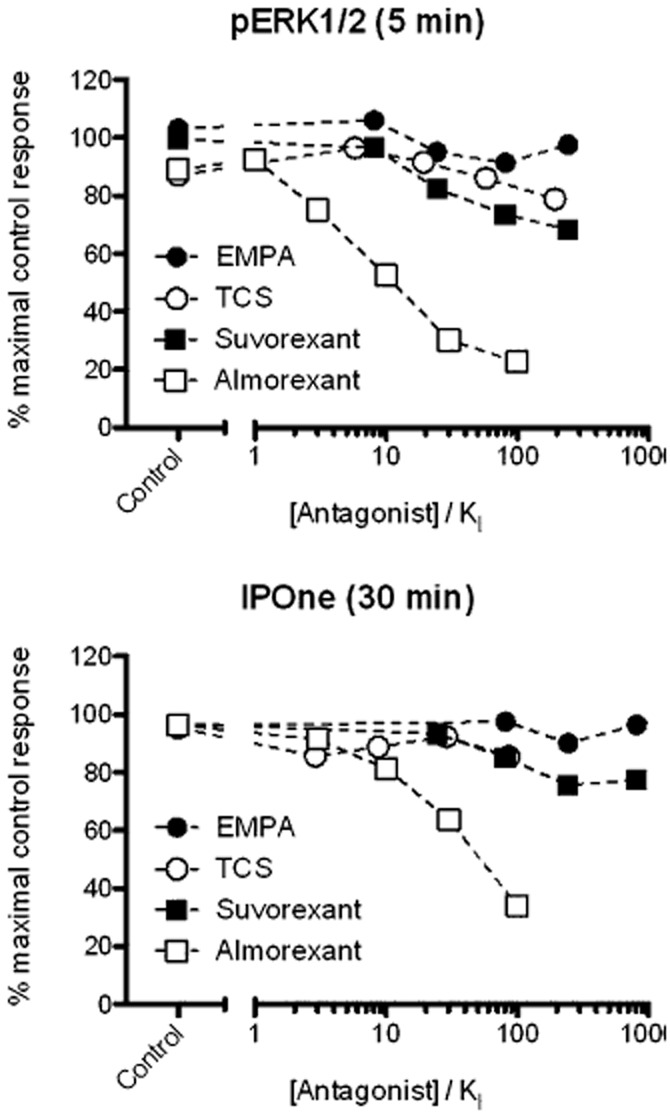
Comparison of depression of the orexin-A maximal response in (A) ERK1/2 phosphorylation and (B) inositol phosphate accumulation assays as a function of antagonist concentration. Data are taken from fitted maximal asymptotes for each antagonist as shown in Figures 6 and 7.
Orexin-A also potently stimulated ERK1/2 phosphorylation in CHO-OX2 cells, with a pEC50 = 8.9 ± 0.1 (n = 3; Figure 7). As with the inositol phosphate assay, both TCS-OX2-29 and EMPA caused a concentration-dependent, parallel, rightward shift in the concentration response curve to orexin-A, with minimal effect on the maximum asymptote of the curve (Figures 7 and 8). Schild analysis estimated pA2 values of 6.7 ± 0.1 and 7.9 ± 0.3 for TCS-OX2-29 and EMPA, respectively, with Schild slope values of 1.12 ± 0.08 and 1.50 ± 0.19 respectively; Supporting Information Fig. S2). Neither of these Schild slope values is significantly different to unity (two-tailed T-test: P = 0.22 and P = 0.12, respectively), suggestive of a competitive mechanism of action. However, the Schild slope of 1.5 for EMPA may be indicative of inadequate time for the antagonist to re-equilibrate with orexin-A and the receptor, even for a relatively ‘fast on-fast off’ ligand such as EMPA that does not appear to reduce the maximal agonist response (Kenakin, 2009; Figure 8).
Figure 7.

Effect of increasing concentrations of (A) EMPA, (B) TCS-OX-29, (C) suvorexant and (D) almorexant on orexin-A stimulated ERK1/2 phosphorylation in CHO-hOX2 cells. Data were fitted according to a four-parameter logistic equation with values for the minimum asymptote and Hill slopes shared across all of the data sets. Data represent the mean of at least three independent experiments; vertical lines show SEM.
In the inositol phosphate assay, both suvorexant and almorexant also caused a rightward shift in the concentration response curve to orexin-A, but at higher antagonist concentrations the maximal orexin-A response was markedly reduced, particularly for almorexant (Figures 6 and 8). Similar effects on the maximal agonist response were observed in the ERK1/2 phosphorylation assay (Figures 7 and 8). For almorexant in the ERK1/2 assay, there is very little apparent shift in the curve at concentrations that diminish the maximal response. Unsurprisingly, given the reduced amount of time for re-equilibration of antagonist and receptor, a comparison of the two assay formats suggests that the reduction in the maximal response by suvorexant and almorexant is more marked in the ERK1/2 assay than in the inositol phosphate assay (Figure 8).
While it is clear that the slower binding kinetics of suvorexant and almorexant compared to EMPA and TCS-OX2-29 contribute to their diminution of the maximal orexin-A response, we sought to generate an estimates of the dissociation rate constants for these two compounds using an operational model for hemi-equilibrium conditions. For suvorexant, analysis of the grouped data set according to the model provided estimates of Log KB values of −7.7 and −7.9 in the inositol phosphate and ERK1/2 assays, respectively (Table 2010; Supporting Information Figs S1 and S2). The model also provided estimates of the dissociation rate constants (koff), yielding values of 0.00057 min−1 and 0.0043 min−1 in inositol phosphate and ERK1/2 assays, respectively. Thus, the estimated dissociation rates of suvorexant are approximately three and 21-fold slower than that determined by membrane-based radioligand binding (Table 1959, Table 2010). For almorexant, the estimates of Log KB values were −7.4 and −7.6 in the inositol phosphate and ERK1/2 assays, respectively (Table 2010, Supporting Information Figs S1 and S2). However, such was the insurmountable nature of the response that the data were best fitted to a model where koff was constrained to zero, effectively classifying almorexant as an irreversible antagonist in these test systems.
Table 2.
Fitted parameter estimates (± fitted standard errors) for grouped data of suvorexant and almorexant-mediated antagonism of orexin-A stimulated inositol phosphate accumulation and ERK1/2 phosphorylation according to an operational hemi-equilibrium model for competitive antagonism (Kenakin, 2009)
| Suvorexant | Almorexant | |||
|---|---|---|---|---|
| IPOne | pERK1/2 | IPOne | pERK1/2 | |
| Log KA | −6.6 ± 0.2 | −7.7 ± 0.1 | −7.5 ± 0.1 | −8.2 ± 0.1 |
| Log KB | −7.7 ± 0.1 | −7.9 ± 0.1 | −7.4 ± 0.1 | −7.6 ± 0.1 |
| koff a (min–1) | 0.00057 ± 0.00043 | 0.0043 ± 0.0029 | = 0 | = 0 |
| t½ (min) | 1215 | 161 | ∞ | ∞ |
| Log τ | 1.6 ± 0.2 | 1.6 ± 0.1 | 1.1 ± 0.1 | 0.9 ± 0.1 |
| Em b | 104 | = 100 | 111 | = 100 |
For almorexant, comparison of curve fits with koff unconstrained and constrained to zero indicated preference for the latter, hence t½ → ∞.
For the ERK1/2 assays the value of Em was constrained to 100% to aid fitting. Curve fits for these analyses are shown in Figures S1 and S2.
Discussion
Orexin receptor antagonism represents a potentially powerful new approach for the treatment of sleep disorders, effectively targeting the arousal drive in sleep/wake regulation, rather than acting as a generalized CNS depressant as is the case with current GABAergic pharmacotherapies. One of the perceived advantages of this approach is by selectively targeting sleep/wake regulation, orexin antagonists will lack some or all of the ‘hangover’ effects of GABAergic drugs that affect patients the morning following taking the drug. This is predicated on three main assumptions: firstly, that orexin levels increase in the morning to increase arousal and may overcome any residual receptor blockade from the night before; secondly, that the pharmacokinetics of the orexin receptor antagonist are such that receptor occupancy is minimal at the time of waking and thirdly, that the drug-receptor kinetics are such that high receptor occupancy is not prolonged until and beyond the time of waking (even in the absence of drug bathing the receptor).
It is increasingly common to study the kinetics of receptor antagonism as a part of the drug discovery process; drug-receptor kinetics has been shown to be an important factor in drug efficacy (e.g. the CCR5 antagonist, maraviroc; Dorr et al., 2005; Pullen et al., ; Jacqmin et al., 2008), duration of action (the muscarinic M3 receptor antagonist, tiotropium; Dowling and Charlton, 2006) and side-effect profile (second generation atypical antipsychotic drugs; Kapur and Seeman, 2001).
As the orexin-2 receptor has been the main subtype implicated in the efficacy of orexin receptor antagonists, in this study we sought to determine the kinetics of binding of several orexin receptor antagonists, including the clinically profiled dual orexin receptor antagonists suvorexant and almorexant at the orexin-2 receptor. For this, the competition kinetics method of Motulsky and Mahan (1984) was utilized. Furthermore, the profile of the receptor antagonists was tested in commonly used cell-based functional assays that employ different agonist incubation times (inositol phosphate accumulation and ERK1/2 phosphorylation), potentially making them differentially sensitive to antagonist hemi-equilibrium (Paton and Rang, 1965).
Equilibrium [3H]-EMPA binding suggests that almorexant, suvorexant and EMPA all bound to the OX2 receptor with high affinity (pKI values ≥ 8.0); TCS-OX2-29 displayed moderate affinity whereas the mainly OX1-selective antagonists, SB-334867 and SB-408124, displayed low affinity for the OX2-receptor. Kinetic analysis of the binding of antagonists revealed that there is a clear correlation between the association rate and equilibrium affinity for the compounds tested (Figure 5B), counter to what is intuitively considered to be the case. Indeed, there appears to be no relationship between dissociation rate and equilibrium affinity; it is notable that EMPA and suvorexant both have the same equilibrium binding affinity but differ in their dissociation rate by nearly 10-fold (Table 1959). While this correlation between association rate and affinity is perhaps unusual, it is not unprecedented and has been shown to be the case for β2-adrenoceptor agonists (Sykes and Charlton, 2012). However, further studies on larger numbers of compounds across different chemical scaffolds would be required to understand whether this effect is observed for all antagonists of the OX2-receptor.
It is clear, however, that there is a range of dissociation rates for binding to the OX2 receptor, which can differ up to 44-fold. TCS-OX2-29, EMPA and both dissociate rapidly from the receptor (t½ < 10 min); however, SB-334867, SB-408124, suvorexant and almorexant display much slower dissociation kinetics with t½ values of 25, 53, 77 and 242 min, respectively (Table 1959). The data for almorexant and EMPA agree well with previous direct kinetic measurements with tritiated versions of the compounds. These showed that EMPA displayed fast dissociation kinetics (t½ = 8.9 min; Malherbe et al., 2009a) and almorexant much slower dissociation kinetics (t½ = 105 min; Malherbe et al., 2009b; t½ = 74 min; Faedo et al., 2012). Furthermore, the kinetic KD values generated indirectly were in excellent agreement with the KI values generated by equilibrium competition binding (Figure 5A).
In order to determine whether the differences in kinetics would affect the profile in commonly used cell-based functional assays, the ability of exemplar compounds with fast kinetics (EMPA and TCS-OX2-29) and with slow kinetics (suvorexant and almorexant) to antagonize the effects of orexin-A were studied in assays of inositol phosphate accumulation and ERK1/2 phosphorylation at the OX2 receptor. These assays employed agonist incubation times of 30 and 5 min, respectively. As might be expected, both EMPA and TCS-OX-29 cause surmountable, parallel rightward shifts in the concentration response curve to orexin-A in both inositol phosphate and ERK1/2 phosphorylation assays, with little or no effect on the maximal agonist response (Figures 8). Global analysis of the data sets according to the Schild equation yielded pA2 values in the range 6.7–7.4 for TCS-OX-29 and 7.9 for EMPA (Supporting Information Figs S1 and S2). Although lower than affinity estimates measured by radioligand binding, this is consistent with previous functional affinity estimates for orexin receptor antagonists being lower than those measured by binding approaches (Cox et al., 2010). Notably, the estimated Schild slope values for all the interactions were not significantly different from unity, although for the highest slope value was observed for EMPA-mediated inhibition of orexin-A-induced ERK1/2 phosphorylation (slope = 1.5). Such an observation is potentially indicative with a lack of equilibrium in the assay system (Kenakin, 2009). Thus, even though the antagonism appears surmountable to the naked eye, the short incubation time of the ERK1/2 assay appears to prevent the re-equilibration of even a relatively rapid offset compound such as EMPA with the receptor and agonist.
With this data in mind, it was unsurprising to observe that suvorexant and almorexant, having slower dissociation rates from the OX2 receptor than EMPA, cause more marked effects on the maximal agonist response in cell-based functional assays. Suvorexant caused a concentration-dependent rightward shift in the orexin-A concentration-response curve in both assay formats with a corresponding 20–30% decrease in the maximal response, an effect particularly evident over the shorter incubation period (Figure 8). However, most notable was almorexant, which produced significant, concentration-dependent depressions in the maximal orexin-A response in both inositol phosphate and ERK1/2 phosphorylation assays with only small effects on the midpoint of the agonist curve. It is clear that the kinetic profile of both antagonists are affecting the nature of the agonist response curve in a manner that it not consistent with surmountable competition.
These data agree with previous observations for almorexant whereby it depressed the maximal orexin-A and -B responses at the OX2 receptor in manner that the authors described as ‘non-competitive’ (Malherbe et al., 2009b). It is also consistent with observed responses in functional assays with other orexin receptor antagonists at OX2 receptor (Faedo et al., 2012).
While the possibility that almorexant is a truly allosteric antagonist of orexin-A at the OX2 receptor cannot be ruled out on the basis of these data, the competitive nature of the interaction between almorexant and EMPA, itself a competitive antagonist of orexin-A, suggests that this is unlikely. It seems more probable, on the basis of the kinetic data presented, that the profiles observed in both our hands and previously (Malherbe et al., 2009b; Faedo et al., 2012) are due to the lack of equilibrium in the assay(s).
In order to understand better the functional data obtained with suvorexant and almorexant and compare it with the radioligand binding data, an analytical model that describes competitive antagonism under non-equilibrium conditions was utilized (Kenakin, 2009); see Methods for details). This model builds on the operational model (Black and Leff, 1983) and represents an intermediate situation between fully surmountable competition and insurmountable antagonism (such as for an irreversible antagonist), accounting also for receptor reserve (Kenakin, 2009). We sought to analyse the grouped data from the functional assays to determine estimates of antagonist dissociation rate in the cellular assays. By fixing the assay incubation time, it was possible to generate both estimates of antagonist affinity (Log KB) and dissociation rate constant (koff). Using this approach, the data for suvorexant yielded Log KB estimates of −7.7 and −7.9 in inositol phosphate accumulation and ERK1/2 phosphorylation assays, respectively. These values lie between previous estimates of functional affinities at the OX2 receptor (KB = 56 nM; Cox et al., 2010) and the radioligand binding values reported in this study (Table 1959). Interestingly, the assays yielded estimates of the dissociation rate of 0.00057 min−1 and 0.0043 min−1 for inositol phosphate and ERK1/2 assays, respectively (Table 2010). These represent three and 21-fold slower dissociation than measured in the competition kinetic binding method (Table 1959). While there is clearly some variability between the two assays (despite being essentially run in similar buffers and environments), it is clear that the dissociation rate for suvorexant in functional cellular systems, as opposed to in membranes, is similar if not slower. For both inositol phosphate and ERK1/2 phosphorylation assays, almorexant data also fitted to the model, yielding affinity estimates (Log KB) of −7.4 and −7.6, respectively. These values are in reasonable agreement to the radioligand binding data (Table 1959) although slightly less potent than previous functional affinity estimates at the OX2 receptor [KB = 1.5 nM, (Malherbe et al., 2009b); IC50 = 8 nM, (Brisbare-Roch et al., 2007)]. However, estimates of the dissociation rate were very small; comparison of the data fits with the value of koff left unconstrained and constrained to zero using Akaike's Information Criterion (Motulsky and Christopoulos, 2003) suggested a preference for the latter. Therefore, as with suvorexant, it seems that the dissociation kinetics in the cellular system are slower even than suggested by the binding studies (Table 1959), highlighting the importance of the cellular environment on the response observed. At least in these cellular assays, almorexant appears to be acting as an irreversible antagonist of the OX2 receptor.
The fact that the two clinical orexin receptor antagonist candidates display the slowest binding kinetics of those compounds tested is interesting and poses further questions for this mechanism of action. It is not uncommon for slow dissociation kinetics for antagonists of peptide receptors to be important or even required for efficacy in vivo; CCR5 (Dorr et al., 2005; Jacqmin et al., 2008) and neurokinin NK1 (Lindstrom et al., 2007) are examples of receptors where effectively insurmountable antagonism is important for drug efficacy. Nonetheless, as discussed above, one of the key differentiators for orexin receptor antagonists as therapies for insomnia is the proposed lack of next-day effects. In order to achieve this, prolonged orexin receptor blockade is likely to be undesirable. While pharmacokinetic parameters will dictate the levels of drug bathing the receptor, receptor kinetics may also influence receptor occupancy and pharmacodynamics, especially if the drug-receptor complex has a long half-life (Vauquelin and Van Liefde, 2006). Here, we have demonstrated that different orexin receptor antagonists display highly divergent dissociation binding kinetics that are not correlated with equilibrium binding affinity. Furthermore, dissociation rates appear to be even slower in a functional cellular assay environment than in simple membrane-based binding assays. Taken together, these data indicate that it may be important to consider the binding kinetics of orexin receptor antagonists as part of the drug discovery process.
Conflict of interest
None of the authors listed have any conflicts of interest regarding the subject matter of this paper and any claims made. The authors are all employed or have been employed by Heptares Therapeutics, a company that has carried out research into orexin antagonists in the past and is likely to continue into the future.
Supporting Information
Additional Supporting Information may be found in the online version of this article at the publisher's web-site: http://dx.doi.org/10.1111/bph.12245
Effect of increasing concentrations of (a) EMPA, (b) TCS-OX-29, (c) suvorexant and (d) almorexant on orexin-A stimulated inositol phosphate accumulation in CHO-hOX2 cells. Grouped data were fitted globally according the Schild equation for EMPA and TCS-OX2-29 and according the operational hemi-equilibrium model for suvorexant and almorexant (as detailed in Methods)
Effect of increasing concentrations of (a) EMPA, (b) TCS-OX-29, (c) suvorexant and (d) almorexant on orexin-A stimulated ERK1/2 phosphorylation in CHO-hOX2 cells. Grouped data were fitted globally according the Schild equation for EMPA and TCS-OX2-29 and according the operational hemi-equilibrium model for suvorexant and almorexant (as detailed in Methods).
References
- 1.Arunlakshana O, Schild HO. Some quantitative uses of drug antagonists. Br J Pharmacol. 1959;14:48–58. doi: 10.1111/j.1476-5381.1959.tb00928.x. [DOI] [PMC free article] [PubMed] [Google Scholar]
- 2.Behm DJ, Aiyar NV, Olzinski AR, McAtee JJ, Hilfiker MA, Dodson JW, et al. GSK1562590, a slowly dissociating urotensin-II receptor antagonist, exhibits prolonged pharmacodynamic activity ex vivo. Br J Pharmacol. 2010;161:207–228. doi: 10.1111/j.1476-5381.2010.00889.x. [DOI] [PMC free article] [PubMed] [Google Scholar]
- 3.Black JW, Leff P. Operational models of pharmacological agonism. Proc R Soc Lond B Biol Sci. 1983;220:141–162. doi: 10.1098/rspb.1983.0093. [DOI] [PubMed] [Google Scholar]
- 4.Brisbare-Roch C, Dingemanse J, Koberstein R, Hoever P, Aissaoui H, Flores S, et al. Promotion of sleep by targeting the orexin system in rats, dogs and humans. Nat Med. 2007;13:150–155. doi: 10.1038/nm1544. [DOI] [PubMed] [Google Scholar]
- 5.Cheng Y, Prusoff WH. Relationship between the inhibition constant (K1) and the concentration of inhibitor which causes 50 per cent inhibition (I50) of an enzymatic reaction. Biochem Pharmacol. 1973;22:3099–3108. doi: 10.1016/0006-2952(73)90196-2. [DOI] [PubMed] [Google Scholar]
- 6.Christopoulos A. Assessing the distribution of parameters in models of ligand-receptor interaction: to log or not to log. Trends Pharmacol Sci. 1998;19:351–357. doi: 10.1016/s0165-6147(98)01240-1. [DOI] [PubMed] [Google Scholar]
- 7.Cox CD, Breslin MJ, Whitman DB, Schreier JD, McGaughey GB, Bogusky MJ, et al. Discovery of the dual orexin receptor antagonist [(7R)-4-(5-chloro-1,3-benzoxazol-2-yl)-7-methyl-1,4-diazepan-1-yl][5-methyl-2-(2H -1,2,3-triazol-2-yl)phenyl]methanone (MK-4305) for the treatment of insomnia. J Med Chem. 2010;53:5320–5332. doi: 10.1021/jm100541c. [DOI] [PubMed] [Google Scholar]
- 8.Dorr P, Westby M, Dobbs S, Griffin P, Irvine B, Macartney M, et al. Maraviroc (UK-427,857), a potent, orally bioavailable, and selective small-molecule inhibitor of chemokine receptor CCR5 with broad-spectrum anti-human immunodeficiency virus type 1 activity. Antimicrob Agents Chemother. 2005;49:4721–4732. doi: 10.1128/AAC.49.11.4721-4732.2005. [DOI] [PMC free article] [PubMed] [Google Scholar]
- 9.Dowling MR, Charlton SJ. Quantifying the association and dissociation rates of unlabelled antagonists at the muscarinic M3 receptor. Br J Pharmacol. 2006;148:927–937. doi: 10.1038/sj.bjp.0706819. [DOI] [PMC free article] [PubMed] [Google Scholar]
- 10.Durlach J, Pages N, Bac P, Bara M, Guiet-Bara A. Biorhythms and possible central regulation of magnesium status, phototherapy, darkness therapy and chronopathological forms of magnesium depletion. Magnes Res. 2002;15:49–66. [PubMed] [Google Scholar]
- 11.Faedo S, Perdona E, Antolini M, Di Fabio R, Merlo Pich E, Corsi M. Functional and binding kinetic studies make a distinction between OX1 and OX2 orexin receptor antagonists. Eur J Pharmacol. 2012;692:1–9. doi: 10.1016/j.ejphar.2012.07.007. [DOI] [PubMed] [Google Scholar]
- 12.Gaddum JH, Hameed KA, Hathway DE, Stephens FF. Quantitative studies of antagonists for 5-hydroxytryptamine. Q J Exp Physiol. 1955;40:49–74. doi: 10.1113/expphysiol.1955.sp001097. [DOI] [PubMed] [Google Scholar]
- 13.Hoever P, de Haas SL, Dorffner G, Chiossi E, van Gerven JM, Dingemanse J. Orexin receptor antagonism: an ascending multiple-dose study with almorexant. J Psychopharmacol. 2012a;26:1071–1080. doi: 10.1177/0269881112448946. [DOI] [PubMed] [Google Scholar]
- 14.Hoever P, Dorffner G, Benes H, Penzel T, Danker-Hopfe H, Barbanoj MJ, et al. Orexin receptor antagonism, a new sleep-enabling paradigm: a proof-of-concept clinical trial. Clin Pharmacol Ther. 2012b;91:975–985. doi: 10.1038/clpt.2011.370. [DOI] [PMC free article] [PubMed] [Google Scholar]
- 15.Jacqmin P, McFadyen L, Wade JR. A receptor theory-based semimechanistic PD model for the CCR5 noncompetitive antagonist maraviroc. Br J Clin Pharmacol. 2008;65(Suppl. 1):95–106. doi: 10.1111/j.1365-2125.2008.03141.x. [DOI] [PMC free article] [PubMed] [Google Scholar]
- 16.Kapur S, Seeman P. Does fast dissociation from the dopamine d(2) receptor explain the action of atypical antipsychotics?: a new hypothesis. Am J Psychiatry. 2001;158:360–369. doi: 10.1176/appi.ajp.158.3.360. [DOI] [PubMed] [Google Scholar]
- 17.Kenakin TP. Orthosteric drug antagonism. In: Kenakin T, editor. A Pharmacology Primer. 3rd edn. London: Elsevier Academic Press; 2009. pp. 105–127. [Google Scholar]
- 18.Lindstrom E, von Mentzer B, Pahlman I, Ahlstedt I, Uvebrant A, Kristensson E, et al. Neurokinin 1 receptor antagonists: correlation between in vitro receptor interaction and in vivo efficacy. J Pharmacol Exp Ther. 2007;322:1286–1293. doi: 10.1124/jpet.107.124958. [DOI] [PubMed] [Google Scholar]
- 19.Malerczyk C, Fuchs B, Belz GG, Roll S, Butzer R, Breithaupt-Grogler K, et al. Angiotensin II antagonism and plasma radioreceptor-kinetics of candesartan in man. Br J Clin Pharmacol. 1998;45:567–573. doi: 10.1046/j.1365-2125.1998.00722.x. [DOI] [PMC free article] [PubMed] [Google Scholar]
- 20.Malherbe P, Borroni E, Gobbi L, Knust H, Nettekoven M, Pinard E, et al. Biochemical and behavioural characterization of EMPA, a novel high-affinity, selective antagonist for the OX(2) receptor. Br J Pharmacol. 2009a;156:1326–1341. doi: 10.1111/j.1476-5381.2009.00127.x. [DOI] [PMC free article] [PubMed] [Google Scholar]
- 21.Malherbe P, Borroni E, Pinard E, Wettstein JG, Knoflach F. Biochemical and electrophysiological characterization of almorexant, a dual orexin 1 receptor (OX1)/orexin 2 receptor (OX2) antagonist: comparison with selective OX1 and OX2 antagonists. Mol Pharmacol. 2009b;76:618–631. doi: 10.1124/mol.109.055152. [DOI] [PubMed] [Google Scholar]
- 22.Motulsky HJ, Christopoulos A. Fitting Models to Biological Data Using Linear and Nonlinear Regression. San Diego, CA: GraphPad; 2003. Comparing models using Akaike's Information Criterion (AIC) pp. 43–48. [Google Scholar]
- 23.Motulsky HJ, Mahan LC. The kinetics of competitive radioligand binding predicted by the law of mass action. Mol Pharmacol. 1984;25:1–9. [PubMed] [Google Scholar]
- 24.Paton WD, Rang HP. The uptake of atropine and related drugs by intestinal smooth muscle of the guinea-pig in relation to acetylcholine receptors. Proc R Soc Lond B Biol Sci. 1965;163:1–44. doi: 10.1098/rspb.1965.0058. [DOI] [PubMed] [Google Scholar]
- 25.Peyron C, Tighe DK, van den Pol AN, de Lecea L, Heller HC, Sutcliffe JG, et al. Neurons containing hypocretin (orexin) project to multiple neuronal systems. J Neurosci. 1998;18:9996–10015. doi: 10.1523/JNEUROSCI.18-23-09996.1998. [DOI] [PMC free article] [PubMed] [Google Scholar]
- 26.Pullen S, Sale H, Napier C, Mansfield R, Holbrook M. (2006). Maraviroc is a slowly reversible antagonist at the human CCR5 in a CRE luciferase reporter gene assay (abstract 504). 13th Conference on Retroviruses and Opportunistic Infections; 2006 February 5–8; Denver, CO.
- 27.Sakurai T, Amemiya A, Ishii M, Matsuzaki I, Chemelli RM, Tanaka H, et al. Orexins and orexin receptors: a family of hypothalamic neuropeptides and G protein-coupled receptors that regulate feeding behavior. Cell. 1998;92:573–585. doi: 10.1016/s0092-8674(00)80949-6. [DOI] [PubMed] [Google Scholar]
- 28.Scammell TE, Estabrooke IV, McCarthy MT, Chemelli RM, Yanagisawa M, Miller MS, et al. Hypothalamic arousal regions are activated during modafinil-induced wakefulness. J Neurosci. 2000;20:8620–8628. doi: 10.1523/JNEUROSCI.20-22-08620.2000. [DOI] [PMC free article] [PubMed] [Google Scholar]
- 29.Sykes DA, Charlton SJ. Slow receptor dissociation is not a key factor in the duration of action of inhaled long-acting beta2-adrenoceptor agonists. Br J Pharmacol. 2012;165:2672–2683. doi: 10.1111/j.1476-5381.2011.01639.x. [DOI] [PMC free article] [PubMed] [Google Scholar]
- 30.Tang J, Chen J, Ramanjaneya M, Punn A, Conner AC, Randeva HS. The signalling profile of recombinant human orexin-2 receptor. Cell Signal. 2008;20:1651–1661. doi: 10.1016/j.cellsig.2008.05.010. [DOI] [PubMed] [Google Scholar]
- 31.Vauquelin G, Van Liefde I. Slow antagonist dissociation and long-lasting in vivo receptor protection. Trends Pharmacol Sci. 2006;27:356–359. doi: 10.1016/j.tips.2006.05.001. [DOI] [PubMed] [Google Scholar]
- 32.Wagner J, Wagner ML, Hening WA. Beyond benzodiazepines: alternative pharmacologic agents for the treatment of insomnia. Ann Pharmacother. 1998;32:680–691. doi: 10.1345/aph.17111. [DOI] [PubMed] [Google Scholar]
- 33.Wong KK, Ng SY, Lee LT, Ng HK, Chow BK. Orexins and their receptors from fish to mammals: a comparative approach. Gen Comp Endocrinol. 2011;171:124–130. doi: 10.1016/j.ygcen.2011.01.001. [DOI] [PubMed] [Google Scholar]
Associated Data
This section collects any data citations, data availability statements, or supplementary materials included in this article.
Supplementary Materials
Effect of increasing concentrations of (a) EMPA, (b) TCS-OX-29, (c) suvorexant and (d) almorexant on orexin-A stimulated inositol phosphate accumulation in CHO-hOX2 cells. Grouped data were fitted globally according the Schild equation for EMPA and TCS-OX2-29 and according the operational hemi-equilibrium model for suvorexant and almorexant (as detailed in Methods)
Effect of increasing concentrations of (a) EMPA, (b) TCS-OX-29, (c) suvorexant and (d) almorexant on orexin-A stimulated ERK1/2 phosphorylation in CHO-hOX2 cells. Grouped data were fitted globally according the Schild equation for EMPA and TCS-OX2-29 and according the operational hemi-equilibrium model for suvorexant and almorexant (as detailed in Methods).