

Abstract
Triglycerides are transported in plasma by specific triglyceride-rich lipoproteins; in epidemiologic studies, increased triglyceride levels correlate with higher risk for coronary artery disease (CAD). However, it is unclear whether this association reflects causal processes. We used 185 common variants recently mapped for plasma lipids (P<5×10⁻⁸ for each) to examine the role of triglycerides on risk for CAD. First, we highlight loci associated with both low-density lipoprotein cholesterol (LDL-C) and triglycerides, and show that the direction and magnitude of both are factors in determining CAD risk. Second, we consider loci with only a strong magnitude of association with triglycerides and show that these loci are also associated with CAD. Finally, in a model accounting for effects on LDL-C and/or high-density lipoprotein cholesterol, a polymorphism's strength of effect on triglycerides is correlated with the magnitude of its effect on CAD risk. These results suggest that triglyceride-rich lipoproteins causally influence risk for CAD.
Coronary artery disease (CAD) is one of the leading causes of death and infirmity worldwide1. Plasma lipids such as cholesterol and triglycerides are associated with risk for CAD. Cholesterol is mostly carried in either low-density lipoproteins (LDL) or high-density lipoproteins (HDL) whereas triglycerides are mostly transported in very low-density lipoproteins (VLDL), chylomicrons, and remnants of their metabolism.
In observational epidemiologic studies, plasma concentrations of increased triglycerides, increased LDL cholesterol (LDL-C), and decreased HDL cholesterol (HDL-C) are associated with increased risk for CAD2,3. However, it is difficult to establish causal inference from observational epidemiology4, especially given the correlations among triglycerides, LDL-C, and HDL-C3.
Single nucleotide polymorphisms (SNPs) can be used as instruments to test whether a biomarker causally relates to disease risk5,6. Because genotypes are randomly assigned at meiosis and fixed throughout lifetime, a genetic association may overcome some limitations of observational epidemiology such as confounding and reverse causation7,8. Using gene variants that exclusively affect a biomarker of interest (i.e., no pleiotropic effects on other factors), investigators have confirmed LDL-C as a causal risk factor for CAD9 and have cast doubt on whether HDL-C directly influences risk for CAD10-15.
However, to date, it has been challenging to utilize a similar approach to define if plasma triglycerides reflect processes causal for CAD. In contrast to LDL-C and HDL-C, nearly all SNPs identified to date for plasma triglycerides have additional effects on either plasma LDL-C or HDL-C16-18, violating the “no pleiotropy” assumption of instrumental variable analysis8,19.
Here, we utilize common variants and develop a statistical framework to dissect causal influences among a set of correlated biomarkers. As this approach requires a large set of SNPs where precise measurements of effect on triglycerides, LDL-C, HDL-C, and CAD risk are simultaneously available, we leveraged: 1) 185 common SNPs all representing independent loci that are associated with at least one lipid trait at genome-wide levels of significance; 2) estimates of effect of each SNP on plasma triglycerides, LDL-C, and HDL-C in a sample exceeding 180,000 individuals; and 3) estimates of effect of each SNP on CAD in a sample exceeding 86,000 individuals (22,233 cases and 64,762 controls).
We studied 185 SNPs at 157 one megabase pair intervals with association P<5×10⁻⁸ for triglycerides, LDL-C, or HDL-C in a meta-analysis involving 188,578 genotyped individuals (see companion manuscript20). For each SNP, we obtained effect estimates for triglycerides (βTRIGLYCERIDES), LDL-C (βLDL-C), and HDL-C (βHDL-C) (in standard deviation units and estimated using inverse normal transformed residuals of lipid levels after adjusting for covariates; see Supplementary Figure 1 for study design). We also estimated the effect of each SNP on CAD (βCAD) from a recently published genome-wide association study (GWAS) involving 86,995 individuals (the CARDIoGRAM study)21. For the 185 SNPs, effect sizes (β) and P-values for triglycerides, LDL-C, HDL-C, and CAD are shown in Supplementary Table 1.
We considered several analytic approaches to investigate whether plasma triglycerides reflect processes causal for CAD. First, we evaluated the direction and magnitude of βLDL-C and βTRIGLYCERIDES in combination, and then compared these to βCAD (Figure 1 and Supplementary Figure 2). Second, to isolate the effect of triglycerides, from the 185 SNPs, we restricted analysis to loci that have moderate to strong effect on triglycerides (large βTRIGLYCERIDES) but minimal effect on LDL-C (small βLDL-C). Finally, across the 185 SNPs, we formally developed and applied a statistical framework to test if the effect size of a SNP on triglycerides is linearly related to its effect size on CAD, before and after accounting for the same SNP's potential effect on plasma LDL-C and/or HDL-C.
Figure 1. Effect of a single nucleotide polymorphism on triglycerides, low-density lipoprotein cholesterol, and risk for coronary artery disease.
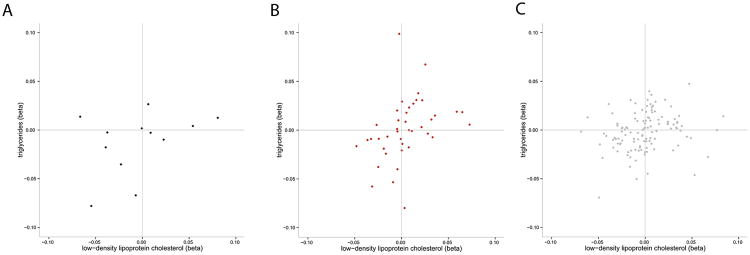
Black dots represent SNPs with CAD P<0.001; B. Red dots represent SNPs with 0.01 < CAD P <0.001; C. Grey dots represent CAD P>0.10). Loci strongly associated with CAD tend to have consistent directions for both triglycerides and LDL-C (bottom left and top right quadrants). In contrast to the grey points, the black and red points are concentrated in the bottom left and top right quadrants. Betas are in standard deviation units. SNPs with −0.10<βLDL-C<0.10 and −0.10<βTRIGLYCERIDES<0.10 are shown.
For each of the 185 independent lipid SNPs, we evaluated joint patterns of associations for triglycerides and LDL-C by examining SNPs that have strong association to both triglycerides and LDL-C (P<5×10⁻⁸for each). Among these, we examined SNPs with the same direction and a similar magnitude of association for both lipid traits (within a factor of 5). We observed 11 loci with this pattern of association. Five loci confer risk for CAD (P<0.05) and ten of the eleven loci show a direction of effect consistent between the lipid traits and CAD (Table 1). For example, the A allele at rs2954022 in the TRIB1 gene was associated strongly with lower triglycerides (βTRIGLYCERIDES=−0.078, P=2×10−124) and lower LDL-C (βLDL-C=−0.055, P=4×10−51) and showed the expected association with lower CAD risk (βCAD=−0.056, P=6×10⁻⁵).
Table 1.
SNPs with consistent direction of genetic effects on LDL-C and triglycerides and their subsequent relationship to risk for CAD.
| LDL-C | TRIGLYCERIDES | CAD | ||||||
|---|---|---|---|---|---|---|---|---|
| Locus | rs ID | A1 | βLDL-C | P | βTRIGLYCERIDES | P | βCAD | P |
| ANGPTL3 | rs4587594 | A | −0.049 | 3×10−37 | −0.069 | 3×10−87 | 0.017 | 0.26 |
| APOB | rs1367117 | A | 0.12 | 2×10−196 | 0.025 | 3×10⁻¹² | 0.035 | 0.02 |
| GCKR | rs3817588 | T | 0.026 | 3×10⁻⁸ | 0.067 | 7×10−58 | 0.034 | 0.08 |
| TIMD4 | rs6882076 | T | −0.046 | 5×10⁻³³ | −0.029 | 1×10⁻¹⁶ | −0.021 | 0.15 |
| HLA-B | rs2247056 | T | −0.025 | 6×10⁻⁹ | −0.038 | 2×10⁻²² | −0.030 | 0.06 |
| TRIB1 | rs2980885 | A | −0.031 | 4×10⁻¹² | −0.058 | 5×10−45 | −0.041 | 0.02 |
| TRIB1 | rs2954022 | A | −0.055 | 4×10−51 | −0.078 | 2×10−124 | −0.056 | 6×10⁻⁵ |
| ABCA1 | rs1883025 | T | −0.030 | 1×10⁻¹¹ | −0.022 | 3×10⁻⁸ | −0.014 | 0.41 |
| APOA1 | rs10790162 | A | 0.076 | 3×10⁻²⁶ | 0.23 | 1×10−276 | 0.13 | 2×10⁻⁶ |
| CETP | rs9989419 | A | 0.028 | 8×10⁻¹³ | 0.024 | 3×10⁻¹² | 0.010 | 0.61 |
| CILP2 | rs10401969 | T | 0.12 | 2×10−60 | 0.12 | 3×10−76 | 0.11 | 2×10⁻⁴ |
Shown are SNPs that have strong association with both LDL-C and triglycerides (P<5×10⁻⁸ for each), have consistent direction of effect size for LDL-C and triglycerides, and have a ratio of magnitude of effect size of LDL-C to triglycerides within a factor of 5.Five loci confer risk for CAD (P<0.05) and ten of the eleven loci show consistent direction of effect size for both lipid traits with the effect size of CAD.
A1: All beta estimates were calculated with respect to this allele.
Next, we identified SNPs that had strong association with both triglycerides and LDL-C (P<5×10⁻⁸ for each) but had opposite directions for βTRIGLYCERIDES and βLDL-C (within a factor of 5, Table 2). Four SNPs displayed this pattern and none showed significant association with CAD (all P>0.05). For example, the A allele at rs2255141 in the GPAM gene was associated with lower triglycerides (βTRIGLYCERIDES=−0.021, P=1×10⁻⁸) and higher LDL-C (βLDL-C=0.030, P=7×10⁻¹⁴) but had no discernible effect on CAD risk (βCAD =−0.0076, P=0.63).
Table 2.
SNPs with opposite direction of genetic effects on LDL-C and triglycerides and their subsequent relationship to risk for CAD.
| LDL-C | TRIGLYCERIDES | CAD | ||||||
|---|---|---|---|---|---|---|---|---|
| Locus | rs ID | A1 | βLDL-C | P | βTRIGLYCERIDES | P | βCAD | P |
| MIR148A | rs4722551 | T | −0.039 | 7×10⁻¹⁶ | 0.027 | 2×10⁻⁹ | −0.033 | 0.23 |
| GPAM | rs2255141 | A | 0.030 | 7×10⁻¹⁴ | −0.021 | 1×10⁻⁸ | −0.0076 | 0.63 |
| FADS1-2-3 | rs1535 | A | 0.053 | 3×10−43 | −0.046 | 1×10−40 | 0.0019 | 0.90 |
| APOE | rs7254892 | A | −0.49 | 8×10−365 | 0.12 | 4×10⁻³¹ | −0.14 | 0.09 |
Shown are SNPs that have strong association with both LDL-C and triglycerides (P<5×10⁻⁸ for each), but have opposite direction of effect size for LDL-C and triglycerides, and have a ratio of magnitude of effect size of LDL-C to triglycerides within a factor of 5. Four SNPs displayed this pattern and none showed significant association with CAD (all P>0.05).
A1: All beta estimates were calculated with respect to this allele.
Secondly, we considered a subset of the 185 SNPs that have moderate to strong effects on triglycerides but minimal effect on LDL-C [n=44 SNPs, all SNPs have large βTRIGLYCERIDES (>0.01 or <−0.01) but small βLDL-C (between −0.01 and 0.01)]. In regression analysis, we confirmed that βLDL-C was not associated with βCAD for this set of SNPs (P=0.68; see Supplementary Table 2). However, we observed a significant association of βTRIGLYCERIDES and βCAD (P=3×10⁻⁵; see Supplementary Table 3). These observations suggest that the direction and magnitude of effect of a SNP on both triglycerides and LDL-C impact risk for CAD.
To formally investigate whether the strength of a SNP's association with triglycerides predicts CAD risk, we devised a statistical framework that controls for pleiotropic effects on secondary lipid traits. This approach is particularly important because SNP association signals with triglycerides, LDL-C, and/or HDL-C (βTRIGLYCERIDES, βLDL-C, and βHDL-C) are correlated (Supplementary Figure 3 and Supplementary Table 4).
We tested the role of triglycerides on CAD by first calculating residuals of βCAD after including as covariates βLDL-C and βHDL-C in our regression model (Supplementary Figure 1). We then tested the association of βTRIGLYCERIDES with βCAD residuals. Similar models were created to assess the independent roles of LDL-C and HDL-C.
We observed that across the 185 SNPs, βLDL-C was strongly associated with βCAD, after adjusting for either βTRIGLYCERIDES individually, βHDL-C individually, or both βTRIGLYCERIDES and βHDL-C (all P < 1×10⁻¹⁸, Table 3). The pattern for βHDL-C was different. Across the 185 SNPs, βHDL-C was associated with βCAD, after adjusting for βLDL-C (P=0.005); however, this association was greatly attenuated after adjusting for βTRIGLYCERIDES individually (P=0.057) and rendered non-significant after accounting for both βTRIGLYCERIDES and βLDL-C (P=0.35, Table 3).
Table 3.
Association of the strength of a SNP's effect on plasma lipids with its strength of effect on CAD risk.
| Outcome | Predictor | Covariate | Beta | SE | P |
|---|---|---|---|---|---|
| βCAD | βLDL-C | - | 0.41 | 0.039 | 4×10⁻²⁰ |
| βCAD | βLDL-C | βHDL-C | 0.38 | 0.039 | 9×10⁻¹⁹ |
| βCAD | βLDL-C | βTRIGLYCERIDES | 0.40 | 0.034 | 1×10⁻²³ |
| βCAD | βLDL-C | βHDL-C, βTRIGLYCERIDES | 0.38 | 0.034 | 2×10⁻²² |
| βCAD | βHDL-C | - | −0.18 | 0.052 | 0.0006 |
| βCAD | βHDL-C | βLDL-C | −0.12 | 0.041 | 0.005 |
| βCAD | βHDL-C | βTRIGLYCERIDES | −0.09 | 0.048 | 0.057 |
| βCAD | βHDL-C | βLDL-C, βTRIGLYCERIDES | −0.04 | 0.037 | 0.35 |
| βCAD | βTRIGLYCERIDES | - | 0.44 | 0.074 | 2×10⁻⁸ |
| βCAD | βTRIGLYCERIDES | βLDL-C | 0.42 | 0.057 | 5×10⁻¹² |
| βCAD | βTRIGLYCERIDES | βHDL-C | 0.36 | 0.074 | 3×10⁻⁶ |
| βCAD | βTRIGLYCERIDES | βLDL-C, βHDL-C | 0.36 | 0.057 | 1×10⁻⁹ |
Residuals for βCAD were calculated after adjustment of a SNP's effect on the denoted lipid trait. A total of 185 SNPs identified from GWAS for LDL-C, HDL-C and triglycerides were included in regression analysis. βLDL-C, βHDL-C, and βTRIGLYCERIDES represent the effect sizes for a SNP on LDL-C, HDL-C and triglycerides in the GWAS meta-analysis for lipids. Regression was performed with the predictor variable of the effect size on lipid traits (β from predictor column) and the outcome variable of residual CAD effect size after adjusting for covariates. SE: standard error.
The results for triglycerides were similar to those observed for LDL-C. Across the 185 SNPs, βTRIGLYCERIDES was strongly associated with βCAD, after adjusting for both βLDL-C and βHDL-C (P =1×10⁻⁹, Table 3).
As an alternative to this approach using residuals, we also tested a single model with the outcome variable of βCAD and predictor variables of βTRIGLYCERIDES, βLDL-C and βHDL-C considered jointly (Supplementary Table 5). Results were similar with βTRIGLYCERIDES and βLDL-C showing association with βCAD (P=2×10⁻¹⁰ and P=1×10⁻²², respectively) but βHDL-C failing to show association (P=0.32).
In summary, we have demonstrated that: 1) SNPs with the same direction and a similar magnitude of association for both triglycerides and LDL-C tend to associate with CAD risk; 2) loci that have an exclusive effect on triglycerides are also associated with CAD; and 3) the strength of a SNP's effect on triglycerides is correlated with the magnitude of its effect on CAD risk, even after accounting for the same SNP's effect on LDL-C and/or HDL-C.
Using an analytical approach that accounts for the potential pleiotropic effects of a SNP on triglycerides, LDL-C, and/or HDL-C, we provide evidence that plasma triglycerides likely reflects processes causal for CAD. This finding based on 185 common SNPs is in line with recent reports of specific genes predominantly related to triglycerides also affecting risk for CAD. A promoter SNP in the APOA5 gene22, a common SNP upstream of the TRIB1 gene23, and a nonsense polymorphism at the APOC3 gene24 all predominantly associate with plasma triglycerides and each SNP has been convincingly related to clinical CAD11,25 or subclinical atherosclerosis24.
Our results raise several questions. First, if plasma triglycerides reflect causal processes, what are the specific mechanistic direct links to atherosclerosis? Triglycerides are carried in plasma mostly in VLDL, chylomicrons and remnants of their metabolism and as such, triglycerides capture several physiologic processes that may promote atherosclerosis. One potential link is post-prandial cholesterol metabolism. Plasma triglycerides are highly correlated with the amount of cholesterol in remnant lipoproteins (i.e., VLDL and chylomicron particles after interaction with lipoprotein lipase) and a variety of evidence ranging from the human Mendelian disorder of Type III hyperlipoproteinemia to experimental evidence in cell culture and animal models suggests that cholesterol-rich remnant particles have pro-atherogenic properties similar to LDL (reviewed in 26). Another process reflected by plasma triglycerides is the activity of lipoprotein lipase, a key enzyme that hydrolyzes triglycerides within triglyceride-rich lipoproteins. Higher enzymatic activity of lipoprotein lipase in the circulation leads to lower plasma triglycerides; a gain-of-function nonsense polymorphism in the LPL gene has been shown to not only reduce plasma triglyceride levels but also lower risk for CAD27.
Second, why are plasma triglycerides not significantly associated with CAD in observational epidemiologic studies when multiple risk factors are considered jointly to predict risk for future CAD2? Multivariable models have known limitations for assessing the etiological relevance for a given exposure. For example, an exposure may be rendered non-significant after multivariable adjustment because of less precise measurement or greater biologic variability when compared with other factors. Plasma triglyceride measurements are more variable than other plasma lipids such as HDL-C26. Alternatively, downstream effects of an exposure may more completely capture the risk conferred. For example, body mass index does not predict CAD risk in the Framingham model after accounting for blood pressure and type 2 diabetes despite the accepted causal influence of weight on blood pressure and type 2 diabetes28. Our approach using SNPs as proxies overcomes these limitations of observational epidemiology.
Finally, what are the implications of these data for the development of drugs aimed at lowering plasma triglycerides with the hope of reducing CAD risk? Several recent randomized controlled trials have tested whether the lowering of plasma triglycerides with fish oils29 or with fibrates30-32 will decrease risk for CAD and in many cases, treatment did not reduce risk29,31,32. Possible explanations for failed trials are wrong study population, wrong mechanism of lowering triglycerides, insufficient degree of triglyceride-lowering, and limited statistical power.
Our study has several limitations. SNPs associated with triglycerides also relate to other lipid traits and thus, are not ideal instruments for Mendelian randomization analysis. Given that the plasma triglycerides measured in the blood is the end product of several metabolic processes, it is not surprising that triglyceride-related SNPs affect at least one other lipid trait. We have attempted to address this complexity through our statistical approach.
We are unable to distinguish if only specific mechanisms of altering triglycerides affect risk for CAD. Of note, there is strong evidence that at least three mechanisms that robustly influence triglycerides – loss of APOA5 function, loss of TRIB1 function, and gain of APOC3 function –increase risk for CAD.
In summary, we utilize common polymorphisms and employ a statistical framework to dissect causal influences among a set of correlated biomarkers. By applying this framework to a correlated set of plasma lipid measures and CAD risk, we suggest a causal role of triglyceride-rich lipoproteins in the development of CAD.
Online Methods
For the association of a given SNP with a plasma lipid trait, we obtained estimates of the effect size (βTRIGLYCERIDES, βLDL-C and βHDL-C) and strength of association (P-value) from a meta-analysis of association results from genome-wide and custom-array genotyping – the Global Lipids Genetics Consortium (GLGC) Metabochip study (described in companion manuscript, Willer et al.20). All effect sizes are in standard deviation units from inverse normal transformed residuals of lipids after adjusting for covariates. This analysis included up to 188,578 individuals from 60 studies. For the association of a given SNP with coronary artery disease (CAD), we obtained estimates of the effect size (βCAD) and strength of association (P-value) from a published GWAS study for CAD, the CARDIoGRAM study21. This study included 22,233 cases and 63,762 controls.
We selected independent SNPs associated with plasma lipids using the following criteria. First, we restricted to SNPs with association with at least one of the three lipid traits (triglycerides, LDL-C or HDL-C) at a genome-wide significance level of P<5×10⁻⁸. For each lipid locus – defined as a region of the genome that has a cluster of associated SNPs within one megabase from each other – we selected the strongest associated SNP (‘lead’ SNP). For loci with multiple associated SNPs, we calculated pairwise linkage disequilibrium (LD) estimates (r2) of these SNPs using whole genome sequencing data from 85 Utah residents with ancestryfrom northern and western Europe (CEU) samples from the 1000 Genomes project33, and selected a second SNP if there was very low LD (r2<0.05) with the lead SNP. In total, we selected 185 SNPs that met these criteria. These criteria yield a conservative estimate of the number of independent lipid SNPs. A list of effect sizes and P-values for triglycerides, LDL-C, HDL-C and CAD for the 185 selected SNPs is shown in Supplementary Table 1.
To formally investigate whether the strength of a SNP's association with triglycerides predicts CAD risk, we performed linear regression on the effect sizes of each SNP for triglycerides (βTRIGLYCERIDES), LDL-C (βLDL-C), HDL-C (βHDL-C) as predictor variables, and the effect sizes of CAD (βCAD) as the outcome variable. To control for pleiotropic effects, we first calculated the residuals of βCAD after adjusting for covariates of βTRIGLYCERIDES, βLDL-C and/or βHDL-C. We then performed linear regression analysis in a second model on the effect size of the primary lipid trait (βTRIGLYCERIDES, βLDL-C or βHDL-C) with the residuals of βCAD. For example, to test for the role of LDL-C on CAD, we first calculated residuals of βCAD after including as covariates βTRIGLYCERIDES and βHDL-C in our regression model. In a second regression model, we then performed association of residual βCAD with βLDL-C. All possible combinations of linear regression analysis was performed between βTRIGLYCERIDES, βLDL-C or βHDL-C on βCAD (see Table 3).
As an alternative to this residuals approach, we also tested a single model where the outcome variable of βCAD was tested with the predictor variables of βTRIGLYCERIDES, βLDL-C and βHDL-C jointly considered (Supplementary Table 5). We also performed several sensitivity analyses to test for the effect of using different thresholds on βTRIGLYCERIDES and βLDL-C when highlighting loci with associations for both triglycerides and LDL-C (Supplementary Table 6, 7 and 8). We used thresholds that yielded the highest number of SNPs for each statistical analysis (factor threshold of 5 in Table 1 and Table 2, and β cutoff value of 0.01 in Supplementary Table 2 and 3). Furthermore, we assessed the effect of extreme influential outliers using Cook's D statistic34 (Supplementary Figure 4 and Supplementary Table 9) on our conditional regression models (Table 3). A list of the number of SNPs included in each of the different analyses are shown in Supplementary Table 10.
Supplementary Material
Acknowledgments
We thank the Global Lipids Genetics Consortium for early access to the association results of the Metabochip study. S.Kathiresan is supported by a Research Scholar award from the Massachusetts General Hospital (MGH), the Howard Goodman Fellowship from MGH, the Donovan Family Foundation, R01HL107816, and a grant from Fondation Leducq. R.D. is supported by a Banting Fellowship from the Canadian Institutes of Health Research. G.P. is supported by Award Number T32HL007208 from the National Heart, Lung, and Blood Institute. The content is solely the responsibility of the authors and does not necessarily represent the official views of the National Heart, Lung, And Blood Institute or the National Institutes of Health.
Sequence accession numbers
ANGPTL3 (NM_014495), APOB (NM_000384), GCKR (NM_001486), TIMD4 (NM_138379), HLA-B (NM_005514), TRIB1 (NM_025195), ABCA1 (NM_005502), APOA1 (NM_000039), CETP (NM_000078), CILP2 (NM_153221), MIR148A (NR_029597), GPAM (NM_020918), FADS1-2-3 (NM_013402-NM_004265-NM_021727), APOE (NM_000041), APOA5 (NM_052968), APOC3 (NM_000040)
Disclosures
CHS
Bruce Psaty serves on the DSBM of a clinical trial funded by the manufacturer (Zoll), and he serves on the Steering Committee of the Yale Open-Data Project funded by the Medtronic.
CoLaus
Peter Vollenweider received an unrestricted grant from GSK to build the CoLaus study
deCODE
Authors affiliated with deCODE Genetics/Amgen, a biotechnology company, are employees of deCODE Genetics/Amgen
GLACIER
Inês Barroso and spouse own stock in GlaxoSmithKline and Incyte Ltd.
S. Kathiresan serves on scientific advisory boards for Merck, Celera, American Genomics and Catabasis. He has received unrestricted research grants from Merck and Pfizer.
Author Contributions
R.D. carried out primary data analyses and prepared the supplementary information. R.D. and C.G. prepared figures and tables. C.W., E.M.S., S.Sebanti, G.R.A. contributed meta-analysis results. R.D., M.J.D, B.M.N., S.Kathiresan contributed to the design and conduct of the study. R.D., M.J.D, B.M.N., S.Kathiresan wrote the manuscript.
All authors contributed to the research and reviewed the manuscript.
Design, management and coordination of contributing cohorts
(ADVANCE) T.L.A.; (AGES Reykjavik study) T.B.H., V.G.; (AIDHS/SDS) D.K.S.; (AMC-PAS) P.D., G.K.H.; (Amish GLGC) A.R.S.; (ARIC) E.B.; (B58C-WTCCC & B58C-T1DGC) D.P.S.; (B58C-Metabochip) C.M.L., C.Power, M.I.M.; (BLSA) L.F.; (BRIGHT) P.B.M.; (CHS) B.M.P., J.I.R.; (CLHNS) A.B.F., K.L.M., L.S.A.; (CoLaus) P.V.; (deCODE) K.Stefansson, U.T.; (DIAGEN) P.E.S., S.R.B.; (DILGOM) S.R.; (DPS) M.U.; (DR's EXTRA) R.R.; (EAS) J.F.P.; (EGCUT (Estonian Genome Center of University of Tartu)) A.M.; (ELY) N.W.; (EPIC) N.W., K.K.; (EPIC_N_OBSET GWAS) E.H.Young; (ERF) C.M.V.; (ESS (Erasmus Stroke Study)) P.J.K.; (Family Heart Study FHS) I.B.B.; (FBPP) A.C., R.S.C., S.C.H.; (FENLAND) R.L., N.W.; (FIN-D2D 2007) A.K., L.M.; (FINCAVAS) M.Kähönen; (Framingham) L.A.C., S.Kathiresan, J.M.O.; (FRISCII) A.Siegbahn, L.W.; (FUSION GWAS) K.L.M., M.Boehnke; (FUSION stage 2) F.S.C., J.T., J.Saramies; (GenomEUTwin) J.B.W., N.G.M., K.O.K., V.S., J.Kaprio, A.Jula, D.I.B., N.P., T.D.S.; (GLACIER) P.W.F.; (Go-DARTS) A.D.M., C.N.P.; (GxE/Spanish Town) B.O.T., C.A.M., F.B., J.N.H., R.S.C.; (HUNT2) K.Hveem; (IMPROVE) U.D., A.Hamsten, E.T., S.E.H.; (InCHIANTI) S.B.; (KORAF4) C.Gieger;(LifeLines) B.H.W.; (LOLIPOP) J.S.K., J.C.C.; (LURIC) B.O.B.; W.M.; (MDC) L.C.G., D. Altshuler, S.Kathiresan; (METSIM) J.Kuusisto, M.L.; (MICROS) P.P.P.; (MORGAM) D.Arveiler, J.F.; (MRC/UVRI GPC GWAS) P.Kaleebu, G.A., J.Seeley, E.H.Y.; (MRC National Survey of Health & Development) D.K.; (NFBC1986) M-R.J.; (NSPHS) U.G.; (ORCADES) H.Campbell; (PARC) Y.I.C., R.M.K., J.I.R.; (PIVUS) E.I., L.Lind; (PROMIS) J.D., P.D., D.Saleheen; (Rotterdam Study) A.Hofman, A.G.U.; (SardiNIA) G.R.A.; (SCARFSHEEP) A.Hamsten, U.D.; (SEYCHELLES) M.Burnier, M.Bochud; P.Bovet; (SUVIMAX) P.M.; (Swedish Twin Reg.) E.I., N.L.P.; (TAICHI) T.L.A., Y.I.C., C.A.H., T.Q., J.I.R., W.H.S.; (THISEAS) G.D., P.D.; (Tromsø) I.N.; (TWINGENE) U.D., E.I.; (ULSAM) E.I.; (Whitehall II) A.Hingorani, M.Kivimaki
Genotyping of contributing cohorts
(ADVANCE) D.Absher; (AIDHS/SDS) L.F.B., M.L.G.; (AMC-PAS) P.D., G.K.H.; (B58C-WTCCC & B58C-T1DGC) W.L.M.; (B58C-Metabochip) M.I.M.; (BLSA) D.H.; (BRIGHT) P.B.M.; (CHS) J.I.R.; (DIAGEN) N.N., G.M.; (DILGOM) A. Palotie; (DR's EXTRA) T.A.L.; (EAS) J.F.W.; (EGCUT (Estonian Genome Center of University of Tartu)) T.E.; (EPIC) P.D.; (EPIC_N_SUBCOH GWAS) I.B.; (ERF) C.M.V.; (ESS (Erasmus Stroke Study)) C.M.V.; (FBPP) A.C., G.B.E.; (FENLAND) M.S.S.; (FIN-D2D 2007) A.J.S.; (FINCAVAS) T.L.; (Framingham) J.M.O.; (FUSION stage 2) L.L.B.; (GLACIER) I.B.; (Go-DARTS) C.Groves, C.N.P., M.I.M.; (IMPROVE) A.Hamsten; (KORAF3) H.G., T.I.; (KORAF4) N.K.; (LifeLines) C.W.; (LOLIPOP) J.S.K., J.C.C.; (LURIC) M.E.K.; (MDC) B.F.V., R.D.; (MICROS) A.A.H.; (MORGAM) L.T., P.Brambilla; (MRC/UVRI GPC GWAS) M.S.S.; (MRC National Survey of Health & Development) A.W., D.K., K.K.O.; (NFBC1986) A-L.H., M.J, M.McCarthy, P.E., S.V.; (NSPHS and FRISCII) Å.J.; (ORCADES) H.Campbell; (PARC) M.O.G., M.R.J., J.I.R.; (PIVUS) E.I., L.Lind; (PROMIS) P.D., K.Stirrups; (Rotterdam Study) A.G.U., F.R.; (SardiNIA) R.N.; (SCARFSHEEP) B.G., R.J.S.; (SEYCHELLES) F.M., G.B.E.; (Swedish Twin Reg.) E.I., N.L.P.; (TAICHI) D.Absher, T.L.A., E.K., T.Q., L.L.W.; (THISEAS) P.D.; (TWINGENE) A.Hamsten, E.I.; (ULSAM) E.I.; (WGHS) D.I.C., P.M.R.; (Whitehall II) A.Hingorani, C.L., M.Kumari, M.Kivimaki
Phenotype definition of contributing cohorts
(ADVANCE) C.I.; (AGES Reykjavik study) T.B.H., V.G.; (AIDHS/SDS) L.F.B.; (AMC-PAS) J.J.K.; (Amish GLGC) A.R.S., B.D.M.; (B58C-WTCCC & B58C-T1DGC) D.P.S.; (B58C-Metabochip) C.Power; E.H.; (BRIGHT) P.B.M.; (CHS) B.M.P.; (CoLaus) P.V.; (deCODE) G.I.E., H.H., I.O.; (DIAGEN) G.M.; (DILGOM) K.Silander; (DPS) J.Lindström; (DR's EXTRA) P.Komulainen; (EAS) J.L.Bolton; (EGCUT (Estonian Genome Center of University of Tartu)) A.M.; (EGCUT (Estonian Genome Center of University of Tartu)) K.F.; (ERF and Rotterdam Study) A.Hofman; (ERF) C.M.V; (ESS (Erasmus Stroke Study)) E.G.V., H.M.D., P.J.K.; (FBPP) A.C., R.S.C., S.C.H.; (FINCAVAS) T.V.N.; (Framingham) S.Kathiresan, J.M.O.; (GenomEUTwin: MZGWA) J.B.W.; (GenomEUTwin-FINRISK) V.S.; (GenomEUTwin-FINTWIN) J.Kaprio, K.Heikkilä; (GenomEUTwin-GENMETS) A.Jula; (GenomEUTwin-NLDTWIN) G.W.; (Go-DARTS) A.S.D., A.D.M., C.N.P., L.A.D.; (GxE/Spanish Town) C.A.M., F.B.; (IMPROVE) U.D.; A.Hamsten, E.T.; (KORAF3) C.M.; (KORAF4) A.Döring; (LifeLines) L.J.; (LOLIPOP) J.S.K., J.C.C.; (LURIC) H.S.; (MDC) L.C.G.; (METSIM) A.Stančáková; (MORGAM) G.C.; (MRC/UVRI GPC GWAS) R.N.N.; (MRC National Survey of Health & Development) D.K.; (NFBC1986) A.R., A-L.H., A.Pouta, M-R.J.; (NSPHS and FRISCII) Å.J.; (NSPHS) U.G.; (ORCADES) S.H.W.; (PARC) Y.I.C., R.M.K.; (PIVUS) E.I., L.Lind; (PROMIS) D.F.F.; (Rotterdam Study) A.Hofman; (SCARFSHEEP) U.D., B.G.; (SEYCHELLES) M.Burnier, M.Bochud, P.Bovet; (Swedish Twin Reg.) E.I., N.L.P.; (TAICHI) H.Chang, C.A.H., Y.H., E.K., S.L., W.H.S.; (THISEAS) G.D., M.D.; (Tromsø) T.W.; (TWINGENE) U.D., E.I.; (ULSAM) E.I.; (WGHS) P.M.R.; (Whitehall II) M.Kumari
Primary analysis from contributing cohorts
(ADVANCE) L.L.W.; (AIDHS/SDS) R.S.; (AMC-PAS) S.Kanoni; (Amish GLGC) J.R.O., M.E.M.; (ARIC) K.A.V.; (B58C-Metabochip) C.M.L., E.H., T.F.; (B58C-WTCCC & B58C-T1DGC) D.P.S.; (BLSA) T.T.; (BRIGHT) T.J.; (CLHNS) Y.W.; (CoLaus) J.S.B.; (deCODE) G.T.; (DIAGEN) A.U.J.; (DILGOM) M.P.; (EAS) R.M.F.; (DPS) A.U.J.; (DR'S EXTRA) A.U.J.; (EGCUT (Estonian Genome Center of University of Tartu)) E.M., K.F., T.E.; (ELY) D.G.; (EPIC) K.Stirrups, D.G.; (EPIC_N_OBSET GWAS) E.Y., C.L.; (EPIC_N_SUBCOH GWAS) N.W.; (ERF) A.I.; (ESS (Erasmus Stroke Study)) C.M.V., E.G.V.; (EUROSPAN) A.Demirkan; (Family Heart Study FHS) I.B.B., M.F.F.; (FBPP) A.C., G.B.E.; (FENLAND) T.P., C.Pomilla; (FENLAND GWAS) J.H.Z., J.Luan; (FIN-D2D 2007) A.U.J.; (FINCAVAS) L.Lyytikäinen; (Framingham) L.A.C., G.M.P.; (FRISCII and NSPHS) Å.J.; (FUSION stage 2) T.M.T.; (GenomEUTwin-FINRISK) J.Kettunen; (GenomEUTwin-FINTWIN) K.Heikkilä; (GenomEUTwin-GENMETS) I.S.; (GenomEUTwin-SWETWIN) P.K.M.; (GenomEUTwin-UK-TWINS) M.Mangino; (GLACIER) D.Shungin; (GLACIER) P.W.F.; (Go-DARTS) C.N.P., L.A.D.; (GxE/Spanish Town) C.D.P.; (HUNT) A.U.J.; (IMPROVE) R.J.S.; (InCHIANTI) T.T.; (KORAF3) M.Müller-Nurasyid; (KORAF4) A.Petersen; (LifeLines) I.M.N.; (LOLIPOP) W.Z.; (LURIC) M.E.K.; (MDC) B.F.V.; (MDC) P.F., R.D.; (METSIM) A.U.J.; (MRC/UVRI GPC GWAS) R.N.N.; (MRC National Survey of Health & Development) A.W., J.Luan; (NFBC1986) M.Kaakinen, I.S., S.K.S.; (NSPHS and FRISCII) Å.J.; (PARC) X.L.; (PIVUS) C.Song, E.I.; (PROMIS) J.D., D.F.F., K.Stirrups; (Rotterdam Study) A.I.; (SardiNIA) C.Sidore, J.L.Bragg-Gresham, S.Sanna; (SCARFSHEEP) R.J.S.; (SEYCHELLES) G.B.E., M.Bochud; (SUVIMAX) T.J.; (Swedish Twin Reg.) C.Song, E.I.; (TAICHI) D.Absher, T.L.A., H.Chang, M.G., C.A.H., T.Q., L.L.W; (THISEAS) S.Kanoni; (Tromsø) A.U.J.; (TWINGENE) A.G., E.I.; (ULSAM) C.Song, E.I., S.G.; (WGHS) D.I.C.; (Whitehall II) S.Shah
References
- 1.Murray CJ, Lopez AD. Global mortality, disability, and the contribution of risk factors: Global Burden of Disease Study. Lancet. 1997;349:1436–42. doi: 10.1016/S0140-6736(96)07495-8. [DOI] [PubMed] [Google Scholar]
- 2.Di Angelantonio E, et al. Major lipids, apolipoproteins, and risk of vascular disease. JAMA. 2009;302:1993–2000. doi: 10.1001/jama.2009.1619. [DOI] [PMC free article] [PubMed] [Google Scholar]
- 3.Sarwar N, et al. Triglycerides and the risk of coronary heart disease: 10,158 incident cases among 262,525 participants in 29 Western prospective studies. Circulation. 2007;115:450–8. doi: 10.1161/CIRCULATIONAHA.106.637793. [DOI] [PubMed] [Google Scholar]
- 4.Sheehan NA, Didelez V, Burton PR, Tobin MD. Mendelian randomisation and causal inference in observational epidemiology. PLoS Med. 2008;5:e177. doi: 10.1371/journal.pmed.0050177. [DOI] [PMC free article] [PubMed] [Google Scholar]
- 5.Davey Smith G, Ebrahim S. ‘Mendelian randomization’: can genetic epidemiology contribute to understanding environmental determinants of disease? Int J Epidemiol. 2003;32:1–22. doi: 10.1093/ije/dyg070. [DOI] [PubMed] [Google Scholar]
- 6.Ebrahim S, Davey Smith G. Mendelian randomization: can genetic epidemiology help redress the failures of observational epidemiology? Hum Genet. 2008;123:15–33. doi: 10.1007/s00439-007-0448-6. [DOI] [PubMed] [Google Scholar]
- 7.Smith GD, et al. Clustered environments and randomized genes: a fundamental distinction between conventional and genetic epidemiology. PLoS Med. 2007;4:e352. doi: 10.1371/journal.pmed.0040352. [DOI] [PMC free article] [PubMed] [Google Scholar]
- 8.Smith GD, Ebrahim S. Mendelian randomization: prospects, potentials, and limitations. Int J Epidemiol. 2004;33:30–42. doi: 10.1093/ije/dyh132. [DOI] [PubMed] [Google Scholar]
- 9.Cohen JC, Boerwinkle E, Mosley TH, Jr, Hobbs HH. Sequence variations in PCSK9, low LDL, and protection against coronary heart disease. N Engl J Med. 2006;354:1264–72. doi: 10.1056/NEJMoa054013. [DOI] [PubMed] [Google Scholar]
- 10.Willer CJ, et al. Newly identified loci that influence lipid concentrations and risk of coronary artery disease. Nat Genet. 2008;40:161–9. doi: 10.1038/ng.76. [DOI] [PMC free article] [PubMed] [Google Scholar]
- 11.Voight BF, et al. Plasma HDL cholesterol and risk of myocardial infarction: a mendelian randomisation study. Lancet. 2012 doi: 10.1016/S0140-6736(12)60312-2. [DOI] [PMC free article] [PubMed] [Google Scholar]
- 12.Haase CL, et al. LCAT, HDL cholesterol and ischemic cardiovascular disease: a Mendelian randomization study of HDL cholesterol in 54,500 individuals. J Clin Endocrinol Metab. 2012;97:E248–56. doi: 10.1210/jc.2011-1846. [DOI] [PubMed] [Google Scholar]
- 13.Haase CL, Tybjaerg-Hansen A, Grande P, Frikke-Schmidt R. Genetically elevated apolipoprotein A-I, high-density lipoprotein cholesterol levels, and risk of ischemic heart disease. J Clin Endocrinol Metab. 2010;95:E500–10. doi: 10.1210/jc.2010-0450. [DOI] [PubMed] [Google Scholar]
- 14.Frikke-Schmidt R, et al. Association of loss-of-function mutations in the ABCA1 gene with high-density lipoprotein cholesterol levels and risk of ischemic heart disease. JAMA. 2008;299:2524–32. doi: 10.1001/jama.299.21.2524. [DOI] [PubMed] [Google Scholar]
- 15.Johannsen TH, et al. Hepatic lipase, genetically elevated high-density lipoprotein, and risk of ischemic cardiovascular disease. J Clin Endocrinol Metab. 2009;94:1264–73. doi: 10.1210/jc.2008-1342. [DOI] [PubMed] [Google Scholar]
- 16.Kathiresan S, et al. Common variants at 30 loci contribute to polygenic dyslipidemia. Nat Genet. 2009;41:56–65. doi: 10.1038/ng.291. [DOI] [PMC free article] [PubMed] [Google Scholar]
- 17.Teslovich TM, et al. Biological, clinical and population relevance of 95 loci for blood lipids. Nature. 2010;466:707–13. doi: 10.1038/nature09270. [DOI] [PMC free article] [PubMed] [Google Scholar]
- 18.Sarwar N, et al. Triglyceride-mediated pathways and coronary disease: collaborative analysis of 101 studies. Lancet. 2010;375:1634–9. doi: 10.1016/S0140-6736(10)60545-4. [DOI] [PMC free article] [PubMed] [Google Scholar]
- 19.Lewis SJ. Mendelian randomization as applied to coronary heart disease, including recent advances incorporating new technology. Circ Cardiovasc Genet. 2010;3:109–17. doi: 10.1161/CIRCGENETICS.109.880955. [DOI] [PubMed] [Google Scholar]
- 20.The Global Lipids Genetics Consortium. Discovery and Refinement of Loci Associated with Lipid Levels. Nature Genetics. doi: 10.1038/ng.2797. In press. [DOI] [PMC free article] [PubMed] [Google Scholar]
- 21.Schunkert H, et al. Large-scale association analysis identifies 13 new susceptibility loci for coronary artery disease. Nat Genet. 2011;43:333–8. doi: 10.1038/ng.784. [DOI] [PMC free article] [PubMed] [Google Scholar]
- 22.Pennacchio LA, et al. An apolipoprotein influencing triglycerides in humans and mice revealed by comparative sequencing. Science. 2001;294:169–73. doi: 10.1126/science.1064852. [DOI] [PubMed] [Google Scholar]
- 23.Kathiresan S, et al. Six new loci associated with blood low-density lipoprotein cholesterol, high-density lipoprotein cholesterol or triglycerides in humans. Nat Genet. 2008;40:189–97. doi: 10.1038/ng.75. [DOI] [PMC free article] [PubMed] [Google Scholar]
- 24.Pollin TI, et al. A null mutation in human APOC3 confers a favorable plasma lipid profile and apparent cardioprotection. Science. 2008;322:1702–5. doi: 10.1126/science.1161524. [DOI] [PMC free article] [PubMed] [Google Scholar]
- 25.Deloukas P, et al. Large-scale association analysis identifies new risk loci for coronary artery disease. Nat Genet. 2013;45:25–33. doi: 10.1038/ng.2480. [DOI] [PMC free article] [PubMed] [Google Scholar]
- 26.Miller M, et al. Triglycerides and cardiovascular disease: a scientific statement from the American Heart Association. Circulation. 2011;123:2292–333. doi: 10.1161/CIR.0b013e3182160726. [DOI] [PubMed] [Google Scholar]
- 27.Varbo A, et al. Remnant cholesterol as a causal risk factor for ischemic heart disease. J Am Coll Cardiol. 2013;61:427–36. doi: 10.1016/j.jacc.2012.08.1026. [DOI] [PubMed] [Google Scholar]
- 28.Wilson PW, et al. Prediction of coronary heart disease using risk factor categories. Circulation. 1998;97:1837–47. doi: 10.1161/01.cir.97.18.1837. [DOI] [PubMed] [Google Scholar]
- 29.Bosch J, et al. n-3 fatty acids and cardiovascular outcomes in patients with dysglycemia. N Engl J Med. 2012;367:309–18. doi: 10.1056/NEJMoa1203859. [DOI] [PubMed] [Google Scholar]
- 30.Rubins HB, et al. Gemfibrozil for the secondary prevention of coronary heart disease in men with low levels of high-density lipoprotein cholesterol. Veterans Affairs High-Density Lipoprotein Cholesterol Intervention Trial Study Group. N Engl J Med. 1999;341:410–8. doi: 10.1056/NEJM199908053410604. [DOI] [PubMed] [Google Scholar]
- 31.Keech A, et al. Effects of long-term fenofibrate therapy on cardiovascular events in 9795 people with type 2 diabetes mellitus (the FIELD study): randomised controlled trial. Lancet. 2005;366:1849–61. doi: 10.1016/S0140-6736(05)67667-2. [DOI] [PubMed] [Google Scholar]
- 32.Ginsberg HN, et al. Effects of combination lipid therapy in type 2 diabetes mellitus. N Engl J Med. 2010;362:1563–74. doi: 10.1056/NEJMoa1001282. [DOI] [PMC free article] [PubMed] [Google Scholar]
- 33.1000 Genomes Project Consortium. A map of human genome variation from population-scale sequencing. Nature. 2010;467:1061–73. doi: 10.1038/nature09534. [DOI] [PMC free article] [PubMed] [Google Scholar]
- 34.Cook RD. Detection of Influential Observations in Linear Regression. Technometrics. 1977;19:15–18. [Google Scholar]
Associated Data
This section collects any data citations, data availability statements, or supplementary materials included in this article.