Abstract
While most somatic cells undergoing induced pluripotent stem (iPS) cell reprogramming with Yamanaka factors accumulate at stable partially reprogrammed stages, the molecular mechanisms required to achieve full reprogramming are unknown. MicroRNAs (miRNAs) fine-tune mRNA translation and are implicated in reprogramming, but miRNA functional targets critical for complete iPS cell reprogramming remain elusive. We identified methyl-DNA binding domain protein 2 (MBD2) as an epigenetic suppressor, blocking full reprogramming of somatic to iPS cells through direct binding to NANOG promoter elements preventing transcriptional activation. When we overexpressed miR-302 cluster we observed a significant increase in conversion of partial to fully reprogrammed iPS cells by suppressing MBD2 expression, thereby increasing NANOG expression. Thus, expression of exogenous miR-302 cluster (without miR-367) is efficient in attaining a fully reprogrammed iPS state in partially reprogrammed cells by relieving MBD2-mediated inhibition of NANOG expression. Our studies provide a direct molecular mechanism involved in generating complete human iPS cell reprogramming to study disease pathogenesis, drug screening, and for potential cell-based therapies.
Keywords: Induced pluripotent stem cells, MicroRNA, Epigenetics, Reprogramming
Introduction
Somatic cells reprogram to an embryonic stem cell (ESC) comparable induced pluripotent stem (iPS) cell state upon forced expression of exogenously delivered transcription factors [1, 2]. Whether or not iPS cells will be used for clinical cell-based therapies remains to be determined [3], but one major obstacle to this is the low reprogramming efficiency of human iPS cell generation, especially in the context of lack of our understanding in deciphering factor and mechanism involved in achieving full reprogramming. Human umbilical cord blood (CB) has served as a clinical source of hematopoietic stem cells (HSCs) since the late 1980s [4, 5], and the banking of human leukocyte antigen (HLA)-defined CB supports the growing use of CB for HSC transplantation [6]. Having such banked HLA-defined CB could possibly serve in the future for iPS cell generation and subsequent differentiation to many different cell and tissue types [3]. Recently, CB-derived cells, which are more immature and cytokine responsive compared to adult hematopoietic cells [6], have been shown to be reprogrammed to iPS cells [7–10]. However, whether one chooses to use a starting cell source such as CB cells, which has a significant higher iPS cell induction efficiency compared to other human somatic cell populations, or uses small molecules or RNA inhibition of other selected factors known to increase the efficiency of somatic cell reprogramming to iPS cells [11–14], it is necessary to identify molecular factor(s) that not only enhance reprogramming efficiency but also ensure full reprogramming. Such latter factors have neither well identified nor their mechanisms of action defined. Since somatic cell reprogramming requires global epigenetic changes and shifts in expression of thousands of genes, little is known of the specific regulatory mechanisms involved in this process [15]. Indeed, in addition to rare fully reprogrammed cells, partially reprogrammed cells stably accumulate as a major population during the reprogramming process [16, 17]. Stability of partially reprogrammed cells entails incomplete repression of lineage-specifying transcription factors and DNA hypermethylation at known pluripotency-related loci that prevent transcriptional activation [16, 18]. Partially reprogrammed intermediate cells have been characterized [17], but our understanding of why so few cells become fully reprogrammed, how cells remain locked in a partially reprogrammed state, and discovery of reliable mechanisms needed to convert partially to fully reprogrammed iPS cells remains elusive.
Upregulation of endogenous NANOG expression is a key event for reprogramming of somatic cells to iPS cells [19]. While NANOG transcriptional activation has been shown to overcome the reprogramming barrier in mouse cells and is identified as an indispensible factor for reprogramming of bovine adult fibroblasts to iPS cells [20, 21], the importance of NANOG regulation in overcoming the reprogramming barrier in human cells is not known. The miR-302 cluster has been reported not only to promote somatic cell to iPS cell reprogramming in the presence of the Yamanaka factors [22], but may alone directly reprogram both primary human and mouse cells into iPS cells under certain conditions [23]. However, the primary molecular targets of the miR-302 cluster required for somatic cell reprogramming have remained poorly understood and whether or not the associated miR-367 is involved in transcription factor-induced full iPS cell reprogramming is not clear. Herein, we report the discovery of a molecular pathway that permits the miR-302 cluster to regulate endogenous pluripotent gene expression to unlock partially reprogrammed cells into a fully reprogrammed iPS state, and prove that this event is uniquely and essentially mediated by upregulation of NANOG expression via direct miR-302 cluster suppression of methyl-DNA binding domain protein 2 (MBD2) expression, without the need for miR-367. This new information may allow for more insight into the potential future use of fully reprogrammed iPS cells from HLA-defined cryopreserved CB cells, as well as other sources of somatic cells, for assessing disease pathogenesis, drug screening, and possible cell therapy.
Materials and Methods
iPS Cell Generation and MicroRNAs Infection
CD34+ CB cells frozen for more than 20 years were cultured in α-MEM media containing 10% fetal bovine serum (FBS) (Thermo-Fisher Scientific, Wltham, MA, www.Thermoscientific.com) and 100 ng/ml human stem cell factor, 100 ng/ml human Flt3-ligand, and 50 ng/ml human thrombopoietin for 3 days [10]. All cytokines were purchased from R&D Systems, Inc. (Minneapolis, MN, http://www.rndsystems.com). At day 4, 500,000 stimulated cells were spin-infected (at 2,200 rpm for 45 minutes) with concentrated lentiviral polycistronic particles containing SOX2-OCT4-enhanced green fluorescent protein (EGFP) and cMYC-KLF4-Cerulean in α-MEM (Gibco BRL, Carlsbad, CA, http://www.invitrogen.com) media containing 8 µg/ml polybrene (Sigma-Aldrich, St. Louis, MO, http://www.sigmaaldrich.com). Cells were cultured overnight with viral supernatants. Partially reprogrammed cells or MBD2-knockdown MRC5 (ATCC) were seeded on Matrigel-coated dishes (BD Bioscience, San Diego, CA, http://www.bdbiosciences.com) 1 day before transduction. Medium was replaced with virus-containing supernatant supplemented with 8 µg/ml polybrene and cells incubated for 24 hours.
Immunocytochemistry
Cells were fixed with 4% (wt/vol) paraformaldehyde for 30 minutes and permeabilized with 0.1% (vol/vol) Triton X-100 in phosphate buffered saline (PBS) for 5 minutes. After blocking with 10% (vol/vol) goat serum for 30 minutes, cells were incubated with primary following antibodies: mouse anti-Oct4, rabbit anti-MBD2, mouse anti-alpha Tuj1 (all from Santa Cruz Biotechnology Inc., Santa Cruz, CA, http://www.scbt.com), rabbit/mouse anti-NANOG (Cell Signaling Technology, Inc., Danvers, MA, http://www.cellsignal.com), mouse anti-SSEA-4, TRA-1-60, TRA-1-81 (Millipore Co., Billerica, MA, http://www.millipore.-com), mouse anti-α-SMA, and mouse anti-Pecam (Chemicon, Temecula, CA, http://www.chemicon.com) at 4°C overnight. Cells were washed with PBS, then incubated with secondary antibodies conjugated with FITC or rhodamine (Molecular Probe; Invitrogen, Corp., Carlsbad, CA, http://www.invitrogen.com), and visualized by confocal microscopy after counterstaining with 2 g/ml 4′,6-diamidino-2-phenylindole (DAPI) (Sigma-Aldrich). The confocal images were viewed with Olympus FV1000 mpE confocal microscope using as objective 2-photon and Olympus uplanSApo 60xW/1.2NA/eus. All the images were taken at room temperature.
Bisulfite Sequencing Analysis
To determine the DNA methylation status, genomic DNA was treated with sodium bisulfite to convert all unmethylated cytosine residues into uracil residues using EpiTect Bisulfite Kit (QIAGEN, Hilden, Germany, http://www1.qiagen.com), according to the manufacturer’s instructions. Briefly, PCR amplifications were performed in a total volume of 25 µl and consisted of a total of 40 cycles of denaturation at 94°C for 30 seconds, annealing at the appropriate temperature for each target region for 30 seconds, extension at 72°C for 30 seconds, with a first denaturation at 94°C for 5 minutes, and a final extension at 72°C for 10 minutes. Primer sequences and annealing temperatures used were as follows: endogenous OCT4 first sense: 5’-TTTGTTTTTTTATTTAT TTAGGGGG-3′, endogenous OCT4 first antisense: 5′-ATCCCCA ATACCTCTAAACCTAATC-3′ (299 bp, 45°C); endogenous OCT4 second sense: 5′-GGGTTAGAGGTTAAGGTTAGAGGG-3′, endogenous OCT4 second antisense: 5′-CCCCCACCTAATA AAAATAAAAAAA-3′ (161 bp, 55°C); NANOG first sense: 5′-TTTGTAGGTGGGATTAATTGTGAA-3′, NANOG first antisense: 5′-AAAAAATTTTAAACAACAACCAAAAA-3′ (312 bp, 45°C); NANOG second sense: 5′-TTTGTAGGTGGGATTAATT GTGAA-3′, and NANOG second antisense: 5′-AAAAAAACAAA ACACCAACCAAAT-3′ (188 bp, 55°C). All primers were purchased from Invitrogen, Corp. PCR products were subcloned with the PCR 2.1-TOPO vector (Invitrogen) and individual clones were sequenced. Clones with at least 90% cytosine conversion were accepted, and all possible clonalities were excluded based on criteria from the analyzer software (http://quma.cdb.riken.jp/top/index.html) [24].
3′UTR Luciferase Reporter Assays
miR-302 target, which contains seed matches, was selected by prediction programs (miRanda; http://cbio.mskcc.org/mirnaviewer/ and TargetScan; http://www.targetscan.org/). Wild-type and mutant UTR segments of miR-302 targets were cloned into psiCHECK2 vector containing renilla and firefly luciferase gene as a reporter (Promega, Madison, WI, http://www.promega.com). Human embryonic carcinoma cells (hECCs) were transfected with luciferase reporter plasmids (1 µg) at least three times on different days and luciferase activities from the cells were assayed. Each reporter assay was conducted in triplicate.
ChIP Assays
Human pluripotent stem cells (hPSCs) or somatic cells were cross-linked with 1% formaldehyde and soluble chromatin was extracted and sonicated following a protocol provided by Millipore EZ ChIP Chromatin Immunoprecipitation Kit (Millipore). Sonicated chromatin proteins were incubated with MBD2-antibodies or normal IgGs and immunoprecipitated with protein G agarose beads. Immunoprecipitated DNA was analyzed by realtime PCR with 5 µl of DNA. PCR conditions were 95°C for 3 minutes and 40 cycles of 95°C for 30 seconds, 60°C for 30 seconds, and 72°C for 30 seconds. Data are presented as fold enrichment of precipitated DNA, relative to a 1/100 dilution of input chromatin [25]. Experiments were performed three times in triplicates.
Statistical Analysis
All experiments were performed three times in triplicate and data are represented as mean value ± SD for statistical comparison. Significance of differences was assessed by an unpaired t test at p < .05.
Results
Partially Reprogrammed Cells Do Not Possess Molecular Markers and Functional Potential of Pluripotent Stem Cells
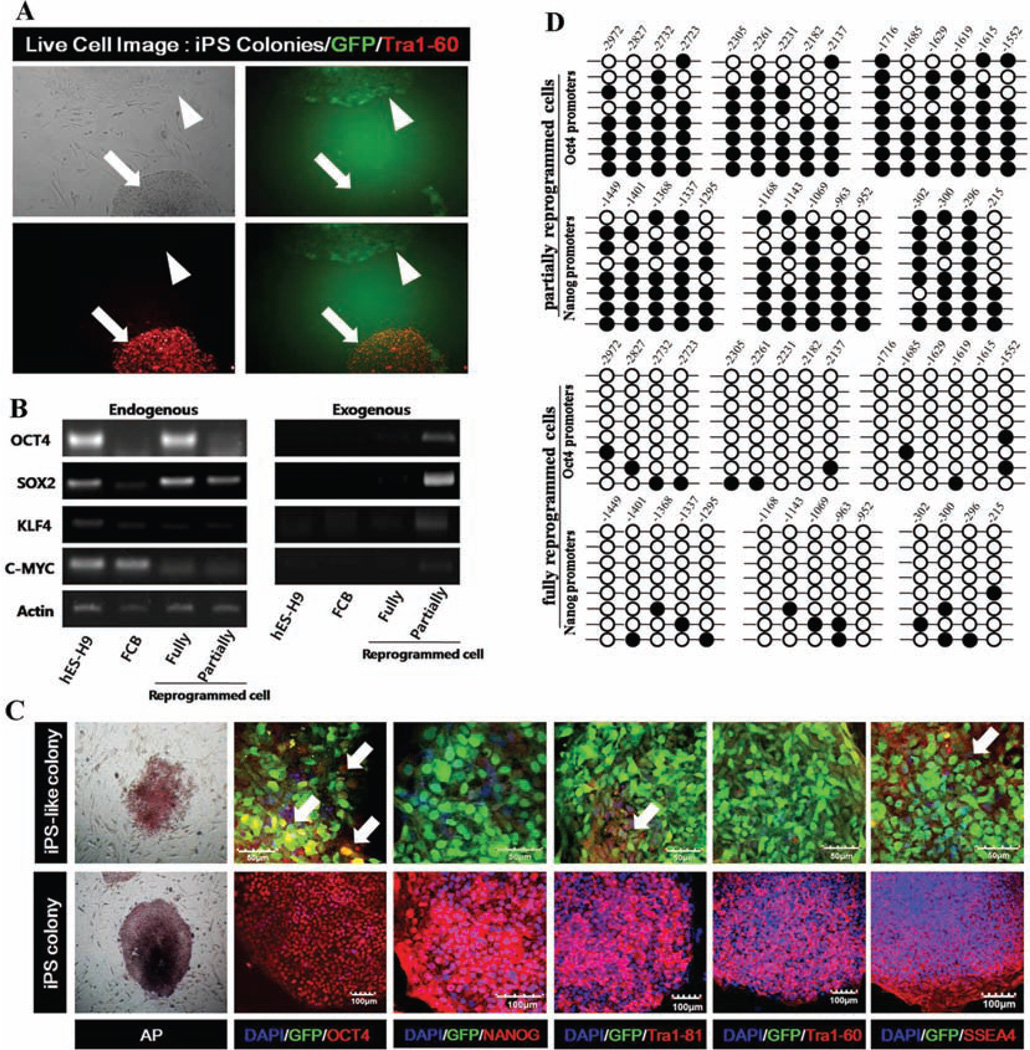
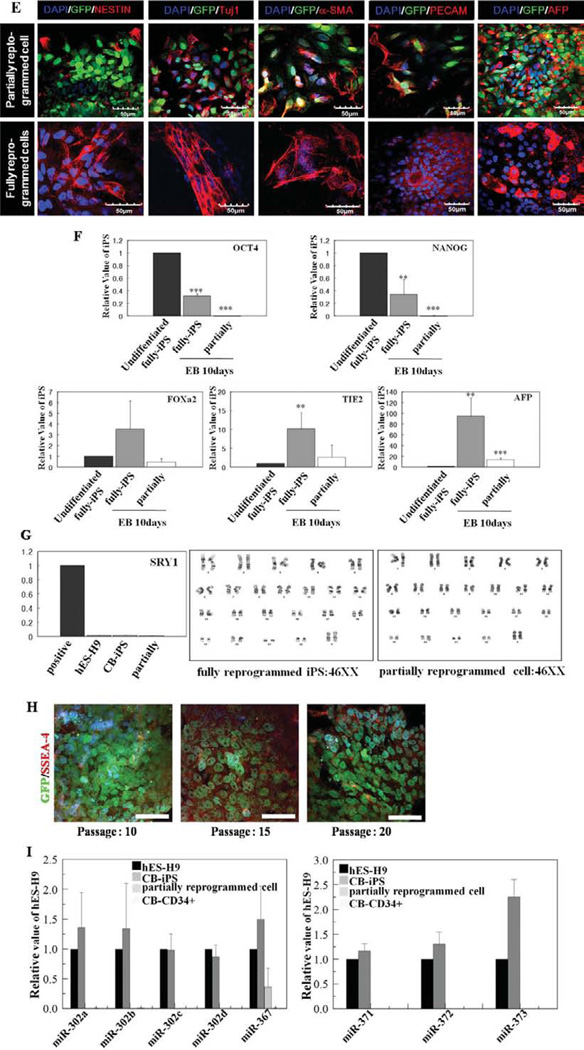
CD34+ cells isolated from thawed human CB cryopreserved for more than 20 years were successfully reprogrammed using lentiviruses expressing Yamanaka factors [10]; however, we also identified partially reprogrammed cells (Fig. 1A) by monitoring surface expression of a marker of fully reprogrammed cells, TRA-1-60, and by simultaneous persistent expression of the exogenous Yamanaka factors (Fig. 1B, 1C) [17]. Whereas approximately 5% of hES-like colonies expressed TRA-1-60 and silenced expression of exogenous Yamanaka factors consistent with achieving a fully reprogrammed state [17], we also detected TRA-1-60 negative colonies retaining exogenous Yamanaka factor expression as assessed by continued EGFP expression (Fig. 1A). Although similar to hES colonies in morphology, we suspected these colonies to be partially reprogrammed colonies [17]. These two phenotypically distinct colonies were recovered, separately cultured on mouse embryonic feeder cells (MEFs) (Supporting Information Fig. S1), and examined for markers of pluripotent stem cells (PSCs) and specific ES-related microRNAs (miRNAs), and methylation status of the cytosine guanine dinucleotides (CpG) in genes related to pluripotency [8, 25]. Bisulfite genomic sequencing demonstrated that CpG dinucleotides within OCT4 and NANOG promoter regions in fully reprogrammed cells were predominantly demethylated compared to parental CB-CD34+ cells (Fig. 1D). In contrast, partially reprogrammed cells contained highly methylated CpG dinucleotides, and methylation levels similar to parental CB-CD34+ cells, consistent with OCT4 and NANOG genes displaying greater transcriptional activity in fully, than partially, reprogrammed cells (Fig. 1D). After removal from MEFs to generate embryoid bodies (EB) in suspension culture, fully reprogrammed cells differentiated into lineage cells expressing ectoderm (Nestin, Tuj1, and Foxa2), mesoderm (α-SMA, PECAM, and TIE-2), and an endoderm Alpha-fetoprotein (AFP) marker (Fig. 1E lower panels, 1F), while partially reprogrammed cells formed EB-like structure and showed little expression of differentiated cells from the three germ layers (Fig. 1E upper panels, 1F). We also found that while differentiation of fully reprogrammed iPS cells into EB resulted in significant downregulation in pluripotent gene (OCT4 and NANOG) expression compared to undifferentiated fully reprogrammed iPS cells, suspension culture of partially reprogrammed cells had no effect on OCT4 and Nanog expression (Fig. 1F upper panel) [26]. We and others have previously reported generation of teratomas from fully reprogrammed colonies within 2 months in NOD/SCID mice after injection into the testis [10, 27], but cells from partially reprogrammed colonies failed to develop into teratomas after implantation for more than 4 months. Preservation of normal chromosomal stability/integrity is one of the hallmarks of fully reprogrammed iPS cells. Our karyotyping studies have revealed that both partially and fully reprogrammed iPS cells have normal female karyotypes (Fig. 1G). We used SSEA-4 expression to discriminate type I (stable partially reprogrammed cells) and II colonies (partially reprogrammed cells with some conversion drift to fully reprogrammed cells) [17]. Our partially reprogramed cells lacked expression of SSEA-4 for up to 20 passages and maintained exogenous factor expression (Fig. 1H), suggesting similarity to type I stable partially reprogrammed colonies. We characterized three different clones of partially and fully reprogrammed cells obtained from each of three independent experiments that used four Yamanaka factors to reprogram CB-CD34+ cells. In this article, we have defined partially reprogrammed cells as cells exhibiting self-renewal capacity and an iPS cell-like morphology, but to persistently express exogenous reprogramming factors, lack of TRA-1-60 and SSEA-4 expression, exhibit hypermethylated regions in NANOG and OCT4 promoters, failure to differentiate into all three germ layers in vitro, and lack of teratoma forming potential in vivo.
Figure 1.
Characterization of complete and partially reprogrammed cells. (A): Live cell staining and imaging following generation of iPSCs in real time. Left/upper: morphology of two types of colonies under phase-contrast microscopy. Right/upper: exogeneous GFP expression in same scope with phase-contrast image. Left/bottom: ESC-specific TRA-1-60 expression. Right/bottom: GFP and TRA-1-60 are merged for the two types of colonies. Arrows indicate expression of GFP-negative fully reprogrammed cells and arrowheads indicate expression of TRA1-60-negative partially reprogrammed cells. (B): Repression of exogenously introduced transgenes as shown by RT-PCR analyses of OCT4, SOX2, MYC, and KLF4 expression. Specific primers were designed to probe for either the 3′ untranslated region (endogenous), which measures expression of the endogenous gene only, or for primers specific (Exogeneous) to the region of the viral transgenes. FCB; thawed frozen cord blood, fully reprogrammed cells; TRA-1–60+EGFP−, and partially reprogrammed cells; TRA-1-60−EGFP+. (C): Expression of GFP (green), hESC-specific marker genes (red), OCT4, NANOG, Tra-1-81, 1–60, and SSEA-4 in partially reprogrammed colonies and fully reprogrammed colonies by immunocytochemical analysis. Nuclei were counterstained with DAPI (blue). Scale bar = 50 and 100 µm. White arrows indicate expression of hES-specific marker genes in the partially reprogrammed cells. (D): Bisulfite sequencing analyses of the Oct4 and Nanog promoters in thawed CD-C34+ cells, partially reprogrammed cells and fully reprogrammed cells. Each horizontal row of circles represents an individual sequencing reaction for a given amplicon. Open and filled circles, respectively, represent unmethylated and methylated CpGs dinucleotides. (E): Expression of GFP (green), hESC-specific marker genes (red), OCT4, NANOG, TRA-1-81, 1–60, and SSEA-4 in partially reprogrammed colonies and fully reprogrammed colonies by immunocytochemical analysis. Nuclei were counterstained with DAPI (blue). Scale bar = 50 and 100 µm. (F): Expression of undifferentiated-specific marker genes (OCT4 and NANOG) and differentiated lineage marker genes (FOXa2, TIE-2, and AFP) is displayed in differentiated fully and partially reprogrammed cells with 10-day EB by QRT-PCR analyses. All experiments were performed three times in triplicates and values represent meant ± SD. Student’s t test: **, p < .01 and ***, p < .001. (G) QRT-PCR was performed to evaluate expression of the SRY1 gene that specifically identifies male gender. Karyotyping analysis in partially and fully reprogrammed iPS cells revealed normal chromosomal stability/integrity. (H): Expression of SSEA-4 in 10–20 passaged partially reprogrammed cells by immunocytochemical analysis. Scale bar = 50 µm. (I): Quantitative RT-PCR analyses for expression of hES cell-specific miRNAs (miR-302 cluster and miR-371 cluster) in hES-H9, CB-iPS, partially reprogrammed cells, and CD34+CB. Individual PCR reactions were normalized against U6 and plotted relative to expression level in hES-H9. Abbreviations: AFP, Alpha-fetoprotein; DAPI, 4′,6-diami-dino-2-phenylindole; FCB, frozen cord blood; GFP, green fluorescent protein; hES, human embryonic stem; iPS, induced pluripotent stem.
MiR-302a/b/c/d But Not miR-367 Is Required for Unlocking Partially Reprogrammed Cells to Fully Reprogrammed Competent State
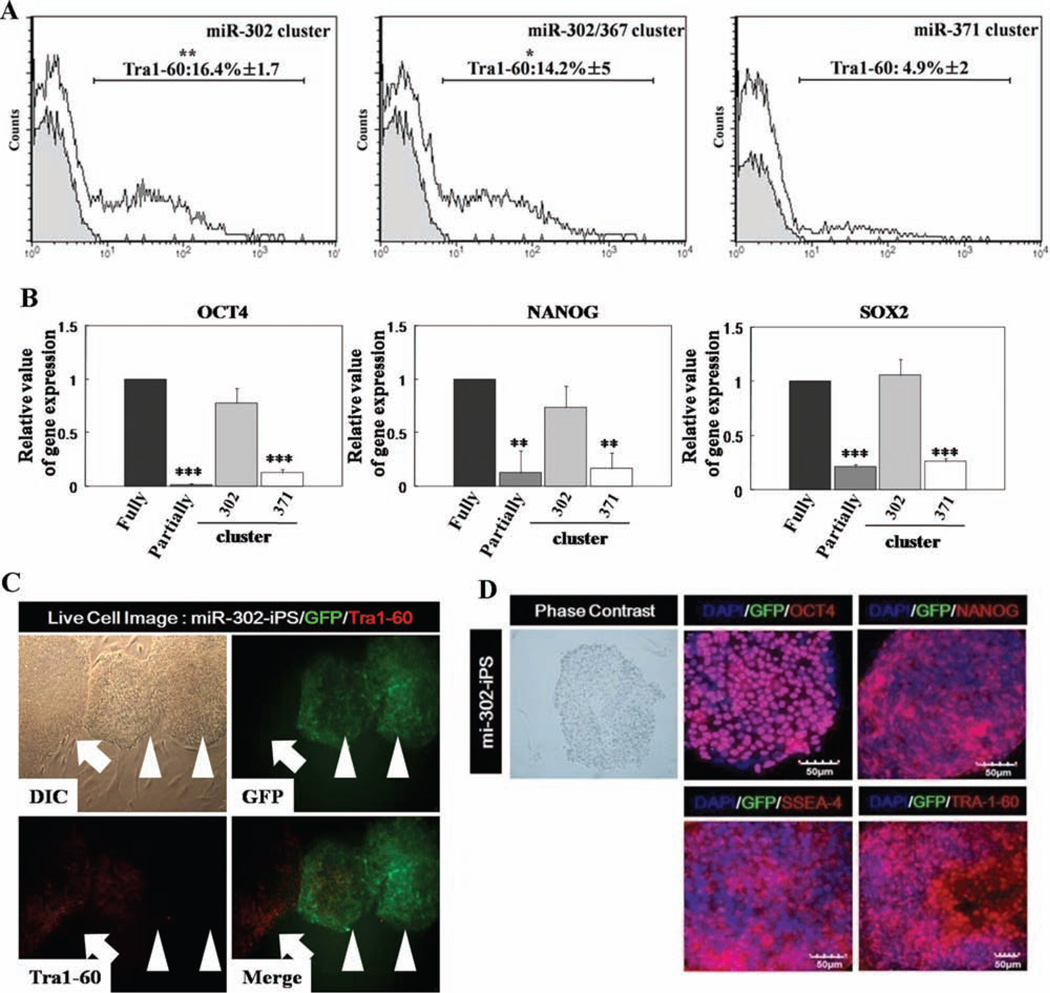
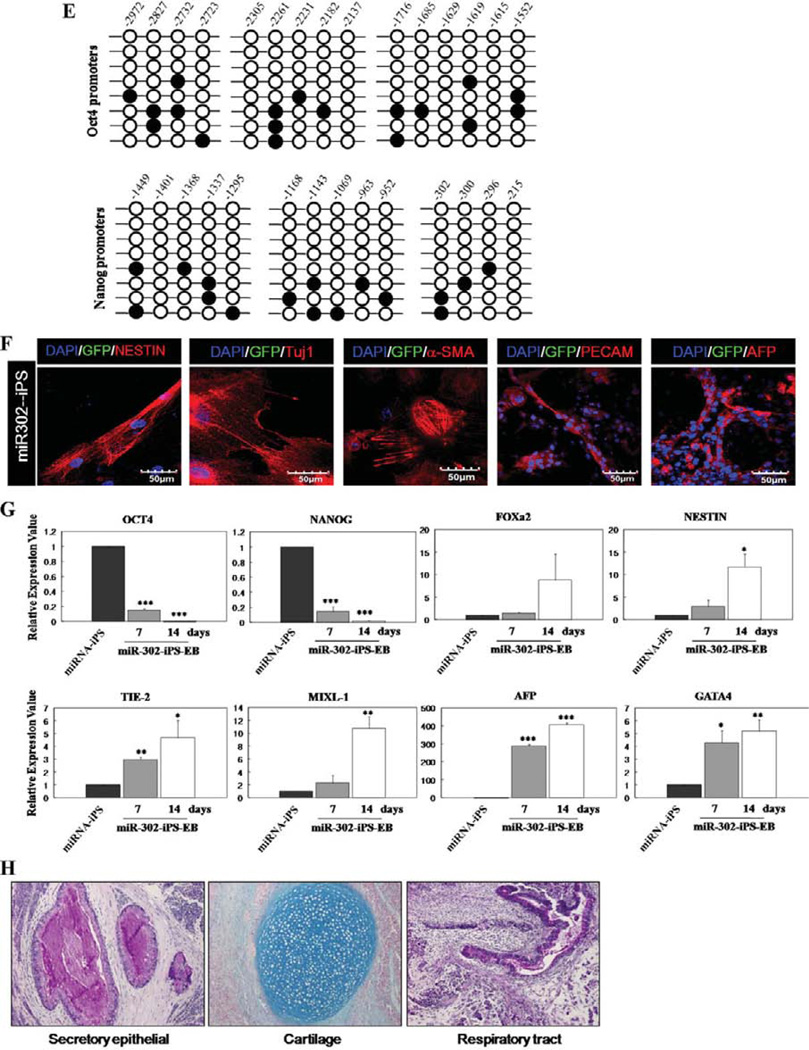
We speculated that miRNAs played a role in this somatic cell barrier to attain a fully reprogrammed iPS state, because miRNAs help fine-tune translation of numerous target mRNAs thereby regulating diverse biological processes including embryonic development [28–30]. Partially reprogrammed colonies were markedly different from fully differentiated somatic cells in miRNA expression profiles (Supporting Information Table). Fully reprogrammed iPS colonies and hES-H9 cells expressed high levels of hESC-specific miR-302a, b, c, d, and miR-367 [31–33], while partially reprogrammed cells displayed limited expression of these miRNAs (Fig. 1I). To test whether introduced high-level expression of hESC-specific miRNAs in partially reprogrammed cells might overcome the transition barrier to full iPS cell reprogramming, partially reprogrammed TRA-1-60− /EGFP+ colonies were transduced with lentiviruses overexpressing the human miR-302 cluster with miR-367 (miR-302 a, b, c, d, and miR-367), miR-302 cluster without miR-367 (miR-302 a, b, c, and d), or miR-371 cluster (miR-371, 372, and 373) (Fig. 2A and Supporting Information Fig. S2). After culture for 7 days on Matrigel-coated dishes, transduced colonies were mechanically isolated and maintained on fresh MEFs in hESC culture medium containing 10 ng/ml fibroblast growth factor-2. After 2 weeks, TRA-1-60+ cells emerged from miRNA transduced TRA-1-60−/EGFP+ cells (16.4% ± 1.7%) (Fig. 2A). Although the miR-371 cluster is overexpressed in hESCs and malignant germ cell tumors [34, 35] and is involved in cellular proliferation of pluripotent cells, this cluster alone was not efficient (4.9% ± 2%) in inducing a fully reprogrammed cell state. Moreover, the combination of miR-302 and —367 did not confer a greater conversion to a fully reprogrammed state than miR-302 alone. Also, despite multiple attempts (more than three times) to reprogram normal human fetal lung fibroblast (MRC5) cells as well as primary CB-derived CD34+ cells and endothelial colony-forming cells (ECFCs) with the miR-302 cluster alone or with the miR-302 cluster with miR-367 in the absence of Yamanaka factors, we failed to generate human iPS cells, suggesting these miRNAs may not initiate complete reprogramming events in these human primary cells using published protocols [23], but instead play an important role for transitioning of transcription factor-induced partially reprogrammed cells to a fully reprogrammed state. It is important to note that typical reprogramming efficiency with Yamanaka factors alone is below 0.1% and here we report that the conversion efficiency of partially to fully reprogrammed iPS cells with miR-302 cluster is more than 15%. While we do not know the molecular events occurring in the 85% of the cells that did not achieve full conversion, we have shown here that the miR-302 pathway is sufficient to convert 16% of the partially reprogrammed cells to fully reprogrammed cells. It is possible that different reprogramming pathways may be required to achieve complete reprogramming in the remaining 85% of the partially reprogrammed cells. Fully reprogrammed TRA-1-60+ cells induced by overexpression of the exogenous miRNA-302 cluster, but not by the miR-371 cluster, exhibited increased endogenous expression of mRNA for OCT4, NANOG, and SOX2 (Fig. 2B), results confirmed by OCT4, NANOG, TRA-1–60, and SSEA-4 protein expression in miR-302 cluster transduced colonies (Fig. 2B, 2D). In addition, fully reprogrammed cells induced by overexpression of the miRNA-302 cluster demonstrated eventual complete silencing of the lentiviral miR-302 transgene and EGFP expression, consistent with attaining a fully reprogrammed iPS state (Fig. 2C, arrow). CpG dinucleotides within the OCT4 and NANOG promoter regions in miR-302-iPS cells were significantly demethylated (Fig. 2E) compared to parental CB-CD34+ or partially reprogrammed cells (Fig. 1C). MiR-302-iPS cells formed tightly packed EBs similar to those from hESC after 7 days in suspension culture without MEFs which expressed ectoderm (NESTIN and Tuj1), mesoderm (α-SMA and PECAM), and endoderm (AFP) markers (Fig. 2F), indicating that miR-302-iPS cells acquired the capacity to form progeny of all three germ layers. Reduced expression of pluripotency-related gene transcripts (OCT4 and NANOG), but increased expression of the transcripts specific to ectoderm (FOXa2 and NESTIN), mesoderm (TIE-2 and MIXL-1), and endoderm (AFP and GATA4) genes was detected in miR-302-iPS cells during EB formation (Fig. 2G), and miR-302-iPS cells formed teratomas in NOD/ SCID mice within 2 months of implantation (Fig. 2H), exhibiting similar time requirement for teratoma formation as shown by Yamanaka factor alone induced iPS cells. However, we also noticed that in miR-302-iPS cells, we found increased frequency of teratoma formation (four out of six) compared to Yamanaka factor alone iPS cells (three out of seven), suggesting that miR302-cluster-induced iPS cells exhibited similar latency but higher prevalence of teratoma formation compared to Yamanaka factor alone induced iPS cells. Thus, expression of the miR-302 cluster is sufficient for release of partially reprogrammed cells from a ‘‘locked-in’’ status and conversion to competent iPS cells. Importantly, while reprograming of primary cells to iPS cells in the absence of Yamanaka factors requires both miR-367 and miR-302a/b/c/d [23], in our studies, miR-367 is not required and miR-302a/b/c/d alone is sufficient to convert transcription factor-induced partially to fully reprogrammed cells.
Figure 2.
Partially reprogrammed cells gain pluripotency by ectopic expression of miR-302 cluster. (A): miRNA-induced partially reprogrammed cells were analyzed by fluorescence-activated cell sorting for expression of pluripotency marker, TRA-1-60. Gray histogram represents partially reprogrammed cells and empty histogram represents miRNA-induced cells (n = 3–5 for each miRNA transduction experiments). Values represent mean ± SD. Student’s t test: *, p < .05 or **, p < .01. (B): mRNA expression of OCT4, SOX2, and NANOG genes was analyzed by QRT-PCR in partially reprogrammed cells transduced with miRNAs. Samples were normalized against the internal control (ACTIN) and relative to the expression level in hES-H9 cells. All experiments were performed three times in triplicates and values represent meant ± SD. Student’s t test: *, p < .05; **, p < .01; and ***, p < .001. (C): The colonies reprogrammed with miR-302 cluster were analyzed by live immunofluores-cence imaging. Two types of cells emerged in transduced partially reprogrammed iPS cells: TRA-1-60 positive (arrow) and negative/GFP (arrow head) cells. Left/upper: morphology of two types of colonies under phase-contrast microscopy. Right/upper: exogeneous GFP (green). Left/bottom: embryonic stem cell-specific TRA-1-60 (red) expression. Right/bottom: GFP and TRA-1-60 are merged for the two types of colonies. (D): Expression of EGFP (green) and hES-specific marker genes (red; OCT4, NANOG, SSEA-4, and TRA-1-60) in miR-302-iPS cells by immunocy-tochemical analyses. Nuclei were counterstained with DAPI (blue). Scale bar = 50 µm. Representative micrographs are from three independent experiments characterizing miR-302-iPS clones. (E): Bisulfite sequencing analyses of the OCT4 and NANOG promoters in miR-302-induced fully reprogrammed cells. Each horizontal row of circles represents an individual sequencing reaction for a given amplicon. Open and filled circles, respectively, represent unmethylated and methylated CpG dinucleotides. (F): Expression of EGFP (green) and three germ layer-specific marker genes (red; Nestin, Tuj1, α-SMA, Pecam, and AFP) in miR302-iPS-derived 14-day attached EBs by immunocytochemical analyses. Nuclei were counterstained with DAPI (blue). Scale bar = 50 µM. Representative micrographs are from three independent experiments characterizing differentiated cells obtained from miR-302-iPS clones. (G): Quantitative RT-PCR performed on undifferentiated (miR-302-iPS cells) and EB-differentiated miR-302-iPS cells shows upregulated expression of lineage markers from three germ layers (undifferentiated; OCT4 and NANOG, ectoderm; FOXa2 and NESTIN, Mesoderm; TIE-2 and MIXL-1, and endoderm; AFP and GATA4. (H): Teratomas derived from immu-nodeficient mice injected with miR-302-iPS cells show tissues representing all three embryonic germ layers, including respiratory tract (endo-derm), cartilage (mesoderm), and secretory epithelium (ectoderm). Abbreviations: DAPI, 4′,6-diamidino-2-phenylindole; GFP, green fluorescent protein; hES, human embryonic stem; iPS, induced pluripotent stem.
MBD2 Is a Bona fide Direct Target of the miR-302 Cluster and Is Highly Expressed in Partially Reprogrammed Somatic and Differentiated Cells, But Is Not Expressed in Pluripotent Cells
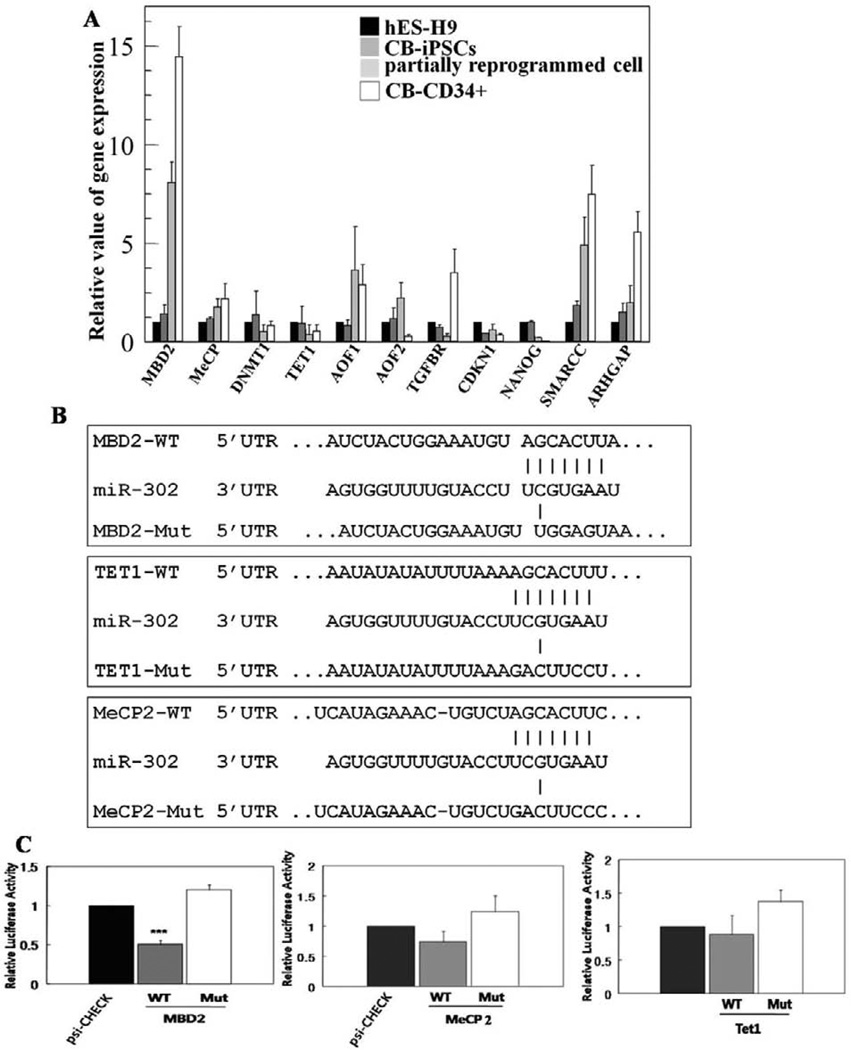
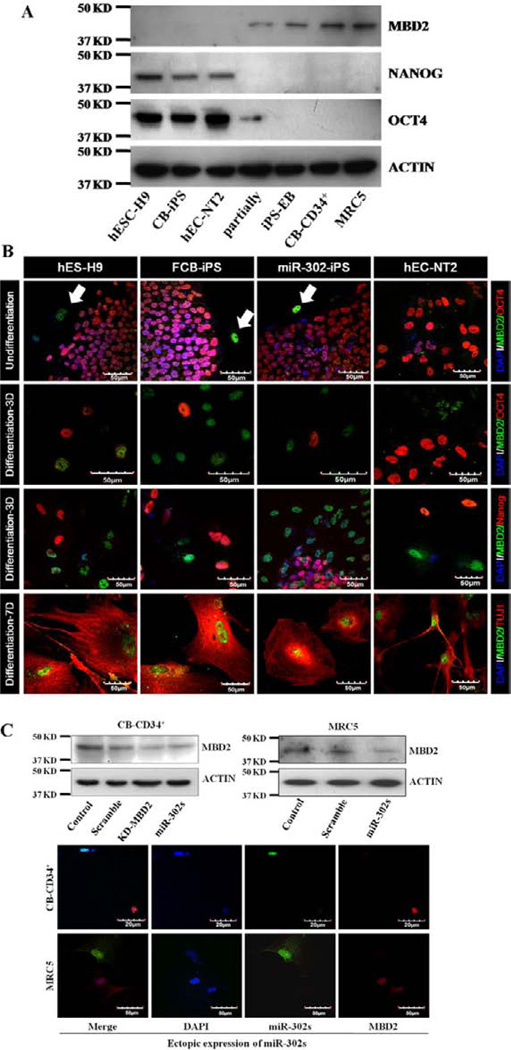
To determine the mechanisms of the miR-302 cluster in completing somatic cell reprogramming, we analyzed TargetScan (ver. 5.1) and published putative targets to select potential target genes (MBD2, MeCP2, AOF1, AOF2, TGFBR, CDKN1, NANOG, SMARCC, ARHGAP, DNMT1, and Tet1; Fig. 3A) downregulated by the miR-302 cluster. Among other reported multiple putative target genes of miR-302 cluster involved in reprogramming of primary cells to iPSCs with Yamanaka factors [22, 36], we found high-level MBD2 mRNA expression in partially compared to fully reprogrammed iPS cells or hES-H9 cells (Fig. 3A). MBD2 is a methyl DNA binding protein that epigenetically regulates its target gene expression. A recent report suggests that the miR-302 cluster regulates DNA methylation levels in somatic cell reprogramming by direct regulation of epigenetic regulators such as MeCP2 and AOF2 [37]. To identify bona fide miR-302 target(s), we examined luciferase activity using three important genes (MBD2, Tet1, and MeCP2; Fig. 3B, 3C) involved in epigenetic modification of target genes through regulation of DNA methylation during normal cell differentiation, organ development, and disease progression. We generated wild-type 3′UTR (WT) and mutated 3′UTR (Mut) luciferase reporter constructs [29, 38], and determined that only the miR-302 cluster significantly reduced luciferase activity in the reporter containing the wild-type 3′ UTR of MBD2 (Fig. 3B, 3C). Reduction in MBD2 luciferase activity by the miR-302 cluster overexpression is consistent with a recent report that suggests miR-302b targets MBD2 [22]. MBD2 specifically binds methylated DNA, colocalizes with methylated sequences, and may mediate silencing of DNA methylation and recruitment of protein partners in mammalian cells [39, 40]. Although our data suggest MBD2 as a bona fide target of the miR-302 cluster, protein expression profiles of MBD2 in undifferentiated pluripotent cells and pluripotent stem cell-derived differentiated somatic cells have not been reported. MBD2 was expressed at very low levels in hPSCs such as hESCs, hiPSCs, and hECCs but was significantly increased in differentiated somatic cells and partially reprogrammed cells (Fig. 4A). Differentiation of hPSCs into somatic cells was associated with diminished OCT4 and NANOG expression (Fig. 4A). Partially reprogrammed iPSCs expressed OCT4 at a low level but did not express NANOG. MBD2 was preferentially expressed in cells not expressing NANOG and OCT4, and in more differentiated cells that expressed TUJ1 (Fig. 4B) suggesting that increased MBD2 expression is likely associated with differentiation of hPSCs. To ensure a functional connection between miR-302 and MBD2, we transduced the miR-302 cluster into human CB-CD34+ and normal human fetal lung fibroblast (MRC5) cells (which do not express miR-302) and measured expression levels of MBD2. MiR-302 greatly reduced expression of MBD2 in CB-CD34+ and MRC5 cells similar to the levels achieved by the overexpression of MBD2 shRNAs (Fig. 4C and Supporting Information Fig. S3).
Figure 3.
miR-302 cluster directly regulates MBD2. (A): Expression levels of potential target genes in hES-H9, CB-iPSCs, partially reprogrammed cells, and cord blood CD34+(CB-CD34+) were analyzed by real-time PCR. Relative expression values of mRNAs are normalized to the level of ACTIN mRNA. (B): Vector alone (psi-check) or luciferase-reporter constructs containing WT 3′UTR of MBD2, MeCP2, and Tet (WT) or mutant 3′UTR (Mut) were transfected into hECCs which expressed miR-302 cluster. (C): Effect of miR-302 cluster on relative luciferase activities is presented as histograms. Experiments were carried out in triplicates for each sample and values represent mean ± SD. Student’s t test: ***, p < .001. Abbreviations: CB-iPSC, cord blood-derived iPS; hES, human embryonic stem; iPSCs, induced pluripotent stem cells.
Figure 4.
MBD2 is highly expressed in differentiated somatic cells and its expression is directly suppressed by miR-302 cluster in human pluripo-tent stem cells (hPSCs). (A): Expression levels of protein of MBD2, NANOG, OCT4, and ACTIN in hPSCs and somatic cells were assessed by Western blotting using specific antibodies that recognize these proteins (n = 3). MBD2 antibody that recognizes 45 kDa MBD2 protein was used. (B): Expression of MBD2 (green), OCT4 (red), and Tuj1 (red) in undifferentiated hPSCs and their derived differentiated cells at days 3 and 7 are displayed by immunocytochemical analyses. Nuclei were counterstained with DAPI (blue). Scale bar = 50 µm. Arrows indicate mouse embryonic fibroblasts. Representative micrographs are from three independent experiments characterizing differentiated cells obtained from hPSCs. (C): Scrambled control, shRNA-MBD2, or miR-302 cluster was transduced into CB-CD34+ and MRC5 cells which did not express miR-302 cluster. Expression of MBD2 with miR-302 cluster is shown as Western blots and Immunocytochemistry (one of three representative experiments). Abbreviations: CB-iPSC, cord blood-derived induced pluripotent stem cell; DAPI, 4′,6-diamidino-2-phenylindole; hESC, human embryonic stem cell.
NANOG Expression Is the Key Event in miR-302 Cluster-Mediated Inhibition of MBD2 in the Conversion of Partially to Fully Reprogrammed Cells
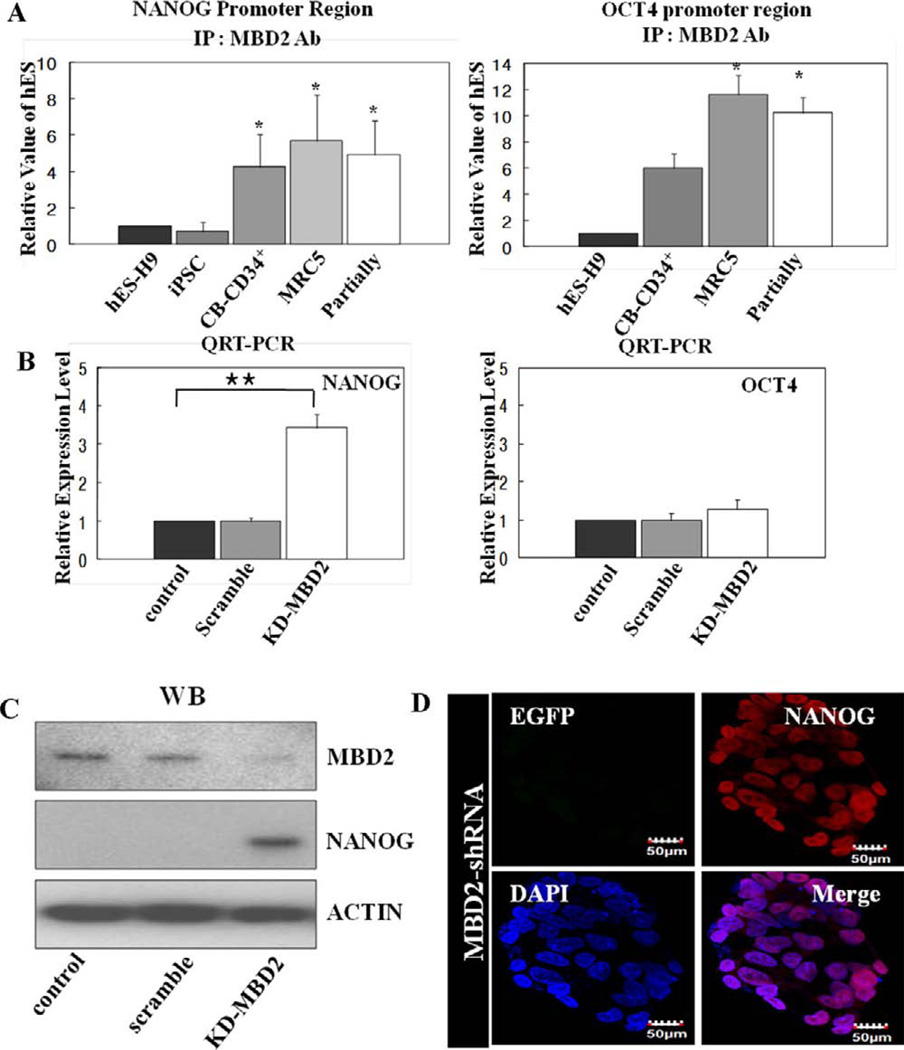
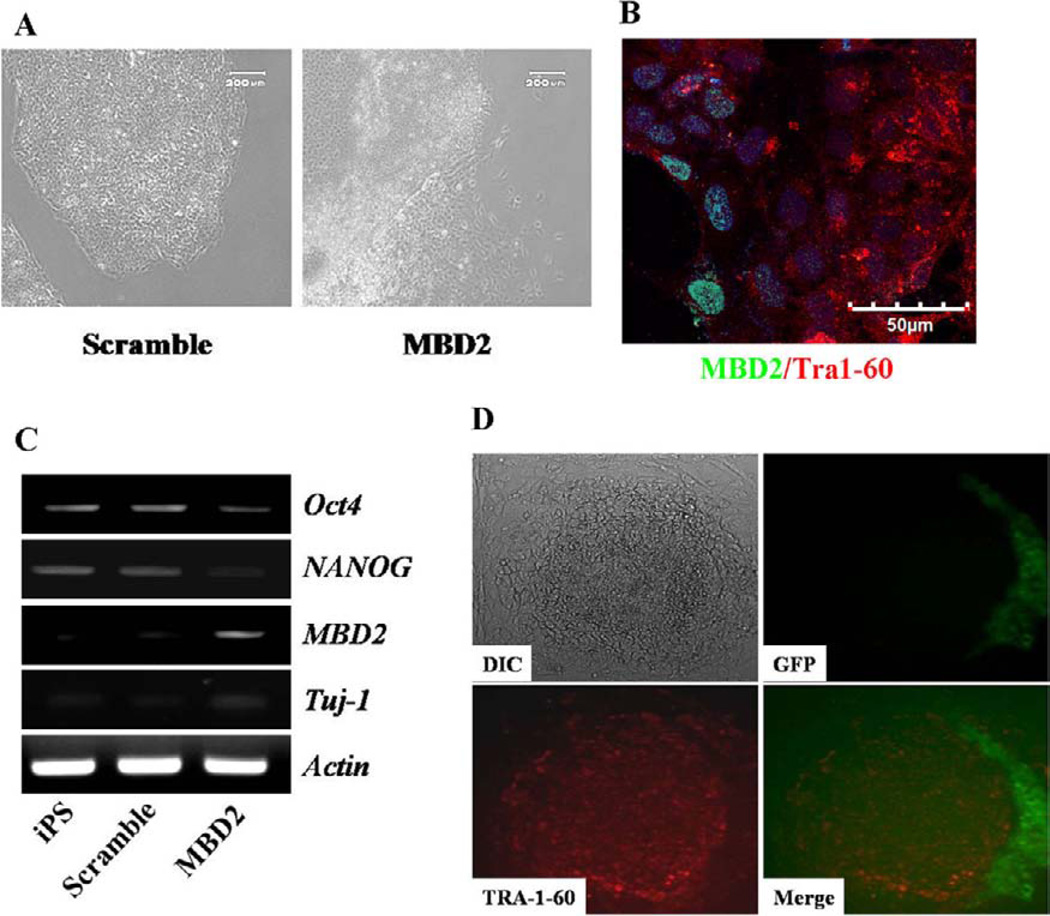
It was unclear from our studies if the miR-302 cluster-mediated downregulation of MBD2 was directly involved in relieving suppression of endogenous pluripotent gene expression in cells undergoing complete reprogramming. Thus, we performed ChiP analysis to examine levels of MBD2 binding to pluripotent (OCT4 and NANOG) gene promoter regions isolated from partially reprogrammed, fully reprogrammed, and H9 cells. Among other promoter regions, OCT4 and NANOG promoter regions from partially reprogrammed cells exhibited increased levels of MBD2 binding compared to fully reprogrammed and H9 cells (Fig. 5A). Next, MBD2 downregulation resulted in increased NANOG, but not increased OCT4, expression, suggesting that OCT4 expression might be regulated by an MBD2-independent pathway (Fig. 5B). Although recent reports implicate OCT4 regulation by miR-302 [41, 42] and MBD2 binds to OCT4 promoter regions [43], the role of MBD2 in regulation of NANOG, which is critical for induction and maintenance of the pluripotent state as a downstream factor of OCT4 in pluripotency gene regulatory networks, was unknown. Therefore, we examined the role of MBD2 in regulation of NANOG expression. MBD2 bound to the NANOG promoter regions of CD34+, MRC5, and partially reprogrammed cells, but not to the NANOG promoter regions isolated from undifferentiated hESCs (Fig. 5A-left panel). Western blotting and QRT-PCR revealed that MBD2 was expressed at high levels in partially reprogrammed cells and knockdown of MBD2 expression with shRNA-MBD2 significantly increased NANOG protein and mRNA expression (Fig. 5B, 5C). Confocal microscopy confirmed that specific reduction of MBD2 expression by shRNA-MBD2 induces NANOG expression in partially reprogrammed cells that previously constitutively expressed MBD2 at high levels (Fig. 5D). Diminishing MBD2 expression by specific shRNA resulted in increased NANOG expression, suggesting that regulation of MBD2 is essential for NANOG expression during somatic cell reprogramming. Direct overexpression of MBD2 in fully reprogrammed iPS cells caused downregulation of NANOG and other pluripotent gene expression (Fig. 6A–6C), resulting in loss of the fully reprogrammed pluripotent state indicated by loss of TRA-1-60 surface expression (Fig. 6B). This suggests that the miR-302 cluster-mediated downregulation of MBD2 to induce and maintain NANOG expression is the key event for inducing and maintaining a fully reprogrammed pluripotent state. When we directly overexpressed NANOG in partially reprogrammed cells, we detected emergence of fully reprogrammed cells (as indicated by acquisition of TRA-1-60 expression, Fig. 6D). Thus, enhancing NANOG expression is key to miR-302 cluster-mediated inhibition of MBD2 in conversion of partially to fully reprogrammed iPS cells.
Figure 5.
MBD2 regulates NANOG expression during the reprogramming process. (A): Quantitative real-time PCR analysis of immunoprecipi-tated DNA using antibodies specific for MBD2 from undifferentiated hESCs (hES-H9), partially reprogrammed cells, and CB-derived CD34+ (CD34+ cells). All relative values obtained were normalized with input DNA. (B): Control scrambled or shRNAs specific to MBD2 (KD-MBD2) were transduced to overexpress them in partially reprogrammed cells. Expression levels of NANOG and OCT4 were compared by QRT-PCR (n = 3). Fold changes of band intensities are normalized by ACTIN intensities. Statistical significance was determined by comparing the data with those of control. Student’s t test: *, p < .05; **, p < .01. (C): Control scrambled, shRNAs specific to MBD2 (KD-MBD2) were transduced to overexpress them in partially reprogrammed cells. Expression levels of MBD2 and NANOG were compared by Western blotting (left panel) and QRT-PCR (right panel) (n = 3). Fold changes of band intensities are normalized by ACTIN intensities. (D): Protein expression of EGFP and NANOG in partially reprogrammed cells transduced with MBD2-shRNA was visualized by confocal microscopic images. Overexpression of MBD2-shRNA caused increase in NANOG expression (cells with red fluorescence) and suppressed EGFP expression in these cells. Nuclei are shown by DAPI (blue) (scale bar = 50 µm). Representative micrographs are from three independent experiments characterizing partially reprogrammed cells overexpressing MBD2-shRNA. Abbreviations: CB-iPSC, cord blood-derived induced pluripotent stem cell; DAPI, 4′,6-diamidino-2-phenylindole; hESC, human embryonic stem cell; iPS, induced pluripotent stem.
Figure 6.
Overexpression of MBD2 in fully reprogrammed iPS cells results in loss of undifferentiated iPS characteristics and overexpression of NANOG in partially reprogrammed cells converts them to cells possessing characteristics of fully reprogrammed iPS cells. (A): Fully reprogrammed iPS cells transduced with scramble control or MBD2 overexpressing constructs. Live cell immunofluorescence imaging indicated while scramble control transduced cells exhibited undifferentiated iPS colony morphology (left panel). MBD2 overexpressing cells lose undifferentiated iPS colony morphology (right panel). Representative micrographs are from three independent experiments (scale bar = 200 µm). (B): Immunoflu-orescence imaging indicated that MBD2 overexpressing cells exhibit loss of TRA-1-60 expression. (C): Gene expression analysis in uninfected control iPS cells, scramble control-infected iPS cells, and MBD2 overexpressing construct-infected iPS cells exhibited decreased NANOG and OCT4 expression in MBD2 overexpressing cells compared to uninfected control and scramble control treated iPS cells. (D): Live cell immunoflu-orescence imaging indicated partially reprogrammed colonies transduced with NANOG overexpression construct exhibited fully reprogrammed iPS colony morphology (top left panel) with significant loss in transgene expression (top right panel) and upregulation in TRA-1-60 expression. Bottom left panel is indicating TRA-1-60 expression and bottom right panel is a merged image of TRA-1-60 and EGFP expression. Micrographs are representative of three independent experiments. Abbreviations: GFP, green fluorescent protein; iPS, induced pluripotent stem.
Targeted Removal of MBD2 Expression in Somatic Cells Enhances Complete Reprogramming
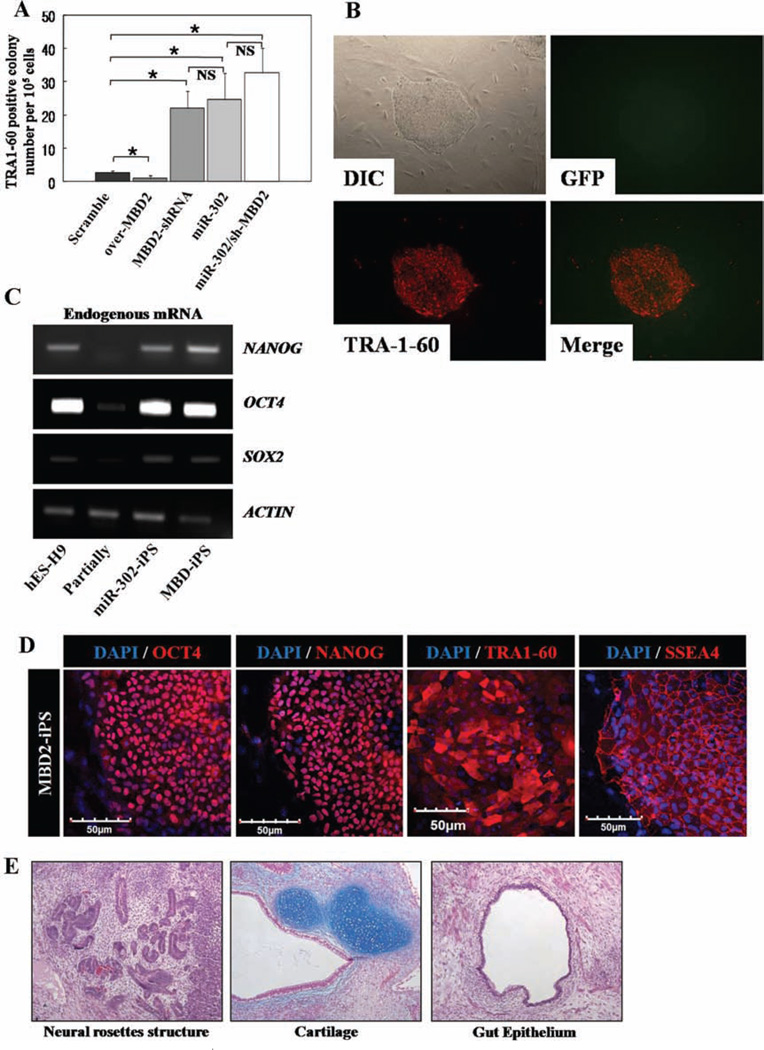
To verify the role of MBD2 in complete reprogramming of somatic cells to iPS cells induced by Yamanaka factors, we assessed whether MBD2 shRNA knockdown in CB-CD34+ and MRC5 cells facilitates reprogramming. MBD2-shRNA knockdown greatly reduced MBD2 protein expression (Supporting Information Fig. S4A), and MBD2 binding to the NANOG promoter region was diminished by 80% (Supporting Information Fig. S4B) in MRC5 cells. When Yamanaka factors were overexpressed, we noticed a 10.5-fold higher efficiency generation of iPS cells in MBD2-shRNA-, compared to scrambled control shRNA-, transduced CB-CD34+, or MRC5 cells overexpressing Yamanaka factors (Fig. 7A, 7B; and Supporting Information Fig. S4C, S4D, S4E, S4F). While downregulation of MBD2 enhances reprogramming efficiency (Fig. 7A), the effect in reprogramming efficiency due to over-expression of MBD2 in cells undergoing complete reprogramming is unknown. To determine this, MBD2 was overexpressed in CD34+ cells and the cells were transduced with Yamanaka factors. MBD2 overexpression significantly decreased their reprogramming efficiency (Fig. 7A), demonstrating that downregulation of MBD2 during reprogramming is essential for complete reprogramming. Although our data suggest that MBD2 downregulation is critical for complete reprogramming and miR-302 cluster downregulates MBD2 in reprogramming cells, it was not known if MBD2-mediated enhanced reprogramming was exclusively caused by miR-302-mediated downregulation of MBD2 in these cells. To test this, we used MBD2-shRNA to downregulate MBD2 expression in CB-CD34+ cells in order to select MBD2-shRNA overexpressing cells which then received Yamanaka factor overexpressing constructs. We hypothesized that if miR-302 is involved in reprogramming through targets other than MBD2, we ought to observe a synergistic or additive effect in reprogramming efficiency with Yamanaka factors in the MBD2-shRNA overexpressing cells subsequently transduced with miR-302. However, reprogramming efficiency was not significantly higher, nor was an additive effect observed (Fig. 7A), suggesting that miR302 directly acts through downregulation of MBD2 in cells undergoing complete reprogramming.
Figure 7.
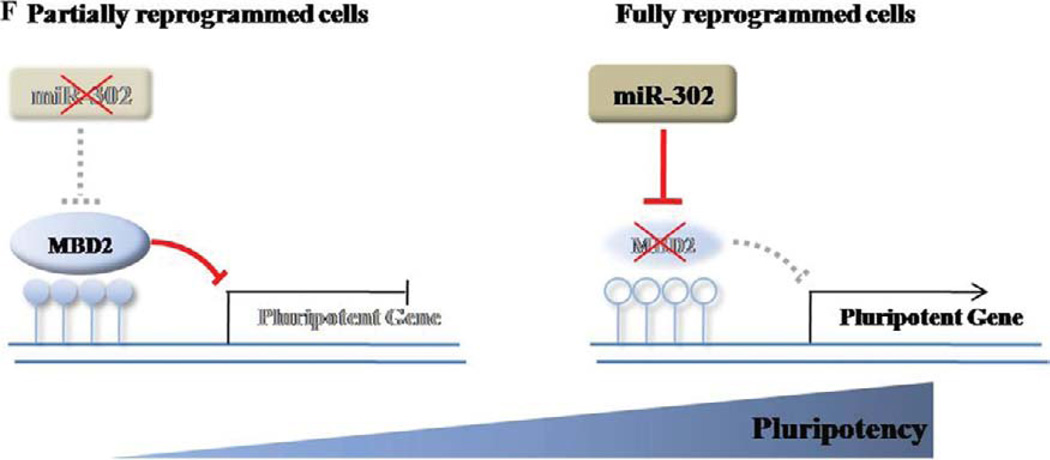
MBD2-knockdown in CB-CD34+ cells enhances generation of fully reprogrammed iPS cells. (A): Scrambled, overexpressed MBD2, MBD2-shRNA, overexpressed miR-302 cluster, and combined miR-302 cluster and MBD2-shRNA were introduced to CB-CD34+ cells (n = 4 independent reprogramming experiments carried out in duplicates for each group. Values represent mean ± SD. Student’s t test: *, p < .05. (B): Representative image of the colonies reprogrammed with MBD2-KD-iPS analyzed by live immunofluorescence imaging. (C): Expression of endogenous pluripotent-specific genes as shown by RT-PCR analysis of NANOG, OCT4, and SOX2 in indicated cells. ACTIN was used as a loading control. Experiments were carried out in triplicates for each sample. (D): Expression of hES-specific marker genes (red; OCT4, NANOG, TRA-1-60, and SSEA-4) in MBD2-KD-iPS by immunocytochemical analyses. Nuclei were counterstained with DAPI (blue). Scale bar = 50 µm. Representative micrographs are from three independent experiments. (E): Teratomas derived from immunodeficient mice injected with MBD2-KD-iPS cells show tissues representing all three embryonic germ layers, including neural rosettes structure (ectoderm), cartilage (mesoderm), and gut epithelium (endo-derm). (F): Schematic of proposed mechanism showing NANOG regulation by miR-302 cluster acting as a master switch for complete reprogramming. Ectopic expression of miR-302 cluster suppresses MBD2 expression, relieving NANOG expression to cause complete reprogramming. Abbreviations: DAPI, 4′,6-diamidino-2-phenylindole; GFP, green fluorescent protein; hES, human embryonic stem; iPS, induced pluripotent stem.
Finally, these reprogrammed cells were assessed by complete characterization profiles for fully reprogrammed cells, including pluripotent gene expression such as TRA-1-60 (Fig. 7B, 7D), and by teratoma forming potential (Fig. 7E). Expression of endogenous PSC-specific factors was confirmed in both scrambled and MBD2-shRNA-derived iPS cells by RT-PCR and immunocytochemistry (Fig. 7C, 7D). Endogenous factors detected in MBD2-iPSCs were similar to that in hES and miR-iPS cells. Differentiation ability of MBD-iPSCs into EBs was confirmed by expression of markers specific to ectoderm (TUJ1), endoderm (aFP), and mesoderm (α-SMA) (Supporting Information Fig. S4G) indicating that diminishing expression of MBD2 promotes complete reprogramming to iPSCs.
Discussion
Global epigenetic reprogramming is essential for temporally and spatially controlled expression of PSC-specific genes during proper cell reprogramming. Although a number of miR-NAs have been implicated in fine-tuning mRNA translation during early mammalian development, the regulatory role of miRNAs and their specific target genes remain poorly understood. During somatic cell reprogramming, the population undergoes stochastic reprogramming events with many cells remaining in a stable intermediary reprogrammed state. Only a small fraction of these cells become completely reprogrammed into iPS cells [44]. During the course of our present studies, the miR-302/367 cluster was reported to reprogram mouse and human somatic cells to an iPS cell-like state without exogenous transcription factors [23, 37, 45], although no specific molecular mechanism was elucidated. Also, our several attempts to directly reprogram MRC5 cells as well as CB-derived CD34+ cells and ECFCs with the miR-302/367 cluster using published protocols [23] in the absence of Yamanaka factors failed to generate iPS cells suggesting that the miR-302/367 cluster may only reprogram certain cell types (human foreskin and dermal fibroblasts used in Anokye-Danso et al. studies [23]) and this miRNA may not have ability to directly reprogram (in the absence of Yamanaka factors) a board range of cell types, thus limiting its utility as a direct reprogramming factor replacing exogenous transcription factors for efficient reprogramming of various clinically relevant somatic cell types to iPS cells. Using partially and fully reprogrammed cells, initially identifiable based upon expression of TRA-1-60 and transduced EGFP prior to further characterizations of full reprogramming, we demonstrated that transduction of the miR-302 cluster to partially reprogrammed cells allowed 15% partially reprogrammed cells to proceed to fully reprogrammed iPS cells. Most importantly, our data for the first time provide significant new insight into the underlying molecular mechanisms involved in the miR-302 cluster-induced complete reprogramming of somatic cells. We reveal that while MBD2 is expressed at high levels in somatic and partially reprogrammed cells, it is not expressed or is expressed at very low levels in fully reprogrammed iPS cells. Also, while the miR-302 cluster is not expressed in somatic and partially reprogrammed cells, it is expressed at high levels in fully reprogrammed, as well as other, pluripotent stem cells. Although MBD2 has been reported as one of the many putative targets of the miR-302 cluster [22], our data for the first time actually provide direct evidence that MBD2 is the primary and direct target of miR-302 cluster in achieving complete iPS cell reprogramming. Of direct relevance mechanistically, overexpression of the miR-302 cluster in somatic and Yamanaka factor-induced partially reprogrammed cells significantly suppressed MBD2 expression in these cells, resulting in increased NANOG expression causing conversion to fully reprogrammed iPS cells (modeled in Fig. 7F). We found that in somatic and partially reprogrammed cells, MBD2 binds to methylated NANOG promoter regions and suppresses transcription of NANOG. When we overexpressed the miR-302 cluster or directly decreased MBD2 expression in these cells, there was significantly increased NANOG gene expression in cells progressing toward complete reprogramming. While previous studies had demonstrated that NANOG expression, among other pluripotent genes, was critical in inducing and maintaining a fully reprogrammed pluripotent state [19, 21, 46], epigenetic regulation of NANOG expression during reprogramming had not been reported. To our knowledge, our data for the first time provide evidence that MBD2 directly regulates NANOG expression, essential for achieving complete iPS reprogramming. Importantly, although it has reported that the miR-302 cluster regulates MeCP2 and AOF2 to influence global DNA methylation levels in somatic cell reprogramming [37], their report did not demonstrate how these epigenetic regulators specifically control expression of key pluripotent gene(s) involved in iPS cell reprogramming. Thus, our study provides significant new mechanistic insight into understanding pluripotent gene promoter regulation, in particular, MBD2-mediated NANOG promoter epigenetic regulation during complete cellular reprogramming. We also found that suppression of MBD2 expression in CB-CD34+ and MRC5 cells significantly increased reprogramming efficiency with Yamanaka factors, suggesting that MBD2 expression imposes a level of reprogramming barrier in different cell types, and relieving MBD2-mediated NANOG suppression by miR-302 cluster expression is crucial not only in enhancing reprogramming efficiency but also in ensuring full reprogramming in more than one cell type. Our manuscript for the first time provides comprehensive mechanistic insight into the complete generation of fully reprogrammed iPS cells through deciphering interactions between the miR-302 cluster and its target MBD2.
One of the ultimate goals of regenerative medicine is to possess a readily renewable source of cells to replace or repair diseased or impaired cells in tissues and organs in affected patients. The ability to generate iPS cells could provide patient and disease-specific cells to study disease pathogenesis and therapeutic efficacy of pharmacological agents against the disease as well as possibly provide an autologous or HLA-defined source of patient cells (e.g., use of HLA-defined CB cells in public cord blood banks) for cell-based therapies. However, in order for this technology to be clinically useful, one needs to be able to find a universal source of appropriate/advantageous starting cell populations for iPS reprogramming that could easily be matched with any potential recipients and be able to efficiently and completely reprogram these cells into competent iPS cells to the extent needed for clinical use. One could use the already cryopreserved and stored CB cells after thawing to generate iPS cells or alternatively generate iPS cell banks where completely reprogrammed and fully characterized iPS cell lines with known HLA types are found. iPS cell technology possesses potential for future clinical application, and understanding molecular mechanism to achieve complete iPS cell reprogramming not only increases the reprogramming efficiency but also ensures that fully reprogrammed iPS cells are available for differentiating into desirable cell types of therapeutic importance.
Summary
We believe that our manuscript for the first time provides complete comprehensive mechanistic insight into the generation of fully reprogrammed human iPSCs. Our studies provide: (a) a molecular explanation for why few cells get fully reprogrammed to complete iPS cells while many cells remained locked in a partially reprogrammed state during iPS cell reprogramming with Yamanaka factors; (b) a reliable mechanism to convert partially reprogrammed cells to fully reprogrammed iPSCs; (c) evidence that MBD2 is the primary and direct target of miR-302 cluster in achieving complete iPS cell reprogramming, although MBD2 has previously been reported as one of the many putative targets of miR-302 cluster; (d) evidence that MBD2 regulates Nanog expression, essential for achieving complete iPS reprogramming; and (e) miR-367 of the miR-302 cluster is not required for converting partially reprogrammed cells to fully reprogrammed cells.
Supplementary Material
Acknowledgments
These studies were supported by funds provided by Public Health Service Grants RO1 HL056416, RO1 HL067384, and PO1 DK090948 to H.E.B., by AHA postdoctoral fellowship to N.P., and by the Riley Children’s Foundation to M.C.Y. We thank Angie Reese and Gail H. Vance from Cytogenetic Division and Laboratories in the Department of Medical and Molecular Genetics, Indiana University School of Medicine, for their assistance in karyotyping analysis.
Footnotes
Author contributions: M.R.L. and N.P.: conception and design, collection and/or assembly of data, data analysis and interpretation, and manuscript writing; H.-D.C. and C.M.: collection and/or assembly of data; Y.-J.K.: data analysis and interpretation; M.C.Y. and H.E.B.: conception and design, financial support, manuscript writing, and final approval of manuscript.
Disclosure of Potential Conflicts of Interest
The authors indicate no potential conflicts of interest.
References
- 1.Takahashi K, Tanabe K, Ohnuki M, et al. Induction of pluripotent stem cells from adult human fibroblasts by defined factors. Cell. 2007;131:861–872. doi: 10.1016/j.cell.2007.11.019. [DOI] [PubMed] [Google Scholar]
- 2.Takahashi K, Yamanaka S. Induction of pluripotent stem cells from mouse embryonic and adult fibroblast cultures by defined factors. Cell. 2006;126:663–676. doi: 10.1016/j.cell.2006.07.024. [DOI] [PubMed] [Google Scholar]
- 3.Broxmeyer HE. Will iPS cells enhance therapeutic applicability of cord blood cells and banking? Cell Stem Cell. 2010;6:21–24. doi: 10.1016/j.stem.2009.12.008. [DOI] [PubMed] [Google Scholar]
- 4.Broxmeyer HE, Douglas GW, Hangoc G, et al. Human umbilical cord blood as a potential source of transplantable hematopoietic stem/progenitor cells. Proc Natl Acad Sci USA. 1989;86:3828–3832. doi: 10.1073/pnas.86.10.3828. [DOI] [PMC free article] [PubMed] [Google Scholar]
- 5.Gluckman E, Broxmeyer HA, Auerbach AD, et al. Hematopoietic reconstitution in a patient with Fanconi’s anemia by means of umbilical-cord blood from an HLA-identical sibling. N Engl J Med. 1989;321:1174–1178. doi: 10.1056/NEJM198910263211707. [DOI] [PubMed] [Google Scholar]
- 6.Broxmeyer HE, Smith FO. Cord blood hematopoietic cell transplantation. In: Applebaum FR, Forman SJ, Blume KG, editors. Thomas Hematopoietic Cell Transplantation. 4th ed. UK: Wiley-Blackwell; 2009. pp. 559–576. Chap 39. [Google Scholar]
- 7.Giorgetti A, Montserrat N, Aasen T, et al. Generation of induced pluripotent stem cells from human cord blood using OCT4 and SOX2. Cell Stem Cell. 2009;5:353–357. doi: 10.1016/j.stem.2009.09.008. [DOI] [PMC free article] [PubMed] [Google Scholar]
- 8.Haase A, Olmer R, Schwanke K, et al. Generation of induced pluripotent stem cells from human cord blood. Cell Stem Cell. 2009;5:434–441. doi: 10.1016/j.stem.2009.08.021. [DOI] [PubMed] [Google Scholar]
- 9.Ye Z, Zhan H, Mali P, et al. Human-induced pluripotent stem cells from blood cells of healthy donors and patients with acquired blood disorders. Blood. 2009;114:5473–5480. doi: 10.1182/blood-2009-04-217406. [DOI] [PMC free article] [PubMed] [Google Scholar]
- 10.Broxmeyer HE, Lee MR, Hangoc G, et al. Hematopoietic stem/progenitor cells, generation of induced pluripotent stem cells, and isolation of endothelial progenitors from 21— to 23.5-year cryopreserved cord blood. Blood. 2011;117:4773–4777. doi: 10.1182/blood-2011-01-330514. [DOI] [PMC free article] [PubMed] [Google Scholar]
- 11.Lin T, Ambasudhan R, Yuan X, et al. A chemical platform for improved induction of human iPSCs. Nat Methods. 2009;6:805–808. doi: 10.1038/nmeth.1393. [DOI] [PMC free article] [PubMed] [Google Scholar]
- 12.Hong H, Takahashi K, Ichisaka T, et al. Suppression of induced pluripotent stem cell generation by the p53–p21 pathway. Nature. 2009;460:1132–1135. doi: 10.1038/nature08235. [DOI] [PMC free article] [PubMed] [Google Scholar]
- 13.Marion RM, Strati K, Li H, et al. A p53-mediated DNA damage response limits reprogramming to ensure iPS cell genomic integrity. Nature. 2009;460:1149–1153. doi: 10.1038/nature08287. [DOI] [PMC free article] [PubMed] [Google Scholar]
- 14.Utikal J, Polo JM, Stadtfeld M, et al. Immortalization eliminates a roadblock during cellular reprogramming into iPS cells. Nature. 2009;460:1145–1148. doi: 10.1038/nature08285. [DOI] [PMC free article] [PubMed] [Google Scholar]
- 15.Hochedlinger K, Plath K. Epigenetic reprogramming and induced pluripotency. Development. 2009;136:509–523. doi: 10.1242/dev.020867. [DOI] [PMC free article] [PubMed] [Google Scholar]
- 16.Mikkelsen TS, Hanna J, Zhang X, et al. Dissecting direct reprogramming through integrative genomic analysis. Nature. 2008;454:49–55. doi: 10.1038/nature07056. [DOI] [PMC free article] [PubMed] [Google Scholar]
- 17.Chan EM, Ratanasirintrawoot S, Park IH, et al. Live cell imaging distinguishes bona fide human iPS cells from partially reprogrammed cells. Nat Biotechnol. 2009;27:1033–1037. doi: 10.1038/nbt.1580. [DOI] [PubMed] [Google Scholar]
- 18.Subramanyam D, Blelloch R. Watching reprogramming in real time. Nat Biotechnol. 2009;27:997–998. doi: 10.1038/nbt1109-997. [DOI] [PubMed] [Google Scholar]
- 19.Silva J, Nichols J, Theunissen TW, et al. Nanog is the gateway to the pluripotent ground state. Cell. 2009;138:722–737. doi: 10.1016/j.cell.2009.07.039. [DOI] [PMC free article] [PubMed] [Google Scholar]
- 20.Sumer H, Liu J, Malaver-Ortega LF, et al. NANOG is a key factor for induction of pluripotency in bovine adult fibroblasts. J Anim Sci. 2011;89:2708–2716. doi: 10.2527/jas.2010-3666. [DOI] [PubMed] [Google Scholar]
- 21.Theunissen TW, van Oosten AL, Castelo-Branco G, et al. Nanog overcomes reprogramming barriers and induces pluripotency in minimal conditions. Curr Biol. 2011;21:65–71. doi: 10.1016/j.cub.2010.11.074. [DOI] [PMC free article] [PubMed] [Google Scholar]
- 22.Subramanyam D, Lamouille S, Judson RL, et al. Multiple targets of miR-302 and miR-372 promote reprogramming of human fibroblasts to induced pluripotent stem cells. Nat Biotechnol. 2011;29:443–448. doi: 10.1038/nbt.1862. [DOI] [PMC free article] [PubMed] [Google Scholar]
- 23.Anokye-Danso F, Trivedi CM, Juhr D, et al. Highly Efficient miRNA-mediated reprogramming of mouse and human somatic cells to pluri-potency. Cell Stem Cell. 2011;8:376–388. doi: 10.1016/j.stem.2011.03.001. [DOI] [PMC free article] [PubMed] [Google Scholar]
- 24.Han DW, Greber B, Wu G, et al. Direct reprogramming of fibroblasts into epiblast stem cells. Nat Cell Biol. 2011;13:66–71. doi: 10.1038/ncb2136. [DOI] [PubMed] [Google Scholar]
- 25.Freberg CT, Dahl JA, Timoskainen S, et al. Epigenetic reprogramming of OCT4 and NANOG regulatory regions by embryonal carcinoma cell extract. Mol Biol Cell. 2007;18:1543–1553. doi: 10.1091/mbc.E07-01-0029. [DOI] [PMC free article] [PubMed] [Google Scholar]
- 26.Ramos-Mejia V, Montes R, Bueno C, et al. Residual expression of the reprogramming factors prevents differentiation of iPSC generated from human fibroblasts and cord blood CD34+ progenitors. PLoS One. 2012;7:e35824. doi: 10.1371/journal.pone.0035824. [DOI] [PMC free article] [PubMed] [Google Scholar]
- 27.Moon SH, Kim JS, Park SJ, et al. Effect of chromosome instability on the maintenance and differentiation of human embryonic stem cells in vitro and in vivo. Stem Cell Res. 2011;6:50–59. doi: 10.1016/j.scr.2010.08.006. [DOI] [PubMed] [Google Scholar]
- 28.Bartel DP. MicroRNAs: Genomics, biogenesis, mechanism, and function. Cell. 2004;116:281–297. doi: 10.1016/s0092-8674(04)00045-5. [DOI] [PubMed] [Google Scholar]
- 29.Lee MR, Kim JS, Kim KS. miR-124a is important for migratory cell fate transition during gastrulation of human embryonic stem cells. Stem Cellsr. 2010;28:1550–1559. doi: 10.1002/stem.490. [DOI] [PubMed] [Google Scholar]
- 30.Landgraf P, Rusu M, Sheridan R, et al. A mammalian microRNA expression atlas based on small RNA library sequencing. Cell. 2007;129:1401–1414. doi: 10.1016/j.cell.2007.04.040. [DOI] [PMC free article] [PubMed] [Google Scholar]
- 31.Gunaratne PH. Embryonic stem cell microRNAs: Defining factors in induced pluripotent (iPS) and cancer (CSC) stem cells? Curr Stem Cell Res Ther. 2009;4:168–177. doi: 10.2174/157488809789057400. [DOI] [PubMed] [Google Scholar]
- 32.Suh MR, Lee Y, Kim JY, et al. Human embryonic stem cells express a unique set of microRNAs. Dev Biol. 2004;270:488–498. doi: 10.1016/j.ydbio.2004.02.019. [DOI] [PubMed] [Google Scholar]
- 33.Barroso-del Jesus A, Lucena-Aguilar G, Menendez P. The miR-302–367 cluster as a potential stemness regulator in ESCs. Cell Cycle. 2009;8:394–398. doi: 10.4161/cc.8.3.7554. [DOI] [PubMed] [Google Scholar]
- 34.Murray MJ, Halsall DJ, Hook CE, et al. Identification of microRNAs From the miR-371~373 and miR-302 clusters as potential serum biomarkers of malignant germ cell tumors. Am J Clin Pathol. 2011;135:119–125. doi: 10.1309/AJCPOE11KEYZCJHT. [DOI] [PubMed] [Google Scholar]
- 35.Voorhoeve PM, le Sage C, Schrier M, et al. A genetic screen implicates miRNA-372 and miRNA-373 as oncogenes in testicular germ cell tumors. Cell. 2006;124:1169–1181. doi: 10.1016/j.cell.2006.02.037. [DOI] [PubMed] [Google Scholar]
- 36.Barroso-delJesus A, Lucena-Aguilar G, Sanchez L, et al. The nodal inhibitor Lefty is negatively modulated by the microRNA miR-302 in human embryonic stem cells. FASEB J. 2011;25:1497–1508. doi: 10.1096/fj.10-172221. [DOI] [PubMed] [Google Scholar]
- 37.Lin SL, Chang DC, Lin CH, et al. Regulation of somatic cell reprogramming through inducible mir-302 expression. Nucleic Acids Res. 2010;39:1054–1065. doi: 10.1093/nar/gkq850. [DOI] [PMC free article] [PubMed] [Google Scholar]
- 38.Lee NS, Kim JS, Cho WJ, et al. miR-302b maintains ‘‘stemness’’ of human embryonal carcinoma cells by post-transcriptional regulation of Cyclin D2 expression. Biochem Biophys Res Commun. 2008;377:434–440. doi: 10.1016/j.bbrc.2008.09.159. [DOI] [PubMed] [Google Scholar]
- 39.Sansom OJ, Maddison K, Clarke AR. Mechanisms of disease: Methyl-binding domain proteins as potential therapeutic targets in cancer. Nat Clin Pract Oncol. 2007;4:305–315. doi: 10.1038/ncponc0812. [DOI] [PubMed] [Google Scholar]
- 40.Kim JK, Samaranayake M, Pradhan S. Epigenetic mechanisms in mammals. Cell Mol Life Sci. 2009;66:596–612. doi: 10.1007/s00018-008-8432-4. [DOI] [PMC free article] [PubMed] [Google Scholar]
- 41.Rosa A, Brivanlou AH. A regulatory circuitry comprised of miR-302 and the transcription factors OCT4 and NR2F2 regulates human embryonic stem cell differentiation. EMBO J. 2010;30:237–248. doi: 10.1038/emboj.2010.319. [DOI] [PMC free article] [PubMed] [Google Scholar]
- 42.Barroso-delJesus A, Romero-Lopez C, Lucena-Aguilar G, et al. Embryonic stem cell-specific miR302–367 cluster: Human gene structure and functional characterization of its core promoter. Mol Cell Biol. 2008;28:6609–6619. doi: 10.1128/MCB.00398-08. [DOI] [PMC free article] [PubMed] [Google Scholar]
- 43.Gu P, Xu X, Le Menuet D, et al. Differential recruitment of methyl CpG-binding domain factors and DNA methyltransferases by the orphan receptor germ cell nuclear factor initiates the repression and silencing of Oct4. Stem Cells. 2011;29:1041–1051. doi: 10.1002/stem.652. [DOI] [PMC free article] [PubMed] [Google Scholar]
- 44.Yamanaka S. Elite and stochastic models for induced pluripotent stem cell generation. Nature. 2009;460:49–52. doi: 10.1038/nature08180. [DOI] [PubMed] [Google Scholar]
- 45.Lin SL, Chang DC, Chang-Lin S, et al. Mir-302 reprograms human skin cancer cells into a pluripotent ES-cell-like state. RNA. 2008;14:2115–2124. doi: 10.1261/rna.1162708. [DOI] [PMC free article] [PubMed] [Google Scholar]
- 46.Wang J, Rao S, Chu J, et al. A protein interaction network for pluripotency of embryonic stem cells. Nature. 2006;444:364–368. doi: 10.1038/nature05284. [DOI] [PubMed] [Google Scholar]
Associated Data
This section collects any data citations, data availability statements, or supplementary materials included in this article.


