

Abstract
We aimed to characterize levels of polyfluorinated compounds (PFCs) in indoor dust from offices, homes, and vehicles; to investigate factors that may affect PFC levels in dust; and to examine the associations between PFCs in dust and office workers’ serum. Dust samples were collected in 2009 from offices, homes, and vehicles of 31 individuals in Boston, MA and analyzed for nineteen PFCs, including perfluorooctanoate (PFOA), perfluorooctane sulfonate (PFOS), fluorotelomer alcohols (FTOHs), and sulfonamidoethanols (FOSEs). Serum was collected from each participant and analyzed for eight PFCs including PFOA and PFOS. Perfluorononanoate, PFOA, perfluoroheptanoate, perfluorohexanoate, PFOS and 8:2 FTOH had detection frequencies >50% in dust from all three microenvironments. The highest geometric mean concentration in office dust was for 8:2 FTOH (309 ng/g), while PFOS was highest in homes (26.9 ng/g) and vehicles (15.8 ng/g). Overall, offices had the highest PFC concentrations, particularly for longer-chain carboxylic acids and FTOHs. Perfluorobutyrate was prevalent in homes and vehicles, but not offices. PFOA serum concentrations were not associated with PFC dust levels after adjusting for PFC concentrations in office air. Dust concentrations of most PFCs are higher in offices than in homes and vehicles. However, indoor dust may not be a significant source of exposure to PFCs for office workers. This finding suggests that our previously published observation of an association between FTOH concentrations in office air and PFOA concentrations in office workers was not due to confounding by PFCs in dust.
Keywords: Polyfluorinated compounds, PFCs, dust, exposure assessment, offices, homes
1. Introduction
Polyfluorinated compounds (PFCs) are used in a variety of commercial applications due to desirable properties such as water and oil repellency, thermal stability, and resistance to biotic, chemical or mechanical degradation. Since the 1940s, PFCs have been used in applications such as fire-fighting foams and pesticides, in the production of protective sprays and coatings for fabrics, carpets, and clothing, and more recently in food-contact paper and non-stick cookware (Kissa, 2001; Prevedouros et al., 2006). In fact, their widespread use is such that PFCs have been detected in wildlife, humans, water, air and soil (Barber et al., 2007; Kato et al., 2011; Lau et al., 2007; Prevedouros et al., 2006; Rumsby et al., 2009; Shoeib et al., 2006; Strynar et al., 2012). Low-level body burdens of some PFCs, such as perfluorooctanoate (PFOA) and perfluorooctane sulfonate (PFOS), are ubiquitous in the general human population and raise concern about the potential toxicity of these persistent organic pollutants (Kato et al., 2011; Lau et al., 2007).
Animal studies have identified PFOA and PFOS to be potent peroxisome proliferators that are associated with liver toxicity, developmental delays, immune system effects and endocrine disruption (DeWitt et al., 2009; Jensen and Leffers, 2008; Lau et al., 2007). Emerging epidemiologic research suggests that PFOA and PFOS may be associated with lowered birth weight (Apelberg et al., 2007; Fei et al., 2007; Stein et al., 2009), increased cholesterol (Nelson et al., 2010; Steenland et al., 2009), and attention deficit hyperactivity disorder (ADHD) (Hoffman et al., 2010; Stein and Savitz, 2011). Almost no data exist on the toxicity of other PFCs including longer-chain length (>C8) PFCs and a multitude of precursor compounds such as fluorotelomer alcohols (FTOHs), fluorinated sulfonamides (FOSAs) and sulfonamidoethanols (FOSEs).
Over the past few years, research examining PFC exposure pathways has increased dramatically with detectable levels being found in indoor air (Barber et al., 2007; Haug et al, 201lb; Shoeib et al., 2005 and 2011), indoor dust (Björklund et al., 2009; Goosey and Harrad 2011; Kato et al., 2009; Strynar and Lindstrom, 2008), and foods such as meat, fish, and dairy products (Ericson et al., 2008; Tittlemier et al., 2007). Still, it remains largely unclear whether ingestion of contaminated food and water, inhalation of indoor and ambient air, ingestion of indoor dust, or direct contact with PFC-containing consumer products is the largest contributor to human body burdens of PFCs. The majority of previous exposure studies have focused on PFOA and PFOS in dust and diet, estimating that dietary sources dominate exposure in adults except in some worst-case scenario estimates that use a high dust ingestion factor and maximum PFC dust concentrations (Björklund et al., 2009; Egeghy and Lorber, 2011; Lorber and Egeghy, 2011; Zhang et al., 2010). However, the true contribution of different exposure pathways to PFC body burdens remains unclear due to limited data on adult dust ingestion rates, absorption capacities, PFCs levels in indoor air, and PFCs levels in the air and dust of places where people spend significant amounts of time other than their homes (e.g., offices). Additionally, and importantly, the role of precursor compounds such as FTOHs, FOSAs and FOSEs in either air or dust has yet to be adequately assessed.
Accordingly, the primary objective of this study was to address these gaps by building on our previous work in which we found that concentrations of FTOHs in indoor air were particularly high in offices of a newly constructed building and significantly associated with serum PFOA (Fraser et al., 2012). In the current paper, we report on PFC concentrations in the dust of those same offices as well as in dust collected from the homes and vehicles of the same participants. We assess the relationships between PFC dust concentrations in these three microenvironments and levels of PFCs in the office workers’ serum. Lastly, we compare exposure to FTOHs via office dust and office air with respect to their ability to predict concentrations of PFOA and perfluorononanoate (PFNA) in the office workers’ serum.
2. Materials and Methods
2.1. Study Design
We recruited a convenience sample of 31 office workers who live and work in the greater Boston, MA area. Participants were 90% white, 84% female and ranged in age from 25 to 64 years. Dust samples were collected from each participant’s home, office, and vehicle (where available), while indoor air samples were collected from offices only. The field investigation also included the collection of a blood sample and administration of a questionnaire to gather information on demographics, microenvironment characteristics (including information about renovations), time spent in different microenvironments, and diet. All samples were collected between January and March of 2009.
Study participants worked in separate offices that were located throughout seven buildings, which were categorized into three groups: Building A (n=6), Building B (n=17), and Other (n=8). Building A was newly built approximately one year before the study began and contained new carpeting throughout hallways and offices, as well as new upholstered furniture in each of the offices. Building B was partially renovated approximately one year before the study began, including the installation of new carpeting throughout hallways and in approximately 10% of offices. The five remaining buildings (Other building category) were not known to have undergone recent renovation. All offices contained four solid walls and a door that was closed each evening. Two-thirds of offices contained at least one window and the average office size was 38 m2. No two participants shared an office.
Air samples were collected from the 31 offices during a four-day period between Monday at 8 AM and Friday at 8 AM using an active air sampling pump and polyurethane foam (PUF)/XAD-2 cartridges. A detailed description of the methods for the collection and analysis of office air samples were reported previously (Fraser et al., 2012).
On the last day of air sampling and after removal of air sampling equipment, dust was collected from each of the offices and a blood sample was collected from each participant by a trained phlebotomist. Arrangements were made through each building’s facilities management office to ensure that study offices were not vacuumed during the sampling week. Participants were also asked not to dust or vacuum their homes and vehicles for at least one week prior to the home sampling visit, which occurred either mid-week during the sampling period or, occasionally, during the following week. Informed consent was obtained from each participant prior to data collection and the study was approved by the Boston University Medical Center’s Institutional Review Board. The involvement of the Centers for Disease Control and Prevention (CDC) and the U.S. Environmental Protection Agency (EPA) laboratories were determined not to constitute engagement in human subjects research.
2.2. Dust Sampling
The dust sampling media consisted of a cellulose extraction thimble (Whatman International) inserted between the crevice tool and vacuum tube extender of a Eureka Mighty-Mite vacuum cleaner (Allen et al., 2008). Offices and the main living area of homes were vacuumed for approximately 10 minutes, covering the entire floor surface area including accessible floor space under desks and the tops of immovable furniture. Vehicles were also vacuumed for approximately 10 minutes, covering the entire surface area of the front and back seats. Vehicle floorboards and dashboards were not vacuumed. A total of 12 dust field blanks (six from offices and six from homes) were collected using sodium sulfate powder as a surrogate for dust.
After vacuuming, sample thimbles were removed, wrapped in aluminum foil, sealed in polyurethane zip-lock bags, and stored at room temperature for an average of 2 months until sieving. Dust samples were sieved to a particle size of <500 μm, placed in clean amber glass jars, and stored at -20°C until they were shipped to the National Exposure Research Laboratory at the U.S. EPA for analysis.
2.3. Analysis of Dust Samples
Approximately 50 mg of each dust sample were sonic extracted with methanol and centrifuged to pelletize the dust. The supernatant was passed through a 3cc Supelclean ENVI-Carb 250 mg phase cartridge (Supelco, Bellefonte, PA) that was pre-treated with 5 mL of methanol (2×). The eluate was captured and evaporated to approximately 0.5 mL and prepared for ultra performance liquid chromatography tandem mass spectrometry (UPLC/MS/MS) analysis by mixing the methanolic extract with 2 mM ammonium acetate at a 60:40 ratio. Analytical batches consisted of method blanks, solvent blanks, QA/QC samples (NIST SRM 2583), calibration curve samples, and unknown samples. All samples underwent the same extraction procedure.
Analytes included 3 perfluorinated sulfonates (perfluorobutane sulfonate [PFBS], perfluorohexane sulfonate [PFHxS], and PFOS) and 9 perfluorinated carboxylates (C4 – C12: perfluorobutyrate [PFBA], perfluoropentanoate [PFPeA], perfluorohexanoate [PFHxA], perfluoroheptanoate [PFHpA], PFOA, PFNA, perfluorodecanoate [PFDA], perfluoroundecanoate [PFUnA], and perfluorododecanoate [PFDoA]). In addition, samples were analyzed for fluorotelomer alcohols (6:2, 8:2 and 10:2 FTOH), FOSE alcohols (N-Me FOSE and N-Et FOSE), and C13 (perfluorotridecanoate [PFTrDA]) and C14 (perfluorotetradecanoate [PFTeDA]) carboxylic acids using the same extraction procedure as above with the following differences. Samples were prepared 80:20 (methanol:2 mM ammonium acetate) and analyzed via high performance liquid chromatography time-of-flight mass spectrometry (HPLC/TOFMS).
Samples were analyzed for C4-C12, PFBS, PFHxS, and PFOS using a Waters Acquity UPLC interfaced with a Quatro Premier XE triple quadruple mass spectrometer (Waters Corp. Milford, MA). Samples were analyzed for the remaining analytes (FTOHs, FOSE alcohols, PFTrDA, and PFTeDA) using an Agilent 1100 HPLC interfaced with an Agilent 6200 TOF-MSD (Agilent Technologies, Palo Alto, CA). Additional details of dust sample extraction and analysis are available in Supplemental Material.
2.4. Analysis of Serum Samples
After clotting and centrifugation, serum was recovered from whole blood and stored in polypropylene cryovials at -80°C before being shipped on dry ice to CDC for analysis. PFCs (PFOA, PFNA, PFDA, PFHxS, PFOS, perfluorooctane sulfonamide [PFOSA], methyl perfluorooctane sulfonamidoacetate [N-MeFOSAA], and ethyl perfluorooctane sulfonamidoacetate [N-EtFOSAA]) were measured using a modification of a published method based on a solid phase extraction (SPE) system linked directly on-line with HPLC-isotope dilution-MS/MS (Kuklenyik et al., 2005). Additional details are available in Supplemental Material.
2.5. Statistical Analyses
PFC concentrations in air were blank-corrected using the mean of three field blanks, as previously described (Fraser et al, 2012). The method detection limit (MDL) for each analyte in air was defined as three times the standard deviation of the field blanks except for EtFOSE (not detected in any of the three blanks) in which case the MDL was defined as the limit of quantitation (LOQ) reported by the analytical laboratory, which is the lowest point on the calibration curve able to predict +/- 30% of the theoretical analyte concentration prepared. All dust field blanks were less than the LOQ for all PFCs measured. Therefore, no blank correction was needed for dust samples and the MDL for each analyte was defined as the LOQ reported by the analytical laboratory (Table 1). All PFC values measured below the MDL in air samples, below the LOQ in dust samples, or below the limit of detection (LOD) in serum samples were replaced by the MDL/LOQ/LOD divided by the square root of two for statistical analyses.
Table 1.
Summary statistics of PFCs in indoor dust (ng/g).
| Analyte | LOQ | Office (n=31) | Home (n=30) | Vehicle (n=13) | |||||||||
|---|---|---|---|---|---|---|---|---|---|---|---|---|---|
|
| |||||||||||||
| % detect | GM | (GSD)a | Rangeb | % detect | GM | (GSD) | Rangeb | % detect | GM | (GSD)a | Rangeb | ||
| PFTeDA | 5 | 71 | 18.6 | (4.0) | 9.35 - 367 | 3 | † | † | 11.2 - 11.2 | 8 | † | † | 14.3 - 14.3 |
| PFTrDA | 5 | 58 | 21.6 | (6.2) | 8.67 - 768 | 3 | † | † | 10.3 - 10.3 | 0 | † | † | <LOQ - <LOQ |
| PFDoA | 5 | 87 | 40.0 | (4.4) | 6.56 - 481 | 23 | † | † | 5.09 - 13.3 | 77 | 6.76* | (1.7) | 4.96 - 24.6 |
| PFUnA | 8 | 52 | 19.0 | (4.1) | 9.22 - 373 | 7 | † | † | 10.8 - 39.4 | 15 | † | † | 5.24 - 6.30 |
| PFDA | 5 | 97 | 46.5 | (3.7) | 5.30 - 492 | 43 | † | † | 6.97 - 26.8 | 69 | 8.40* | (2.5) | 5.42 - 70.1 |
| PFNA | 5 | 94 | 63.0 | (3.6) | 10.9 - 639 | 67 | 10.9* | (3.7) | 6.21 - 1420 | 85 | 14.7* | (3.3) | 4.95 - 101 |
| PFOA | 5 | 74 | 32.0 | (4.4) | 15.8 - 336 | 77 | 23.7 | (4.4) | 5.71 - 894 | 54 | 11.4* | (3.2) | 21.4 - 58.4 |
| PFHpA | 5 | 97 | 27.6 | (3.3) | 6.50 - 388 | 80 | 12.0* | (3.4) | 4.93 - 586 | 69 | 8.48* | (2.2) | 4.98 - 36.6 |
| PFHxA | 5 | 68 | 10.8 | (3.1) | 5.06 - 102 | 57 | 8.65 | (3.7) | 4.85 - 1380 | 54 | 5.92 | (1.8) | 5.03 - 18.2 |
| PFPeA | 5 | 39 | † | † | 5.95 - 27.5 | 33 | † | † | 5.39 - 249 | 23 | † | † | 7.57 - 17.8 |
| PFBA | 5 | 48 | † | † | 5.06 - 148 | 90 | 13.9 | (3.0) | 4.89 - 999 | 85 | 11.5 | (3.2) | 5.19 - 240 |
| PFOS | 7 | 55 | 14.6 | (3.2) | 6.80 - 98.2 | 73 | 26.9 | (3.7) | 14.1 - 280 | 54 | 15.8 | (4.6) | 10.1 - 280 |
| PFHxS | 5 | 23 | † | † | 5.24 - 18.5 | 40 | † | † | 6.05 - 430 | 46 | † | † | 5.22 - 108 |
| PFBS | 5 | 10 | † | † | 8.25 - 12.0 | 3 | † | † | 4.98 - 4.98 | 0 | † | † | <LOQ - <LOQ |
| 6:2 FTOH | 50 | 35 | † | † | 90.6 - 2390 | 0 | † | † | <LOQ - <LOQ | 8 | † | † | 243 - 243 |
| 8:2 FTOH | 5 | 100 | 309 | (4.2) | 15.7 - 3390 | 57 | 10.8* | (3.2) | 9.19 - 136 | 69 | 11.3* | (2.7) | 8.50 - 82.4 |
| 10:2 FTOH | 5 | 90 | 210 | (5.8) | 12.2 - 2050 | 13 | † | † | 12.4 - 46.4 | 8 | † | † | 63.4 - 63.4 |
| MeFOSE | 5 | 19 | † | † | 11.0 - 113 | 43 | † | † | 18.0 - 488 | 31 | † | † | 8.87 - 23.1 |
| EtFOSE | 5 | 0 | † | † | <LOQ - <LOQ | 7 | † | † | 12.2 - 3280 | 0 | † | † | <LOQ - <LOQ |
Geometric mean and standard deviation calculated by replacing values <LOQ (limit of quantitation) with LOQ/√2.
Range of detected values (not log-transformed).
Values not reported due to low percentage of detection (<50%).
Signifies p < 0.05 for difference from office category in univariate regression.
Due to a malfunctioning pump timer, office air samples were only analyzed for 30 of the 31 offices. Additionally, the number of home dust samples was reduced to 30 because one participant lived in a boarding house without a main living area. The number of vehicles sampled was 20, but a sufficient mass of dust for analysis of PFCs was available from only 13 vehicles.
Concentrations of PFCs in air, dust, and serum were log-normally distributed and were natural log-transformed prior to analysis as dependent variables in regression analyses, in Pearson correlations, and in principle components analysis (PCA). Analyses included univariate descriptive statistics of individual PFCs in the dust of each microenvironment, Pearson correlations between individual PFCs in dust within microenvironments, between individual PFCs in office air and dust, and between individual PFCs in dust and serum. Scatter plots were examined for associations and identification of outliers. To further assess correlation among PFCs, principle components analysis (PCA) was also performed on PFC analytes in office dust using a variance maximizing rotation (rotate = varimax) to extract components that explained 5% or more of the total variance.
Simple and multiple linear regressions were performed to a) examine office, home, and building characteristics as predictors of individual PFC concentrations in dust, b) examine individual PFC concentrations in dust as predictors of individual PFC concentrations in serum, and c) examine FTOH concentrations (individually and combined using PCA) in both office air and dust as predictors of concentrations of PFOA and PFNA in serum. When assessing PFC concentrations in dust as predictors of PFC concentrations in serum, outliers were identified by visual inspection of scatter plots and their potential influence was assessed by conducting regression analyses both with and without the outlier(s). In addition, PFC concentrations in dust were assessed continuously as well as in tertiles, which limit the potential influence of extreme values.
Independent variables examined in regression analyses as predictors of PFC levels in dust included building category, time spent in the office, office flooring type, age of home, number of residents, new carpeting, use of carpet or furniture stain protection, use of waterproofing sprays, main living area flooring type, carpet square footage, housing type, heat type, vehicle age, vehicle make, vehicle interior type, and time spent in the vehicle. Of the thirteen vehicles, only one had leather seats while the rest had cloth seats. In assessing vehicle age, vehicle make, and time spent in vehicle as predictors of PFC levels in dust, the vehicle with leather seats was excluded.
Statistical analyses were performed using SAS statistical software package, version 9.1, and statistical significance was tested with α = 0.05. Exponentiation of regression coefficients yields the multiplicative change in the outcome per unit of predictor variable.
3. Results
3.1. PFC concentrations by microenvironment
Table 1 presents the geometric means (GM), geometric standard deviations, and ranges of 19 PFCs measured in the dust of offices, homes and vehicles. Only six PFCs were detected in >50% of samples collected from all three microenvironments: PFNA, PFOA, PFHpA, PFHxA, PFOS, and 8:2 FTOH. In univariate regression, GM concentrations of PFNA (63.0 ng/g), PFHpA (27.6 ng/g), and 8:2 FTOH (309 ng/g) in dust from offices were significantly higher than concentrations in the dust of both homes and vehicles. The GM concentration of PFOA in office dust (32.0 ng/g) was significantly higher than in vehicle dust (11.4 ng/g) and higher but not significantly different from the GM concentration of PFOA in house dust (23.7 ng/g). Concentrations of PFOS in dust were highest in homes but did not vary significantly between homes (GM=26.9 ng/g), offices (GM=14.6 ng/g), and vehicles (GM=15.8 ng/g). Concentrations of PFHxA in dust were also not found to vary significantly by microenvironment, although the highest GM concentration of PFHxA was observed in office dust (GM = 10.8 ng/g).
Seven other PFCs were detected in >50% of samples for at least one microenvironment: PFTeDA, PFTrDA, PFDoA, PFUnA, PFDA, PFBA and 10:2 FTOH. Of these, all but PFBA were found in offices in much higher concentrations and with much more frequency than in the dust of either homes or vehicles. PFBA was the exception, as it was detected in 90% and 85% of homes and vehicles, respectively, but in only 48% of offices. Six compounds were detected in less than 50% of samples in all three microenvironments: PFPeA, PFHxS, PFBS, 6:2 FTOH, MeFOSE, and EtFOSE.
3.2. Correlations among PFCs in dust
To assess relationships between different PFC analytes in dust, we performed principle components analysis (PCA) on compounds detected in >50% of samples for each microenvironment. For the twelve PFCs measured in office dust, PCA revealed three factors that together explained 87% of the variability in PFC concentrations: Factor 1 (PFTeDA, PFTrDA, PFDoA, PFDA, PFNA, PFHpA), Factor 2 (PFUnA, PFOA, PFHxA, PFOS), and Factor 3 (8:2 FTOH, 10:2 FTOH). The seven analytes measured in house dust loaded onto four factors that together explained 95% of the variability in PFC concentrations in this microenvironment: Factor 1 (PFOA, PFHxA, PFOS), Factor 2 (PFNA, PFBA), Factor 3 (PFHpA, PFHxA, PFBA), and Factor 4 (8:2 FTOH). The nine analytes measured in vehicle dust also loaded onto four factors, explaining 93% of variability in PFC concentrations in vehicles: Factor 1 (PFDA, PFNA, PFHpA, PFBA), Factor 2 (PFOA, PFHxA, PFOS), Factor 3 (8:2 FTOH), and Factor 4 (PFDoA).
Pearson correlations of natural log-transformed PFC concentrations within each microenvironment were consistent with PCA factor loadings. Longer-chain carboxylic acids (PFNA-PFTeDA) generally correlated with one another. 8:2 and 10:2 FTOHs were highly correlated in offices (r=0.97). PFOA and PFOS were moderately correlated in office dust (r=0.65) and more strongly correlated in home (r=0.83) and vehicle (r=0.90) dust; PFOA and PFOS were also highly correlated with PFHxA in each microenvironment and PFUnA in offices. In homes and vehicles, PFBA was correlated with PFNA (r=0.68-0.85). For all correlation results, see Supplemental Material, Tables 1-3.
3.3. Predictors ofPFCs in dust
Office building category was a significant predictor of FTOH concentrations in dust (Figure 1). Compared to the Other building category, levels of 8:2 FTOH and 10:2 FTOH were significantly higher in buildings A (newly built) and B (recently renovated). Concentrations were not significantly different between buildings A and B, though Building A had the highest FTOH GM concentrations, which were 694 ng/g of 8:2 FTOH and 522 ng/g of 10:2 FTOH compared to 418 and 326 ng/g, respectively, in Building B.
Figure 1.
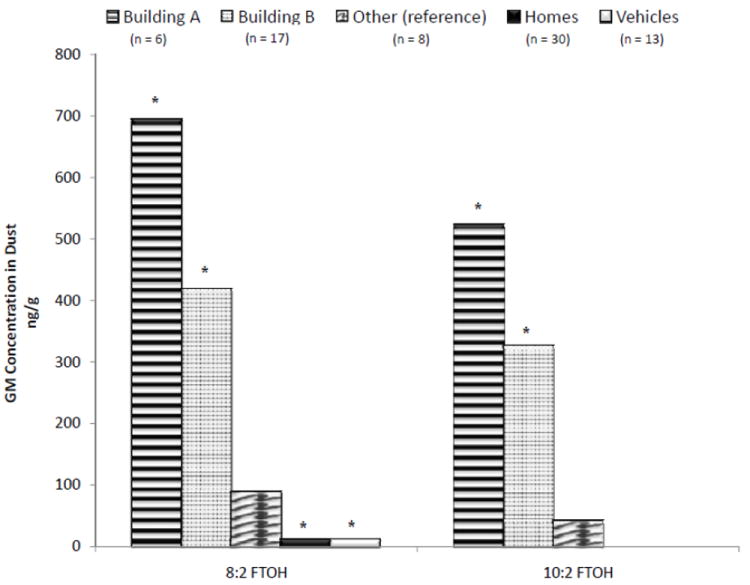
Fluorotelomer alcohols in the dust of office buildings, homes, and vehicles. Asterisk (*) signifies p < 0.05 for difference from reference group in univariate regression.
In contrast to FTOHs, concentrations of almost every other PFC measured were found to be lowest in Building A dust, though not all comparisons were statistically significant (data not shown). The exception is PFOA, which was not found to vary significantly between buildings.
Other potential predictors of PFC concentrations in office dust included average time spent in the office each week and carpet floor covering. Time spent in office, which could be related to disturbance of dust reservoirs and/or room ventilation, was negatively associated with dust concentrations of PFTeDA (β=-0.07; p=0.007), PFTrDA (β=-0.07; p=0.04), and PFDoA (β=-0.06; p=0.01). Given the small number of tiled floors (n=2), our assessment of carpeting as a predictor of PFCs in dust is inconclusive and requires follow-up: the 29 carpeted offices had significantly higher concentrations of PFDoA (~ 9 times higher), 8:2 FTOH (~16 times higher) and 10:2 FTOH (~40 times higher) as compared to the two offices with tiled floors.
Again due to small numbers, we had a limited ability to assess most potential predictors of PFCs in house and vehicle dust. However, we did observe that PFC concentrations were generally higher in dust from homes with more than three residents and with carpeted living rooms, though these differences were not statistically significant (data not shown). There was a negative association between time spent in the vehicle (modeled as hours per week) and dust concentrations of PFOS (p=0.03) and PFOA (p=0.06). In looking at age of vehicle, we found that older vehicles had significantly higher concentrations of PFOA and PFOS. Specifically, compared to model years 2004 to 2007 (n=5), vehicles with model years 1995 to 2001 (n=7) had concentrations of PFOA that were 4.4 times higher (p=0.02) and concentrations of PFOS that were 8.8 times higher (p=0.007).
For frequency information of the office, home, and vehicle characteristics that were evaluated as potential predictors of PFCs in dust, see Supplemental Material, Table 4.
Pearson correlations between PFCs in office dust and office air revealed that fluorotelomers in the two media were correlated with r-values ranging from 0.43 to 0.53 (p<0.05). Scatter plots of the associations between 8:2 FTOH and 10:2 FTOH in air and dust are available as Supplemental Material, Figures 1 and 2. Air samples were not analyzed for PFOA and other ionic PFCs (Fraser et al., 2012). However, fluorotelomer levels in office air were not associated with PFOA levels in office dust. Pearson’s r-values for the associations between PFOA in dust and 8:2 FTOH and 10:2 FTOH in air were 0.21 and 0.28, respectively.
3.4. PFCs in dust as predictors of PFCs in serum
Serum PFC concentrations among the 31 office workers in this study are reported elsewhere (Fraser et al., 2012) and were consistent with serum PFC concentrations of white females in the general U.S. population (Kato et al., 2011). PFCs in dust were assessed as predictors of PFCs in serum as continuous variables (Tables 2 and 3) and as tertiles. Dust concentrations of PFCs from offices, homes, and vehicles were not significantly predictive of PFCs in workers’ serum when modeled continuously. Of the few associations having significant (<0.05) or borderline significant (0.05-0.10) p-values, all were shown to be driven by outliers both in terms of scatter plot examination and model results (Tables 2 and 3). An interesting exception was the analysis of PFNA in house dust as a predictor of PFNA in workers’ serum in which removal of an outlying data point reduced the p-value of the results from 0.82 to 0.13. In the tertile analysis, which is less sensitive to outliers, PFNA in house dust was significantly predictive of serum PFNA (β=0.41 for high versus low, p=0.02; and (β=0.32 for medium versus low, p=0.06). Tertile analyses of the other PFCs in dust and corresponding PFC analytes in workers’ serum were null (not shown). Thus, with the possible exception of PFNA, there was little evidence for associations between PFCs in dust and serum.
Table 2.
Univariate associations between PFOA, PFNA and PFDA in office workers’ serum and PFCs in dust.
| Dust Analyte (ng/g) | n | lnPFDAa β (p-value) |
lnPFNAa β (p-value) |
lnPFOAa β (p-value) |
|||
|---|---|---|---|---|---|---|---|
| PFDA | |||||||
| Office | 31 | -0.0004 | (0.59) | -0.0001 | (0.80) | -0.0008 | (0.30) |
| Vehicle | 13 | 0.0013 | (0.91) | 0.0058 | (0.43) | 0.0170 | (0.06) |
| excluding outlier | 12 | 0.0300 | (0.23) | ||||
| PFNA | |||||||
| Office | 31 | - | - | 0.0002 | (0.72) | -0.0007 | (0.34) |
| Home | 30 | - | - | 0.0001 | (0.82) | 0.0002 | (0.55) |
| excluding outlier | 29 | 0.0050 | (0.13) | ||||
| Vehicle | 13 | - | - | 0.0040 | (0.27) | 0.0077 | (0.11) |
| PFOA | |||||||
| Office | 31 | - | - | - | - | -0.0002 | (0.88) |
| Home | 30 | - | - | - | - | 0.0013 | (0.01) |
| excluding outliers | 28 | - | - | - | - | 0.0019 | (0.46) |
| Vehicle | 13 | - | - | - | - | -0.0032 | (0.75) |
| 8:2 FTOH | |||||||
| Office | 31 | - | - | 0.0001 | (0.58) | 0.0002 | (0.17) |
| Home | 30 | - | - | -0.0009 | (0.72) | 0.0020 | (0.55) |
| Vehicle | 13 | - | - | 0.0070 | (0.25) | 0.0116 | (0.16) |
| 10:2 FTOH | |||||||
| Office | 31 | 0.0001 | (0.54) | 0.0001 | (0.43) | 0.0002 | (0.28) |
Exponentiation of β = the multiplicative increase in PFC per unit change in predictor variable (e.g., β = 0.0013 is a 0.13% increase in serum PFC per ng/g increase in PFC dust concentration.
Table 3.
Univariate associations between PFOS and PFHxS in office workers’ serum and PFOS in dust.
| Dust Analyte (ng/g) | n | lnPFOSa β (p-value) |
lnPFHxSa β (p-value) |
|---|---|---|---|
| PFOS | |||
| Office | 31 | -0.0035 (0.31) | -0.0052 (0.31) |
| Home | 30 | 0.0007 (0.69) | 0.0048 (0.03) |
| excluding outlier | 29 | 0.0020 (0.43) | |
| Vehicle | 13 | -0.0004 (0.90) | 0.0007 (0.82) |
Exponentiation of β = the multiplicative increase in PFC per unit change in predictor variable (e.g., β = 0.0013 is a 0.13% increase in serum PFC per ng/g increase in PFC dust concentration.
3.5. PFCs in office air and dust as determinants of PFCs in serum
Previously, we reported that FTOH levels in office air were significantly predictive of PFOA in workers’ serum (Fraser et al., 2012). This was true for both individual FTOHs in air and FTOHs combined (6:2, 8:2, and 10:2 FTOH) using PCA. In this paper, we wanted to assess the possibility that FTOHs in dust may be confounding the association between FTOHs in air and PFOA in office workers’ serum (or vice-versa) because FTOH concentrations in the two media are moderately correlated with Pearson r-values ranging from 0.43 to 0.53 (p<0.05) (see Supplemental Material, Figures 1 and 2, for scatter plots of 8:2 FTOH and 10:2 FTOH concentrations in office air versus office dust). We were also interested in performing a parallel analysis of FTOHs in dust using PCA. Accordingly, Table 4 presents results of the following predictive models of PFOA and PFNA in workers’ serum: a) univariate models of FTOHs in office air, b) univariate models of FTOHs in office dust, and c) multivariate models of FTOHs in office air and dust together. We examine FTOHs separately and combined using PCA. For consistency across air and dust analyses, the PCA factor for FTOHs in air was recreated without inclusion of 6:2 FTOH, which was detected in only 35% of dust samples and was not included in further dust analyses of PFCs. This change had a negligible effect on results from our previously published analysis of FTOHs in air and serum PFCs (Fraser et al., 2012).
Table 4.
FTOHs in office air and dust as predictors of PFOA and PFNA in office workers’ serum.
| Models | n | lnPFOAa β (p-value) |
lnPFNAa β (p-value) |
|---|---|---|---|
| Univariate: Air models | |||
| 8:2FTOH(pg/m3) | 30 | 0.000011 (0.02) | 0.000004 (0.24) |
| 10:2FTOH(pg/m3) | 30 | 0.000065 (0.01) | 0.000024 (0.25) |
| PCA factor for FTOHsb | 30 | 0.30 (0.0008) | 0.12 (0.11) |
|
| |||
| Univariate: Dust models | |||
| 8:2FTOH(ng/g) | 31 | 0.000182 (0.17) | 0.000056 (0.58) |
| 10:2FTOH(ng/g) | 31 | 0.000212 (0.28) | 0.000115 (0.43) |
| PCA factor for FTOHsb | 31 | 0.23 (0.01) | 0.13 (0.06) |
|
| |||
| Multivariate: Air and dust | |||
| 8:2 FTOH | 30 | ||
| Air (pg/m3) | 0.000011 (0.06) | 0.000005 (0.32) | |
| Dust (ng/g) | 0.000023 (0.88) | -0.000006 (0.96) | |
| 10:2 FTOH | 30 | ||
| Air (pg/m3) | 0.000073 (0.03) | 0.000022 (0.39) | |
| Dust (ng/g) | -0.000092 (0.69) | 0.000016 (0.93) | |
| PCA factors for FTOHsb | 30 | ||
| Air factor | 0.25 (0.02) | 0.06 (0.51) | |
| Dust factor | 0.08 (0.41) | 0.09 (0.29) | |
Exponentiation of β = the multiplicative increase in PFC per unit change in predictor variable (e.g., β = 11 × 10-6 is a 1.1% increase in serum PFOA per ng/m3 increase of 8:2 FTOH in air).
Air concentrations were log-transformed prior to PCA making interpretation difficult for β-coefficients of the PCA factors.
As was previously found (Fraser et al., 2012), air concentrations of FTOHs (both individually and combined by PCA), were significant predictors of workers’ serum concentrations of PFOA (Table 4). Dust concentrations of FTOHs, when assessed as individual compounds, were not significantly predictive of workers’ serum PFC concentrations. When assessed together using the PCA factor, though, FTOH concentrations in dust were significantly predictive of PFOA in workers’ serum and of borderline significance for predicting PFNA in workers’ serum. Interestingly, however, when the PCA factor for FTOHs in air and the PCA factor for FTOHs in dust were included in a model together, the associations between FTOHs in dust and workers’ serum PFCs were no longer observed. In contrast, the association between FTOHs in air and workers’ serum PFOA remained relatively stable in the combined model (Table 4).
As shown in Table 4, when modeled separately, the PCA factor for FTOHs in dust was marginally predictive of serum PFNA (p=0.06), and the PCA factor for FTOHs in air was not significantly predictive of serum PFNA (p=0.11), although both (β-estimates were similar. Multivariate analysis does not clearly indicate which may be more important.
4. Discussion
Previous studies have examined concentrations of PFCs in indoor dust, mostly focusing on homes, but with some attention to day care centers, offices and vehicles (Beesoon et al., 2011; Björklund et al., 2009; De Silva et al., 2012; D’Hollander et al., 2010; Ericson Jogsten et al., 2012; Fromme et al., 2008; Goosey and Harrad, 2011; Haug et al., 201lb; Kato et al, 2009; Kubwabo et al., 2005; Nakata et al., 2007; Shoeib et al., 2005 and 2011; Strynar and Lindstrom, 2008; Zhang et al., 2010). However, this study is the first to report on levels of PFCs in the dust of offices and vehicles in North America. Only a Norwegian study has previously assessed concurrent measures of PFCs in indoor air, dust, and serum (Haug et al, 2011a). Therefore, the results provide a unique opportunity to empirically examine the importance of exposure to PFCs in different environmental media (air and dust) and in different microenvironments (offices, homes and vehicles) in the US.
4.1. Comparison between microenvironments
In comparing PFC concentrations across microenvironments, we found that longer-chain (>C8) perfluorinated carboxylates (PFCAs) and FTOHs were present in higher levels (and more frequently) in the dust of offices compared to homes and vehicles. These differences were not driven solely by concentrations in any one office building. Though FTOH levels were highest in Building A and concentrations of the longer-chain carboxylic acids were highest in the Other building category, concentrations were higher for Building B compared to homes and vehicles, as well. We could find no other published reports of FTOH concentrations in office dust and only one other study reporting any longer-chain PFCs in office dust. D’Hollander et al. (2010) assessed PFNA and PFDA (along with other shorter-chain PFCs) in Belgian offices, finding that median concentrations were slightly higher in offices compared to homes, but the levels reported for all PFCs in the study were much lower than those observed here. Thus, additional research is needed to evaluate the consistency of our findings in offices with regards to relatively high concentrations of long-chain carboxylic acids and FTOHs.
Three studies have examined PFOA and PFOS in offices: Zhang and colleagues (2010) examined 11 offices in China in 2009, Björklund et al. (2009) examined 10 offices in Sweden from 2006-2007, and Goosey and Harrad (2011) sampled 20 offices in the United Kingdom between 2007 and 2009. Levels of PFOA found in offices in our study were lower than those measured in the other studies while levels of PFOS in our study were somewhat higher than those of the Chinese offices, but much lower than the Swedish and UK offices. In all three studies, concentrations of PFOA and PFOS were found to be higher in offices than in homes. In our study, however, PFOS levels were higher in the dust of homes than in offices and PFOA concentrations did not differ significantly between the two microenvironments. These differences could represent geographical variation in PFC concentrations, variation across office buildings in general, or differences in sampling methods (Allen et al., 2008; Harrad et al., 2010). For instance, the Chinese study did not sieve dust prior to analysis and the Swedish dust samples were collected from surfaces approximately one meter above the floor.
Levels of PFCs in house dust have received a bit more attention, including three Canadian studies—one that analyzed for sulfonamide compounds (Shoeib et al., 2005), one that looked for PFOA, PFOS, and PFHxS (Kubwabo et al., 2005), and one that examined both the neutral and ionic PFCs, including FTOHs, FOSA/FOSE, PFOS, and C6-C13 perfluoroalkyl carboxylates (Shoeib et al., 2011). There is also a study of 102 homes (and 10 day cares) in Ohio and North Carolina that analyzed for a suite of 13 PFCs including long-chain carboxylic acids (Strynar and Lindstrom, 2008). All four studies examined dust from home vacuum bags, which was sieved to 150 microns. As for the sulfonamides, neither MeFOSE nor EtFOSE were detected in greater than 50% of samples in any of the three microenvironments in the current study, which is unexpected considering that Shoeib and colleagues (2005) detected both compounds in 100% of dust samples collected in 2002-2003 from homes in Ottawa (n=66). Shoeib and colleagues (2011) again had high detection frequencies of MeFOSE (100%) and EtFOSE (97%) in dust samples collected in 2007-2008 from homes in Vancouver (n=132). The GM MeFOSE concentration of samples in the Canadian homes ranged from 113 ng/g (Ottawa, 2002-2003) to 51 ng/g (Vancouver, 2007-2008), compared to 35.4 ng/g for the 43% of samples with detectable levels in the present study (Boston, 2009). The GM concentration of EtFOSE in the Canadian homes ranged from 138 ng/g (Ottawa, 2002-2003) to 8.5 ng/g (Vancouver, 2007-2008), compared to the GM of the two detected samples in the present study, 200 ng/g (Boston, 2009). Differences between the studies may reflect temporal changes in sulfonamide concentrations in dust since withdrawal of such compounds from the market around 2001.
Concentrations of PFOA, PFOS and PFHxS in house dust (Table 1) were similar to those reported by Kubwabo et al. (2005) from 67 homes in Ottawa, although PFHxS was detected less frequently in the present study. PFOA and PFNA concentrations were also similar to those reported by Shoeib et al. (2011) from homes sampled in Vancouver in 2007-2008. PFOS and PFHpA were somewhat higher in the Vancouver samples (GM = 73 and 79 ng/g, respectively, compared to 27 and 12 ng/g, respectively, in the present study), but PFHxA was undetected there, which contrasts with a 57% detection rate in the present study. Strynar and Lindstrom (2008), whose OH/NC samples were analyzed in the same lab as those from the present study, report much higher concentrations of PFOA and PFOS (median = 142 and 201 ng/g, respectively, compared to a GM of 24 and 27 ng/g, respectively, in the present study). However, the OH/NC samples were collected in 2000-2001 and may reflect temporal changes in house dust concentrations for PFOA and PFOS. They also detected 6:2 FTOH and 10:2 FTOH more frequently and found slightly higher concentrations of 8:2 FTOH. Homes measured in Colorado (US) from 2007-2009 by Goosey and Harrad (2011) also had much higher PFOA and PFOS concentrations (median = 240 and 310 ng/g, respectively). As for the long-chain PFCAs (C9-C13), findings were similar between this study and both the Ohio/North Carolina study and the 2007-2008 Vancouver study. PFBA, which was found frequently in home and vehicle dust in the present study (but not in office dust), was not assessed in other studies in North America.
Only two other studies have reported concentrations of PFCs in vehicle dust. Björklund et al. (2009) measured PFOA and PFOS from the interior of five cars and found similarly low concentrations as those reported here. On the other hand, Goosey and Harrad (2011) measured PFCs in dust from 20 cars in the UK and found much higher concentrations of PFOA, PFOS, PFHxS and FOSEs.
4.2. Correlations among PFCs in dust
We examined correlations between PFC compounds in the dust of each microenvironment. As expected, PFOA and PFOS were significantly correlated with one another in each microenvironment, as they are often found to be strongly correlated in environmental media and biologic samples. Interestingly, the correlation was stronger in homes (r=0.83) and vehicles (r=0.90) compared with offices (0.65). Other studies of PFCs in house dust report similar correlations between PFOA and PFOS, with r-values ranging from 0.75 to 0.86 (Kato et al., 2009; Kubwabo et al., 2005; Strynar and Lindstrom, 2008). Björklund and colleagues (2009) found a somewhat lower correlation of 0.61 when including samples from offices, homes, apartments, day cares and vehicles together in the analysis; Haug et al., (2011b) also reported a significant PFOA/PFOS correlation in house dust, but the association was weaker (r=0.36).
The carboxylate precursors, 8:2 FTOH and 10:2 FTOH, were highly correlated in office dust (r=0.97). While this association was to be expected, reasons for some of the other PFC groupings are less clear. Across microenvironments, there were many similarities in the way compounds were correlated and in the way they grouped together with PCA. PFOA and PFOS, for example, were found to be strongly correlated with PFHxA in all three microenvironments and with PFUnA in offices. Strynar and Lindstrom (2008) report a similar association between PFOA, PFOS and PFHxA. It is possible that these compounds may be found together in one commercial product, may be breakdown products from chemicals used in the same commercial product, or may be used in multiple products often used together. In both home and vehicle dust, PFNA and PFBA were similarly correlated (r=0.68 and 0.85, respectively), again suggesting a possible common source for these compounds. D’Hollander et al. (2010) report a strong correlation between PFNA and PFBA in office dust, but not in house dust. In offices, long-chain PFCAs were correlated with one another and, with the exception of PFUnA, loaded together onto one PCA factor. The many similarities in groupings across microenvironments are interesting and should be examined in future research. Future studies should also examine components of PFCs used in commercial mixtures and products in an attempt to better characterize PFC exposure sources and pathways.
4.3. Predictors of PFCs in dust
In the study of 67 homes in Ottawa (Kubwabo et al., 2005), the amount of carpeting in the house was found to be positively associated with concentrations of PFOA, PFOS and PFHxS in dust. We found higher concentrations of PFNA and PFBA in carpeted homes (data not shown), but with only 3 carpeted homes measured in the present study, we had a limited ability to assess the association. Similarly, analysis of carpeting as a predictor of PFCs in office dust found significantly lower concentrations of PFDoA, 8:2 FTOH and 10:2 FTOH in tiled offices compared to carpeted ones. Again, these results should be considered preliminary due to the small samples sizes, but they are consistent with a hypothesis that carpeting contributes to PFC levels in dust, possibly because of the use of stain-protective coatings.
Though only twelve vehicles were available for analysis (excluding one vehicle with leather interior), we found significantly lower concentrations of PFOA and PFOS in the dust of newer vehicles compared to those made between 1995 and 2001. These results most likely reflect the shift away from the use of eight-carbon PFCs in recent years in response to safety concerns and pressure from regulatory bodies and the public.
4.4. Dust versus air exposure and prediction of PFCs in serum
In this paper, we found little robust evidence for an association between exposure to PFC-containing dust in three microenvironments and workers’ serum concentrations of PFCs. Results for PFNA were sensitive to the method of analysis: when dust was modeled continuously, the result was not significant, although exclusion of an outlier lowered the p-value from 0.82 to 0.13. When modeled as tertiles, PFNA concentrations in house dust were significantly and positively associated with PFNA concentrations in serum. The PCA factor for FTOHs in office dust was marginally predictive of PFNA serum levels, while the PCA factor for FTOHs in office air, though having a similar (β-estimate, was not significantly predictive of PFNA serum levels. The PCA factor for FTOHs represents exposure to 8:2 and 10:2 FTOH. While metabolism of 10:2 FTOH to PFNA seems more plausible, a recent paper determining inhalation exposure of the rat to 8:2 FTOH found PFNA as one of the 4 highest quantifiable metabolites in the male rats (Himmelstein et al., 2012). While suggestive, more research is needed to confirm the associations observed in this study regarding FTOH exposure and PFNA serum levels.
There were a few other significant findings in univariate regression models, but examination of scatter plots revealed these to be driven by outliers. However, we cannot rule out the possibility of a true association that our study may have been underpowered to detect. In contrast to our findings, Haug et al. (2011a) found significant positive associations between PFOA and PFHxS concentrations in house dust and their corresponding concentrations in serum. Similarly, for PFOS, Haug et al. (2011a) observed a positive trend between house dust and serum concentrations, though the association did not reach statistical significance (p=0.06). Though PFC concentrations in house dust were similar between our study and theirs, we sampled dust primarily from the floor whereas they sampled dust from elevated surfaces such as bookshelves and window sills. The difference between our findings and those of Haug and colleagues could suggest that, compared to floor dust, PFCs concentrations in dust from elevated surfaces may represent a more relevant exposure metric for adults.
In a previous paper, we reported on concentrations of volatile PFCs (FTOHs, FOSAs, and FOSEs) in the air of offices sampled for this study (Fraser et al., 2012). Presented here in Table 4, we also examined associations between FTOHs in office air and serum concentrations of PFCs, finding that 8:2 FTOH (p=0.02) and 10:2 FTOH (p=0.01) were significant predictors of serum PFOA. We performed principle components analysis of all PFC air analytes and found that the PCA factor for FTOHs was an even more significant predictor (p=0.0008) of workers’ serum PFOA than any individual FTOH (Table 4), although this may also be partly due to a change in scale (log-transformation for PCA analysis). Serum PFNA was also positively associated with the PCA factor for FTOHs in air, but the association was not significant (p=0.11).
To facilitate comparison with our previous analysis of air, we also analyzed the PCA factor for FTOHs in office dust as a predictor of office worker serum (Table 4) and found a significant positive association with PFOA (p=0.01) and a borderline significant association with PFNA (p=0.06). These associations were not confounded by PFOA in office dust, which was not associated with serum concentrations of PFOA or PFNA. However, given that 8:2 FTOH and 10:2 FTOH concentrations in office dust were moderately correlated with those in office air, we wanted to assess the possibility of confounding by FTOHs in dust on the previously reported association between FTOHs in air and workers’ serum PFOA (or vice-versa). In the combined model, we found that dust concentrations of FTOHs were not acting as a confounder in the association between FTOHs in air and serum PFOA. On the contrary, the apparent relationship between the PCA factor for FTOHs in dust and serum PFOA was, in fact, being confounded by FTOHs in air.
Another way to assess the relative importance of exposure to FTOHs from air versus dust is to estimate daily intakes from the two sources using generic exposure factors and the concentrations measured in this study. For these calculations, we assumed 100% absorption for both inhalation and ingestion. Using an inhalation rate of 0.5 m3/hr for sedentary activity for an adult (U.S. EPA., 1997) and the GM concentration of 8:2 FTOH measured in office air (9920 pg/m3), we calculated an average intake of 39.7 ng of 8:2 FTOH via inhalation during an 8-hour work day. Using a dust ingestion rate for adults of 50 mg/day (U.S. EPA., 1997) and the GM concentration of 8:2 FTOH measured in office dust (309 ng/g), we calculated an average intake of 15.5 ng/day of 8:2 FTOH via incidental dust ingestion; however, because the dust ingestion rate is a daily rate, this calculation assumes that a person spends all 16 hours of non-rest time per day in the office. The estimated ingestion of 8:2 FTOH during an 8-hour work day is 7.73 ng. Based on these calculations for an 8-hour period, the dominant exposure pathway is via inhalation (39.7/7.73 = 5.1 times more), accounting for 84% of 8:2 FTOH exposure in the office. It should be emphasized that such estimations are limited by crude exposure factors and absorption rates characterized by limited data. However, the results are consistent with our finding that workers’ serum PFOA concentrations were associated with FTOHs in air but not dust.
4.5. Limitations
Our relatively small sample size of 30 participants was fairly homogenous in terms of sex, race/ethnicity, and socioeconomic status (SES). Considerable variation in dust concentrations of PFCs have been reported in the literature and variation in serum concentrations of PFCs have been observed across sex, age, and race/ethnicity categories (Calafat et al., 2007a, 2007b; Kato et al., 2011). Generalizations of these results to other populations should, therefore, be made with caution. Conversely, the relative homogeneity of our sample made the exposure-serum relationships of PFC concentrations in this population less susceptible to bias from confounding by sex, race/ethnicity, and SES.
Our results suggest that PFOA in office workers’ serum is more closely associated with PFCs in indoor office air than in dust, but this may not be the case for children who are thought to ingest considerably more dust than adults (U.S. EPA., 2008). While we found no strong evidence of an association between PFC concentrations in dust and those in serum, we did observe instances (e.g., PFOA in house dust and PFOA in serum) in which one or two influential points had relatively high concentrations of PFCs in both dust and serum (Tables 2 and 3). Such points could easily be due to chance, but it is also possible that exposure to PFCs through dust begins to noticeably impact PFC body burdens only at relatively high concentrations. Therefore, we cannot rule out the possibility that dust exposure may be a significant source of PFCs in serum for a subset of the population. Finally, there’s a possibility that PFCs in serum may be associated with emerging compounds in indoor dust that were unmeasured in this study (e.g. non-volatile PFC precursors such as polyfluoroalkyl phosphoric acid diesters, or diPAPs).
Our questionnaire included questions on dietary consumption including servings of beef, poultry, dairy, seafood, and foods packaged in paper such as fast food and pizza. As reported earlier, we did observe some suggestive positive results between diet and serum PFCs, particularly for the consumption of red meat. However, the small size and low variability across consumption categories limited our power to observe statistically significant associations (Fraser et al., 2012). While diet has been suggested to be a major source of exposure to PFCs (Björklund et al., 2009; Zhang et al., 2010), it is unlikely that diet would confound the associations, or lack thereof, between PFCs in air and dust and serum PFCs because diet would not be expected to be associated with concentrations of PFCs in air or dust.
Another important consideration is whether or not our dust sampling method was the most biologically relevant approach. It is possible that dust collected from elevated surfaces (e.g., bookshelves and tables) may better reflect adult exposure (Harrad et al., 2010). Similarly, it remains unclear whether a larger or smaller size fraction of dust is more biologically relevant. If a smaller size fraction is more relevant to exposure as some have recently suggested, then our power to detect associations between dust and serum concentrations of PFCs may have been weakened by using a larger fraction (Cao et al., 2012). Also, in homes, we only assessed exposure to PFCs in dust from main living areas when it is possible that dust from other rooms, such as the bedroom, may be more important. In vehicles, sampling dust from floors and/or dashboards in addition to seats may have yielded more dust and, therefore, a larger number of samples with sufficient mass for PFC analysis.
4.6. Conclusions
Our investigation provides insight into concentrations of PFCs in the dust of offices, homes and vehicles in the United States and represents a novel attempt to assess contributions of different exposure media and microenvironments on PFC body burdens. Our results are consistent with previous reports that PFCs are ubiquitous in indoor environments and suggest that many PFCs may be higher in the dust of offices than in other microenvironments. Furthermore, the results suggest that PFOA in office worker serum is more strongly associated with FTOH levels in office air than in dust.
Supplementary Material
Highlights.
Dust concentrations of most PFCs were higher in offices than in homes and vehicles.
There was little evidence that PFCs in dust were associated with PFCs in serum.
PFOA in office worker serum is more associated with FTOHs in office air than dust.
Acknowledgments
Funding Sources
We thank Stephanie Chan, Jessica Nelson, Heather Simpson and Courtney Walker for help with sample collection, and Amal Wanigatunga, Brian Basden, and Tao Jia for technical assistance with analysis of the serum samples. We are grateful to all study participants for enabling this research. This research was supported in part by grants R01ES015829 and T32ES014562 from the National Institute of Environmental Health Sciences (NIEHS). The findings and conclusions in this report are those of the authors and do not necessarily represent the official position of the CDC, the NIEHS, the U.S. EPA, or the National Institutes of Health. The U.S. EPA, through its Office of Research and Development, collaborated in the research described here; it has been subjected to Agency review and approved for publication.
Footnotes
Publisher's Disclaimer: This is a PDF file of an unedited manuscript that has been accepted for publication. As a service to our customers we are providing this early version of the manuscript. The manuscript will undergo copyediting, typesetting, and review of the resulting proof before it is published in its final citable form. Please note that during the production process errors may be discovered which could affect the content, and all legal disclaimers that apply to the journal pertain.
References
- Allen JG, McClean MD, Stapleton HM, Webster TF. Critical factors in assessing exposure to PBDEs via house dust. Environ Int. 2008;34:1085–1091. doi: 10.1016/j.envint.2008.03.006. [DOI] [PubMed] [Google Scholar]
- Apelberg BJ, Witter FR, Herbstman JB, Calafat AM, Halden RU, Needham LL, Goldman LR. Cord serum concentrations of perfluorooctane sulfonate (PFOS) and perfluorooctanoate (PFOA) in relation to weight and size at birth. Environ Health Perspect. 2007;115:1670–1676. doi: 10.1289/ehp.10334. [DOI] [PMC free article] [PubMed] [Google Scholar]
- Barber JL, Berger U, Chaemfa C, Huber S, Jahnke A, Temme C, Jones KC. Analysis of per- and polyfluorinated alkyl substances in air samples from Northwest Europe. J Environ Monit. 2007;9:530–541. doi: 10.1039/b701417a. [DOI] [PubMed] [Google Scholar]
- Beesoon S, Webster GM, Shoeib M, Harner T, Benskin JP, Martin JW. Isomer profiles of perfluorochemicals in matched maternal, cord, and house dust samples: manufacturing sources and transplacental transfer. Environ Health Perspect. 2011;119:1659–1664. doi: 10.1289/ehp.1003265. [DOI] [PMC free article] [PubMed] [Google Scholar]
- Björklund JA, Thuresson K, De Wit CA. Perfluoroalkyl compounds (PFCs) in indoor dust: concentrations, human exposure estimates, and sources. Environ Sci Technol. 2009;43:2276–2281. doi: 10.1021/es803201a. [DOI] [PubMed] [Google Scholar]
- Calafat AM, Kuklenyik Z, Reidy JA, Caudill SP, Tully JS, Needham LL. Serum concentrations of 11 polyfluoroalkyl compounds in the u.s. population: data from the national health and nutrition examination survey (NHANES) Environ Sci Technol. 2007a;41:2237–2242. doi: 10.1021/es062686m. [DOI] [PubMed] [Google Scholar]
- Calafat AM, Wong L-Y, Kuklenyik Z, Reidy JA, Needham LL. Polyfluoroalkyl chemicals in the U.S. population: data from the National Health and Nutrition Examination Survey (NHANES) 2003-2004 and comparisons with NHANES 1999-2000. Environ Health Perspect. 2007b;115:1596–1602. doi: 10.1289/ehp.10598. [DOI] [PMC free article] [PubMed] [Google Scholar]
- Cao Z-G, Yu G, Chen Y-S, Cao Q-M, Fiedler H, Deng S-B, Huang J, Wang B. Particle size: a missing factor in risk assessment of human exposure to toxic chemicals in settled indoor dust. Environ Int. 2012;49:24–30. doi: 10.1016/j.envint.2012.08.010. [DOI] [PubMed] [Google Scholar]
- De Silva AO, Allard CN, Spencer C, Webster GM, Shoeib M. Phosphorus-containing fluorinated organics: polyfluoroalkyl phosphoric acid diesters (diPAPs), perfluorophosphonates (PFPAs), and perfluorophosphinates (PFPIAs) in residential indoor dust. Environ Sci Technol. 2012;46:12575–12582. doi: 10.1021/es303172p. [DOI] [PubMed] [Google Scholar]
- DeWitt JC, Shnyra A, Badr MZ, Loveless SE, Hoban D, Frame SR, Cunard R, Anderson SE, Meade BJ, Peden-Adams MM, Luebke RW, Luster MI. Immunotoxicity of perfluorooctanoic acid and perfluorooctane sulfonate and the role of peroxisome proliferator-activated receptor alpha. Crit Rev Toxicol. 2009;39:76–94. doi: 10.1080/10408440802209804. [DOI] [PubMed] [Google Scholar]
- D’Hollander W, Roosens L, Covaci A, Cornelis C, Reynders H, Van Campenhout K, de Voogt P, Bervoets L. Brominated flame retardants and perfluorinated compounds in indoor dust from homes and offices in Flanders, Belgium. Chemosphere. 2010;81:478–487. doi: 10.1016/j.chemosphere.2010.07.043. [DOI] [PubMed] [Google Scholar]
- Egeghy PP, Lorber M. An assessment of the exposure of Americans to perfluorooctane sulfonate: a comparison of estimated intake with values inferred from NHANES data. J Expo Sci Environ Epidemiol. 2011;21:150–168. doi: 10.1038/jes.2009.73. [DOI] [PubMed] [Google Scholar]
- Ericson I, Martí-Cid R, Nadal M, Van Bavel B, Lindström G, Domingo JL. Human exposure to perfluorinated chemicals through the diet: intake of perfluorinated compounds in foods from the Catalan (Spain) market. J Agric Food Chem. 2008;56:1787–1794. doi: 10.1021/jf0732408. [DOI] [PubMed] [Google Scholar]
- Ericson Jogsten I, Nadal M, van Bavel B, Lindström G, Domingo JL. Per- and polyfluorinated compounds (PFCs) in house dust and indoor air in Catalonia, Spain: implications for human exposure. Environ Int. 2012;39:172–180. doi: 10.1016/j.envint.2011.09.004. [DOI] [PubMed] [Google Scholar]
- Fei C, McLaughlin JK, Tarone RE, Olsen J. Perfluorinated chemicals and fetal growth: a study within the Danish National Birth Cohort. Environ Health Perspect. 2007;115:1677–1682. doi: 10.1289/ehp.10506. [DOI] [PMC free article] [PubMed] [Google Scholar]
- Fraser AJ, Webster TF, Watkins DJ, Nelson JW, Stapleton HM, Calafat AM, Kato K, Shoeib M, Vieira VM, McClean MD. Polyfluorinated compounds in serum linked to indoor air in office environments. Environ Sci Technol. 2012;46:1209–1215. doi: 10.1021/es2038257. [DOI] [PMC free article] [PubMed] [Google Scholar]
- Fromme H, Nitschke L, Kiranoglu M, Albrecht M, Volkel W. Perfluorinated substances in house dust in Bavaria, Germany. Organohalogen Compd. 2008;70:1048–1050. [Google Scholar]
- Goosey E, Harrad S. Perfluoroalkyl compounds in dust from Asian, Australian, European, and North American homes and UK cars, classrooms, and offices. Environ Int. 2011;37:86–92. doi: 10.1016/j.envint.2010.08.001. [DOI] [PubMed] [Google Scholar]
- Harrad S, de Wit CA, Abdallah MA-E, Bergh C, Björklund JA, Covaci A, Darnerud PO, de Boer J, Diamond M, Huber S, Leonards P, Mandalakis M, Ostman C, Haug LS, Thomsen C, Webster TF. Indoor contamination with hexabromocyclododecanes, polybrominated diphenyl ethers, and perfluoroalkyl compounds: an important exposure pathway for people? Environ Sci Technol. 2010;44:3221–3231. doi: 10.1021/es903476t. [DOI] [PubMed] [Google Scholar]
- Haug LS, Huber S, Becher G, Thomsen C. Characterisation of human exposure pathways to perfluorinated compounds -- comparing exposure estimates with biomarkers of exposure. Environ Int. 2011a;37:687–693. doi: 10.1016/j.envint.2011.01.011. [DOI] [PubMed] [Google Scholar]
- Haug LS, Huber S, Schlabach M, Becher G, Thomsen C. Investigation on per- and polyfluorinated compounds in paired samples of house dust and indoor air from Norwegian homes. Environ Sci Technol. 2011b;45:7991–7998. doi: 10.1021/es103456h. [DOI] [PubMed] [Google Scholar]
- Himmelstein MW, Serex TL, Buck RC, Weinberg JT, Mawn MP, Russell MH. 8:2 fluorotelomer alcohol: a one-day nose-only inhalation toxicokinetic study in the Sprague-Dawley rat with application to risk assessment. Toxicology. 2012;291:122–132. doi: 10.1016/j.tox.2011.11.005. [DOI] [PubMed] [Google Scholar]
- Hoffman K, Webster TF, Weisskopf MG, Weinberg J, Vieira VM. Exposure to polyfluoroalkyl chemicals and attention deficit/hyperactivity disorder in U.S. children 12-15 years of age. Environ Health Perspect. 2010;118:1762–1767. doi: 10.1289/ehp.1001898. [DOI] [PMC free article] [PubMed] [Google Scholar]
- Jensen AA, Leffers H. Emerging endocrine disrupters: perfluoroalkylated substances. Int J Androl. 2008;31:161–169. doi: 10.1111/j.1365-2605.2008.00870.x. [DOI] [PubMed] [Google Scholar]
- Kato K, Calafat AM, Needham LL. Polyfluoroalkyl chemicals in house dust. Environ Res. 2009;109:518–523. doi: 10.1016/j.envres.2009.01.005. [DOI] [PubMed] [Google Scholar]
- Kato K, Wong L-Y, Jia LT, Kuklenyik Z, Calafat AM. Trends in exposure to polyfluoroalkyl chemicals in the U.S. Population: 1999-2008. Environ Sci Technol. 2011;45:8037–8045. doi: 10.1021/es1043613. [DOI] [PubMed] [Google Scholar]
- Kissa E. Fluorinated Surfactants and Repellents. 2. Marcel Dekker; New York: 2001. [Google Scholar]
- Kubwabo C, Stewart B, Zhu J, Marro L. Occurrence of perfluorosulfonates and other perfluorochemicals in dust from selected homes in the city of Ottawa, Canada. J Environ Monit. 2005;7:1074–1078. doi: 10.1039/b507731c. [DOI] [PubMed] [Google Scholar]
- Kuklenyik Z, Needham LL, Calafat AM. Measurement of 18 perfluorinated organic acids and amides in human serum using on-line solid-phase extraction. Anal Chem. 2005;77:6085–6091. doi: 10.1021/ac050671l. [DOI] [PubMed] [Google Scholar]
- Lau C, Anitole K, Hodes C, Lai D, Pfahles-Hutchens A, Seed J. Perfluoroalkyl acids: a review of monitoring and toxicological findings. Toxicol Sci. 2007;99:366–394. doi: 10.1093/toxsci/kfm128. [DOI] [PubMed] [Google Scholar]
- Lorber M, Egeghy PP. Simple intake and pharmacokinetic modeling to characterize exposure of Americans to perfluoroctanoic acid, PFOA. Environ Sci Technol. 2011;45:8006–8014. doi: 10.1021/es103718h. [DOI] [PubMed] [Google Scholar]
- Nakata A, Katsumata T, Iwasaki Y, Ito R, Saito K, Izumi S, Makino T, Kishi R, Nakazawa H. Measurement of perfluorinated compounds in human milk and house dust. Organohalogen Compd. 2007;69:2844–2846. [Google Scholar]
- Nelson JW, Hatch EE, Webster TF. Exposure to polyfluoroalkyl chemicals and cholesterol, body weight, and insulin resistance in the general U.S. population. Environ Health Perspect. 2010;118:197–202. doi: 10.1289/ehp.0901165. [DOI] [PMC free article] [PubMed] [Google Scholar]
- Prevedouros K, Cousins IT, Buck RC, Korzeniowski SH. Sources, fate and transport of perfluorocarboxylates. Environ Sci Technol. 2006;40:32–44. doi: 10.1021/es0512475. [DOI] [PubMed] [Google Scholar]
- Rumsby PC, McLaughlin CL, Hall T. Perfluorooctane sulphonate and perfluorooctanoic acid in drinking and environmental waters. Philos Trans R Soc A. 2009;367:4119–4136. doi: 10.1098/rsta.2009.0109. [DOI] [PubMed] [Google Scholar]
- Shoeib M, Harner T, Vlahos P. Perfluorinated chemicals in the arctic atmosphere. Environ Sci Technol. 2006;40:7577–7583. doi: 10.1021/es0618999. [DOI] [PubMed] [Google Scholar]
- Shoeib M, Harner T, Webster GM, Lee SC. Indoor sources of poly- and perfluorinated compounds (PFCS) in Vancouver, Canada: implications for human exposure. Environ Sci Technol. 2011;45:7999–8005. doi: 10.1021/es103562v. [DOI] [PubMed] [Google Scholar]
- Shoeib M, Harner T, Wilford BH, Jones KC, Zhu J. Perfluorinated sulfonamides in indoor and outdoor air and indoor dust: occurrence, partitioning, and human exposure. Environ Sci Technol. 2005;39:6599–6606. doi: 10.1021/es048340y. [DOI] [PubMed] [Google Scholar]
- Steenland K, Tinker S, Frisbee S, Ducatman A, Vaccarino V. Association of perfluorooctanoic acid and perfluorooctane sulfonate with serum lipids among adults living near a chemical plant. Am J Epidemiol. 2009;170:1268–1278. doi: 10.1093/aje/kwp279. [DOI] [PubMed] [Google Scholar]
- Stein CR, Savitz DA. Serum perfluorinated compound concentration and attention deficit/hyperactivity disorder in children 5-18 years of age. Environ Health Perspect. 2011;119:1466–1471. doi: 10.1289/ehp.1003538. [DOI] [PMC free article] [PubMed] [Google Scholar]
- Stein CR, Savitz DA, Dougan M. Serum levels of perfluorooctanoic acid and perfluorooctane sulfonate and pregnancy outcome. Am J Epidemiol. 2009;170:837–846. doi: 10.1093/aje/kwp212. [DOI] [PubMed] [Google Scholar]
- Strynar MJ, Lindstrom AB. Perfluorinated compounds in house dust from Ohio and North Carolina, USA. Environ Sci Technol. 2008;42:3751–3756. doi: 10.1021/es7032058. [DOI] [PubMed] [Google Scholar]
- Strynar MJ, Lindstrom AB, Nakayama SF, Egeghy PP, Helfant LJ. Pilot scale application of a method for the analysis of perfluorinated compounds in surface soils. Chemosphere. 2012;86:252–257. doi: 10.1016/j.chemosphere.2011.09.036. [DOI] [PubMed] [Google Scholar]
- Tittlemier SA, Pepper K, Seymour C, Moisey J, Bronson R, Cao X-L, Dabeka RW. Dietary exposure of Canadians to perfluorinated carboxylates and perfluorooctane sulfonate via consumption of meat, fish, fast foods, and food items prepared in their packaging. J Agric Food Chem. 2007;55:3203–3210. doi: 10.1021/jf0634045. [DOI] [PubMed] [Google Scholar]
- U.S. EPA. Exposure Factors Handbook (No EPA/600/P-95/002Fa-c) U.S. Environmental Protection Agency; Washington, DC: 1997. [Google Scholar]
- U.S. EPA. Child-Specific Exposure Factors Handbook (Final Report) (No EPA/600/R-06/096F) U.S. Environmental Protection Agency; Washington, DC: 2008. [Google Scholar]
- Zhang T, Sun HW, Wu Q, Zhang XZ, Yun SH, Kannan K. Perfluorochemicals in meat, eggs and indoor dust in China: assessment of sources and pathways of human exposure to perfluorochemicals. Environ Sci Technol. 2010;44:3572–3579. doi: 10.1021/es1000159. [DOI] [PubMed] [Google Scholar]
Associated Data
This section collects any data citations, data availability statements, or supplementary materials included in this article.