

Abstract
Motivation: RNA-seq is replacing microarrays as the primary tool for gene expression studies. Many RNA-seq studies have used insufficient biological replicates, resulting in low statistical power and inefficient use of sequencing resources.
Results: We show the explicit trade-off between more biological replicates and deeper sequencing in increasing power to detect differentially expressed (DE) genes. In the human cell line MCF7, adding more sequencing depth after 10 M reads gives diminishing returns on power to detect DE genes, whereas adding biological replicates improves power significantly regardless of sequencing depth. We also propose a cost-effectiveness metric for guiding the design of large-scale RNA-seq DE studies. Our analysis showed that sequencing less reads and performing more biological replication is an effective strategy to increase power and accuracy in large-scale differential expression RNA-seq studies, and provided new insights into efficient experiment design of RNA-seq studies.
Availability and implementation: The code used in this paper is provided on: http://home.uchicago.edu/∼jiezhou/replication/. The expression data is deposited in the Gene Expression Omnibus under the accession ID GSE51403.
Contact: kpwhite@uchicago.edu
Supplementary information: Supplementary data are available at Bioinformatics online.
1 INTRODUCTION
RNA-seq has been widely used for differential expression studies (Oshlack et al., 2010; Ozsolak and Milos, 2011). Despite the large number of studies performed for transcriptome comparisons, little empirical optimization has been made for RNA-seq-based experimental designs. Critical issues include biological replication and sequencing depth (Auer and Doerge, 2010), and inefficient designs of RNA-seq studies can lead to suboptimal power and waste of resources, especially in large-scale treatment-control studies.
Although for most RNA-seq studies high technical reproducibility means that technical replicates are not necessary (Marioni et al., 2008), this fact does not ameliorate the need for biological replicates in making statistical inferences (Hansen et al., 2011). Yet frequently large-scale RNA-seq studies with extensive differential expression analyses have used limited biological replication, instead favoring a strategy of low level biological replication with deep sequencing (e.g. Brawand et al., 2011; Graveley et al., 2011; Hah et al., 2011).
In addition to replication number, the choice for sequencing depth is often unguided. It is clear that higher sequencing depth generates more informational reads, which increases the statistical power to detect differentially expressed (DE) genes (Tarazona et al., 2011). However, high-sequencing depth comes with cost, and resources will be wasted in scenarios where more sequencing brings diminishing returns as a saturation level is approached.
To achieve maximum power to detect DE genes within a budget, a compromise must be made between sequencing depth and biological replication. There are a few previous studies on experimental design issues for RNA-seq studies (Auer and Doerge, 2010; Fang and Cui, 2011; Tarazona et al., 2011; Busby et al., 2013), but they do not empirically address the specific question raised here of the trade-offs in power between replication, sequencing depth and cost: should we sequence more samples with low depth, or should we sequence fewer samples with high depth?
2 METHODS
MCF7 cells (from American Type Cell Culture) were seeded in complete medium in 2 plates of 6 cm each until reaching 40% confluence, followed by incubation in medium with 10% charcoal-stripped serum for 3 days. The cells were then treated with either 10 nM 17β-estradiol (E2) or control for 24 h. Qiagen RNeasy columns were used to extract messenger RNAs. RNA integrity was measured by Bioanalyzer (minimum RNA integrity score 9.0).
RNA-seq libraries were constructed using the Illumina TruSeq RNA sample preparation protocol in the Institute for Genomics and Systems Biology Sequencing Center. Libraries were multiplexed with Illumina barcodes, and six samples were sequenced per lane by Illumina HiSeq 2000. A total of 50-bp single end reads were generated. Seven biological replicates of both control and E2-treated MCF7 cells were sequenced. More than 30 M reads were produced for each library.
All sequences were aligned to the hg18 human genome using Tophat (Trapnell et al., 2012). We randomly downsampled the RNA-seq reads of each sample to generate datasets of 2.5, 5, 10, 15, 20, 25 and 30 M reads using Picard Version 1.61 (Wysoker et al., 2012). In all subsequent analysis, the total number of reads refers to total number of aligned reads. Using these downsampled sequence reads, we generated raw counts of number of tags on each gene by using coverageBED program in the BEDTools package Version 2.16.2 (Quinlan and Hall, 2010).
The edgeR (Robinson et al., 2010) package (Version 2.6.9) was used to detect significantly DE genes between control and E2-treated samples. Upper-quantile normalization was performed to normalize tag counts among different samples. Tag-wise dispersion of a negative binomial distribution for each gene was estimated and used in the exactTest function in edger package to identify DE genes. Genes with <5 reads are removed from calculation. In the simulation, under each sequencing depth, treatment samples are randomly picked (without replacement) to compare with the same number of control samples, and the numbers of DE genes were calculated using edgeR, with a false discovery rate (FDR) cutoff of 0.05 (Benjamini & Hochberg adjusted). Each sequencing depth and biological replication was simulated 100 times.
For the power calculation and generation of Receiver-Operating Characteristic (ROC) curves, a list of 3292 genes was used as ‘true positives’ for E2-regulated genes. The list consisted of DE genes detected by edgeR, using seven biological replicates, with a sequencing depth of 30 M reads per replicate, and an FDR cutoff of 0.001. Using this gene list, we computed true positive rates and true negative rates for each replication level and each sequencing depth on varying FDR rates, then computed power and constructed ROC curves based on these rates.
The coefficient of variation (CV) for the logFC was computed using the top 100 DE genes (defined as those with the lowest FDR in edgeR using seven replicates, 30 M reads/replicate). Estimated logFC computed at each level of replication and sequencing depth was simulated 100 times as mentioned earlier in the text, and CVs were computed. The logCPM (logarithm of counts per million reads) was used here as a proxy for the estimation accuracy of expression level instead of FPKM because genes with similar tag counts will have similar level of randomness in expression estimation. The CV of logCPM was calculated similar to CV of logFC. The high expression level genes were defined as genes with logCPM rank 1–100; medium expression level genes were defined as genes with logCPM rank 2001–2100; and low expression level genes were defined as genes with logCPM rank 12001–12100.
When calculating cost per DE gene, we made the following assumptions: Illumina sequencing cost per lane is $1200 (including reagents, personnel, equipment depreciation and contracts), for each lane 150 M reads can be produced and maximum multiplexing for each lane is 24×. The fixed cost for each sample is the library preparation cost, which is assumed to be $250 (reagents and personnel).
3 RESULTS
3.1 Trade-off between sequencing depth and biological replication
We calculated the number of significantly DE genes between E2-treated MCF7 cells and control-treated MCF7 cells under various levels of biological replication and sequencing depth (Fig. 1a; see Section 2). The number of DE genes increases with both increased number of biological replicates and increased number of reads in each sample. However, the increase in number of DE genes with sequencing depth has diminishing returns after 10 M reads. For example, at a sequencing depth of 10 M reads, using two biological replicates for a total of 20 M combined reads, the average number of DE genes identified was 2011. When we used 15 M reads and two biological replicates for a total of 30 M combined reads, the number is 2139, a 6% increase for a 50% increase in reads. If instead we applied an additional 10 M reads to another biological replicate (three biological replicates for a total of 30 M combined reads), we obtained an average of 2709 DE genes, a 35% increase. Even when we tripled the reads for the two biological replicates to 30 M each (60 M combined total), we found an average of 2522 DE genes, an increase of only 27%. Similar results were observed when we used different significance cutoffs or using different software package DESeq (Anders and Huber, 2010) (Supplementary Fig. S1).
Fig. 1.
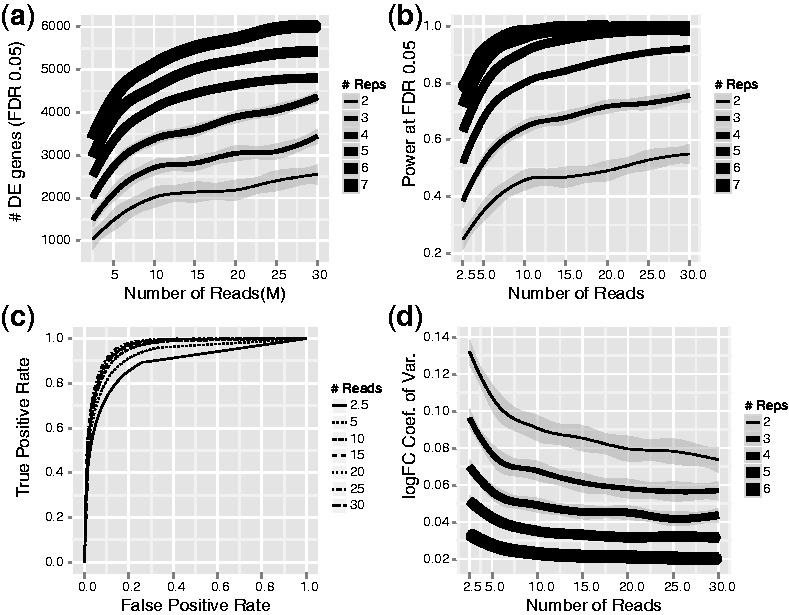
(a) Increase in biological replication significantly increases the number of DE genes identified. Numbers of sequencing reads have a diminishing return after 10 M reads. Line thickness indicates depth of replication, with 2 replicates the darkest and 7 replicates the lightest. The lines are smoothed averages for each replication level, with the shaded regions corresponding to the 95% confidence intervals. (b) Power of detecting DE genes increases with both sequencing depth and biological replication. Similar to the trends in (a), increases in the power showed diminishing returns after 10 M reads. (c) ROC curves for three biological replicates. Sequencing deeper than 10 M reads did not significantly improve statistical power and precision for detecting DE genes. (d) The CV of logFC for the top 100 DE genes. The CV of the logFC estimates decreased significantly as we added more biological replicates, whereas adding sequencing depth after 10 M reads had much less effect
Moreover, as one might expect based on most other biological measurements (Sokal and Rohlf, 1995), substantial increase in power through replication occurs regardless of sequencing depth. At 30 M depth, two replicates give 2553 DE genes, and three replicates give 3447 DE genes, a 35% increase. If samples are available, adding more biological replicates almost always increases power significantly. Adding biological replicates has diminishing returns only when the number of replications is high. Increase from two biological replicates to three biological replicates at 10 M depth yielded a 34.7% increase in number of DE genes, but increase from six replicates to seven replicates still added 26.3% more DE genes at this sequencing depth (Fig. 1a). When we split genes into high, medium and low expressed gene sets and plotted the relationship between DE genes, sequencing depth and replication level separately, we observed that biological replicates increase DE genes for genes of all expression levels as expected, but that replication was also more effective than adding sequencing depth for all expression levels (Supplementary Fig. S3).
Concordant with the total number of DE genes, statistical power also increased as more sequence or biological replicates were added (Fig. 1b). Similar to the trends in total numbers of DE genes, we observed diminishing returns on power after 10 M reads/sample. For example, with two replicates, 10 M reads/sample (20 M reads combined), we calculated a power of 0.46. When we tripled the number of reads to 30 M reads/sample (60 M reads combined), we observed a power of 0.55, only a 19.6% increase. In contrast, if we added another biological replicate at 10 M reads (30 M reads combined), we reached a power of 0.65, a 41.3% increase. When we split the genes into high, medium and low expressers and plotted the relationship between power, sequencing depth and replication (Supplementary Fig. S4), similar trends were observed: replication added significant power to detect DE genes regardless of expression and was more effective than adding sequencing depth. If this strategy is adopted, one possible concern is that with lower sequencing depth, more genes will be dropped from the DE calculation, as most software packages remove genes with <5 reads. However, in our dataset as long as number of reads exceeded 10 M, reducing sequencing depth had small effects on the number of genes that were removed. (Supplementary Fig. S5).
To look further into the false-positive rates and false-negative rates under these conditions, we constructed ROC curves for all sequencing depths and replication levels (Fig. 1c; see Section 2). At three biological replicates, 10 M reads was nearly as good as 30 M reads in terms of statistical power and precision (percentage of true positives among all positives). Curves for other replication levels showed similar trends (Supplementary Fig. S2). For ROC curves at 10 M reads, similar to the trends in the power curves, 4 replicates was very close to 6 replicates, whereas power and precision gains from 2–3 replicates and 3–4 replicates were more substantial.
To gain a quantitative estimate of how accurate these estimates are under different conditions, we also examined individual gene log fold changes (logFC) and expression level estimation accuracy under different levels of replication and sequencing depth. For logFC estimates, we calculated the logFC CV for the top 100 most DE genes (Fig. 1d). For these 100 genes, adding sequencing reads after 10 M reads had little effect on CV when replication was high, whereas biological replication continued to improve accuracy of logFC estimation significantly; high replication levels gave accuracies that are probably not practically achievable by adding sequencing depth at low replication levels.
For expression level estimation, we examined three groups of genes: high, medium and low expression level (see Section 2). For these three groups of genes, the CV of logCPM was calculated and plotted against sequencing depth and replication level (Fig. 2a–c). For highly expressed genes, accuracy of expression level estimates was already high (Fig. 2a), and adding more reads had little effect on accuracy, whereas biological replicates still improved accuracy. For low expression genes (Fig. 2c), CVs for expression estimates were much larger, and accuracy was improved when either more reads or more replicates were added. For genes with medium expression level (Fig. 2b), the situation is somewhat in between, as expected: adding more sequencing reads reduced CVs slightly, whereas biological replicates still reduced CVs significantly. These results indicate that biological replicates improve the accuracy in estimating expression level for all genes, regardless of expression level, whereas adding sequencing depth will improve estimation accuracy mostly for low expression genes.
Fig. 2.

(a–c) The CV of logCPM for high expression level genes (a), medium expression level genes (b) and low expression level genes (c) (see Section 2 for definition). High/medium expression level genes have low CV for expression level estimates. Adding sequencing depth did not have significant effect on accuracy of estimation, whereas adding biological replicates improved accuracy significantly. For low expression level genes, both adding sequencing depth and adding biological replication level improved expression level estimation accuracy. (d) Number of DE genes plotted against the total estimated sequencing cost. If higher numbers of DE genes are needed, increased biological replication should be used
3.2 A metric for cost-effectiveness
When choosing an experimental design for an RNA-seq differential expression study, the trade-off between number of biological replicates and sequencing depth is an important consideration, especially for large projects where many perturbation experiments are performed. Our results indicate that biological replicates are important for increasing the power for DE gene detection regardless of the sequencing depth used.
To guide experimental designs of RNA-seq studies for differential expression, we propose the following simple metric:
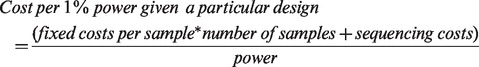 |
The cost per 1% power metric measures the cost-effectiveness of a given study design. Fixed costs per sample include library construction costs, sample costs and labor costs. Sequencing costs are variable costs for each sample depending on the sequencing depth and multiplexing scheme used. In study designs for RNA-seq DE studies, we can compare different designs using cost per 1% power after defining our total budget and desired power.
Using this formula and some cost assumptions (see Section 2), we calculated the cost per 1% power for different designs of our experiment (Table 1). For our samples, the lowest cost per 1% power was achieved at the 10 M sequencing depth for 2–6 replicates. The cost per 1% power did increase slightly when we added more biological replicates, but having more biological replicates also means higher power (Fig. 2b). If a larger number of DE genes is desired in the study, the number of samples to be used in the study can be decided based on such ‘standard curves’. However, our cost calculation here does not reflect the sample collection cost, which varies widely from project to project. For the human cell line studies we presented here, sample collection cost is relatively low, but for other projects, the sample collection cost can dominate the cost calculation.
Table 1.
Cost efficiency for power to detect DE genes (cost per 1% power given each experimental design where the variables are)
| Relative cost | 2.5 M | 5 M | 10 M | 15 M | 20 M | 25 M | 30 M |
|---|---|---|---|---|---|---|---|
| 2 replicates | 24.2 | 17.2 | 14.4a | 15.8 | 16.7 | 17.0 | 17.8 |
| 3 replicates | 23.4 | 17.2 | 15.3a | 16.3 | 17.1 | 18.5 | 19.4 |
| 4 replicates | 23.1 | 17.7 | 16.5a | 17.5 | 18.6 | 19.8 | 21.2 |
| 5 replicates | 23.8 | 19.0 | 18.1a | 19.4 | 21.0 | 22.8 | 24.9 |
| 6 replicates | 25.0 | 20.7 | 20.6a | 22.4 | 24.6 | 27.0 | 29.4 |
| 7 replicates | 26.8 | 23.0a | 23.5 | 26.0 | 28.7 | 31.5 | 34.3 |
Note: Assumptions made during calculations are described in Section 2.
aLowest cost per 1% power in each replication level. Units are in dollars.
4 CONCLUSION
We conclude that in a typical DE study using RNA-seq, sequencing deeper for each sample generates diminishing returns for power of detecting DE genes once beyond a certain sequencing depth. Instead, increasing the number of biological replications consistently increases the power significantly, regardless of sequencing depth. Additionally, estimation accuracy for logFC and absolute expression levels greatly improve across the board when more biological replicates are added, whereas sequencing depth improves the accuracy of these estimations only in some situations, so, when possible, using more biological replication with lower sequencing depth, instead of sequencing few samples in great depth, is a more efficient strategy for RNA-seq DE studies. In the specific case of MCF7 breast cancer cell samples, our cost metric suggests that sequencing >10 M reads/sample gives diminishing returns compared with adding replication. Obviously, for other species and perhaps other samples such as heterogeneous tumor samples, the exact sequencing depth will be different, but the overall guideline of replication rather than deeper sequencing should still remain. A similar set of standard curves could be constructed for each type of sample to guide experimental designs, particularly for large-scale genomic studies where optimization for cost effectiveness can have a significant impact. Almost all individual laboratories are mindful of budgets, but the stakes are particularly high in studies such as Encyclopedia of DNA Elements (ENCODE) or The Cancer Genome Atlas (TCGA) where millions of dollars are being spent on sequencing.
We have focused on differential expression studies using RNA-seq with the aim to improve a single target: power to detect DE genes between samples. Of course, there are cases where sequencing deeply is advantageous (such as differential expression of exons and transcript-specific expression). In these applications, much higher sequencing depths are required because the informative genomic regions are much shorter. However, if gene differential expression is the primary goal, it would be a sensible choice to optimize sequencing depth and number of biological replicates according to the simple guidelines we propose here.
Funding: National Institute of General Medical Sciences (P50GM081892) and the Searle Funds at The Chicago Community Trust from the Chicago Biomedical Consortium.
Conflict of interest: none declared.
Supplementary Material
REFERENCES
- Anders S, Huber W. Differential expression analysis for sequence count data. Genome Biol. 2010;11:R106. doi: 10.1186/gb-2010-11-10-r106. [DOI] [PMC free article] [PubMed] [Google Scholar]
- Auer PL, Doerge RW. Statistical design and analysis of RNA sequencing data. Genetics. 2010;185:405–416. doi: 10.1534/genetics.110.114983. [DOI] [PMC free article] [PubMed] [Google Scholar]
- Brawand D, et al. The evolution of gene expression levels in mammalian organs. Nature. 2011;478:343–348. doi: 10.1038/nature10532. [DOI] [PubMed] [Google Scholar]
- Busby MA, et al. Scotty: a web tool for designing RNA-Seq experiments to measure differential gene expression. Bioinformatics. 2013;29:656–657. doi: 10.1093/bioinformatics/btt015. [DOI] [PMC free article] [PubMed] [Google Scholar]
- Fang Z, Cui X. Design and validation issues in RNA-seq experiments. Brief. Bioinform. 2011;12:280–287. doi: 10.1093/bib/bbr004. [DOI] [PubMed] [Google Scholar]
- Graveley BR, et al. The developmental transcriptome of Drosophila melanogaster. Nature. 2011;471:473–479. doi: 10.1038/nature09715. [DOI] [PMC free article] [PubMed] [Google Scholar]
- Hah N, et al. A rapid, extensive, and transient transcriptional response to estrogen signaling in breast cancer cells. Cell. 2011;145:622–634. doi: 10.1016/j.cell.2011.03.042. [DOI] [PMC free article] [PubMed] [Google Scholar]
- Hansen KD, et al. Sequencing technology does not eliminate biological variability. Nat. Biotech. 2011;29:572–573. doi: 10.1038/nbt.1910. [DOI] [PMC free article] [PubMed] [Google Scholar]
- Marioni JC, et al. RNA-seq: an assessment of technical reproducibility and comparison with gene expression arrays. Genome Res. 2008;18:1509–1517. doi: 10.1101/gr.079558.108. [DOI] [PMC free article] [PubMed] [Google Scholar]
- Oshlack A, et al. From RNA-seq reads to differential expression results. Genome Biol. 2010;11:220. doi: 10.1186/gb-2010-11-12-220. [DOI] [PMC free article] [PubMed] [Google Scholar]
- Ozsolak F, Milos PM. RNA sequencing: advances, challenges and opportunities. Nat. Rev. Genet. 2011;12:87–98. doi: 10.1038/nrg2934. [DOI] [PMC free article] [PubMed] [Google Scholar]
- Quinlan AR, Hall IM. BEDTools: a flexible suite of utilities for comparing genomic features. Bioinformatics. 2010;26:841–842. doi: 10.1093/bioinformatics/btq033. [DOI] [PMC free article] [PubMed] [Google Scholar]
- Robinson MD, et al. edgeR: a Bioconductor package for differential expression analysis of digital gene expression data. Bioinformatics. 2010;26:139–140. doi: 10.1093/bioinformatics/btp616. [DOI] [PMC free article] [PubMed] [Google Scholar]
- Sokal RR, Rohlf FJ. The Principles and Practice of Statistics in Biological Research. 3rd edn. New York: W. H. Freeman; 1995. [Google Scholar]
- Tarazona S, et al. Differential expression in RNA-seq: a matter of depth. Genome Res. 2011;21:2213–2223. doi: 10.1101/gr.124321.111. [DOI] [PMC free article] [PubMed] [Google Scholar]
- Trapnell C, et al. Differential gene and transcript expression analysis of RNA-seq experiments with TopHat and Cufflinks. Nat. Protoc. 2012;7:562–578. doi: 10.1038/nprot.2012.016. [DOI] [PMC free article] [PubMed] [Google Scholar]
- Wysoker A, et al. Picard. 2012 http://picard.sourceforge.net (7 January 2013, date last accessed) [Google Scholar]
Associated Data
This section collects any data citations, data availability statements, or supplementary materials included in this article.