
Fig. 1.
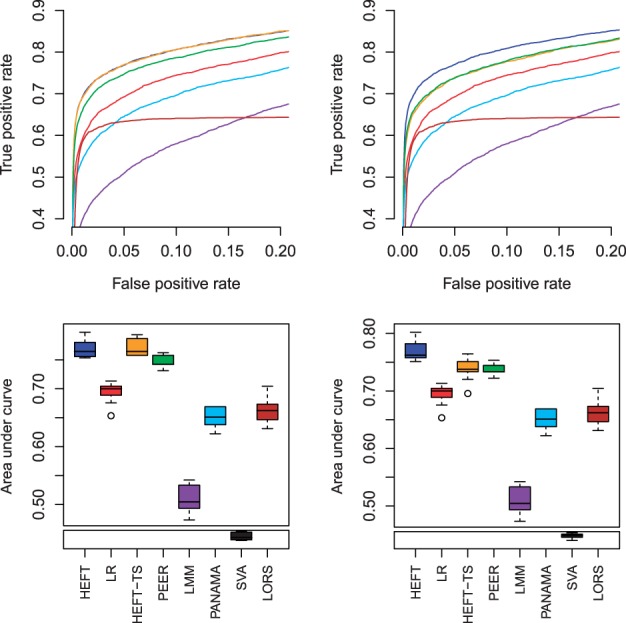
Average ROC curves (top) and box plots of the AUC for the ROC for an FPR in the range 0–0.05 (bottom) for simulated data in the case of pleiotropic eQTL effects and non-orthogonal hidden factors (scenario vi), where left and right correspond to provided factor numbers of four and seven, respectively, for the analysis methods when selection of factor number applies (see Supplementary Fig. S10 for other factor numbers). The methods are color coded as red = linear regression, blue = HEFT, orange = HEFT-TS, green = PEER, purple = LMM-EH, sky blue = PANAMA, black = SVA and brown = LORS. The leveling off of the ROC curve for LORS is a consequence of this method preselecting markers to include, which caps the maximum number of true positives that can be identified