Abstract
Background. Sodium-glucose cotransporter 2 (SGLT2) inhibitors lower glycemia by enhancing urinary glucose excretion. The physiologic response to pharmacologically induced acute or chronic glycosuria has not been investigated in human diabetes.
Methods. We evaluated 66 patients with type 2 diabetes (62 ± 7 years, BMI = 31.6 ± 4.6 kg/m2, HbA1c = 55 ± 8 mmol/mol, mean ± SD) at baseline, after a single dose, and following 4-week treatment with empagliflozin (25 mg). At each time point, patients received a mixed meal coupled with dual-tracer glucose administration and indirect calorimetry.
Results. Both single-dose and chronic empagliflozin treatment caused glycosuria during fasting (median, 7.8 [interquartile range {IQR}, 4.4] g/3 hours and 9.2 [IQR, 5.2] g/3 hours) and after meal ingestion (median, 29.0 [IQR, 12.5] g/5 hours and 28.2 [IQR, 15.4] g/5 hours). After 3 hours of fasting, endogenous glucose production (EGP) was increased 25%, while glycemia was 0.9 ± 0.7 mmol/l lower (P < 0.0001 vs. baseline). After meal ingestion, glucose and insulin AUC decreased, whereas the glucagon response increased (all P < 0.001). While oral glucose appearance was unchanged, EGP was increased (median, 40 [IQR, 14] g and 37 [IQR, 11] g vs. 34 [IQR, 11] g, both P < 0.01). Tissue glucose disposal was reduced (median, 75 [IQR, 16] g and 70 [IQR, 21] g vs. 93 [IQR, 18] g, P < 0.0001), due to a decrease in both glucose oxidation and nonoxidative glucose disposal, with a concomitant rise in lipid oxidation after chronic administration (all P < 0.01). β Cell glucose sensitivity increased (median, 55 [IQR, 35] pmol•min–1•m–2•mM–1 and 55 [IQR, 39] pmol•min–1•m–2•mM–1 vs. 44 [IQR, 32] pmol•min–1•m–2•mM–1, P < 0.0001), and insulin sensitivity was improved. Resting energy expenditure rates and those after meal ingestion were unchanged.
Conclusions. In patients with type 2 diabetes, empagliflozin-induced glycosuria improved β cell function and insulin sensitivity, despite the fall in insulin secretion and tissue glucose disposal and the rise in EGP after one dose, thereby lowering fasting and postprandial glycemia. Chronic dosing shifted substrate utilization from carbohydrate to lipid.
Trial registration. ClinicalTrials.Gov NCT01248364 (EudraCT no. 2010-018708-99).
Funding. This study was funded by Boehringer Ingelheim.
Introduction
Under normal circumstances, glycosuria is minimal, even after a large meal, because plasma glucose concentrations rarely exceed the renal glucose threshold. In persons with diabetes, glycosuria provides some protection against severe hyperglycemia. Sodium-glucose cotransporter 2 (SGLT2), a low-affinity, high-capacity member of an increasingly numerous family of cotransporters (1), is highly expressed in the proximal renal tubule, in which it is reputed to be responsible for the bulk of reabsorption of filtered glucose (2). The idea of blocking SGLT2 activity to induce therapeutic glycosuria stems from the first demonstration of competitive inhibition by phlorizin of glucose uptake into brush border vesicles from normal human kidney (3). Subsequent studies showed that phlorizin-induced chronic glycosuria corrected insulin resistance and restored β cell function in the pancreatectomized rat model of type 2 diabetes (4), thereby laying the groundwork for the concept of glucose toxicity (5). In knockout mice, deletion of SGLT2 improves glucose tolerance and β cell function (6, 7), without compromising renal growth or function (8). Finally, familial renal glycosuria, a rare condition due to inactivating private mutations of the gene encoding SGLT2 (SLC5A2), provides a human model of chronic euglycemic glycosuria that appears to be associated with preserved renal function and, to the best of available evidence, normal glucose tolerance and body weight (9, 10).
Based on these premises, a new class of orally active antihyperglycemic agents has recently undergone pharmacological development, with some of them already available for clinical use (11–16). Most of these compounds are highly selective for SGLT2, although dual SGLT2/SGLT1 inhibitors also are being tested for the treatment of type 2 diabetes (17, 18).
When large amounts of glucose — ranging from 50 to 100 g daily — and the corresponding calorie equivalent (200–400 kcal/d) are pharmacologically forced into urinary excretion, whole-body metabolism must undergo adaptive changes involving glucose fluxes, hormonal responses, fuel selection, and energy expenditure. In the present work, we used empagliflozin, a highly potent and selective SGLT2 inhibitor, to investigate the integrated physiological response to forced glycosuria in patients with type 2 diabetes. By combining a mixed meal with the double-tracer technique, we measured the separate contribution of meal-derived glucose, endogenous glucose production (EGP), and whole-body glucose disposal to plasma glucose concentrations. With the use of indirect calorimetry, we assessed the attendant changes in substrate utilization and energy expenditure. Specifically, we tested the following questions: (a) whether the glycosuric effect of the inhibitor is maintained over time, (b) whether EGP is altered in response to the glycosuria, (c) how the lower plasma glucose levels affect β cell function and insulin sensitivity, (d) how tissue substrate utilization adapts to the glucose leak, (e) what is the hormonal background of these responses, and (f) whether the glycosuria-induced energy deficit alters resting energy expenditure and the thermogenic response to feeding.
Results
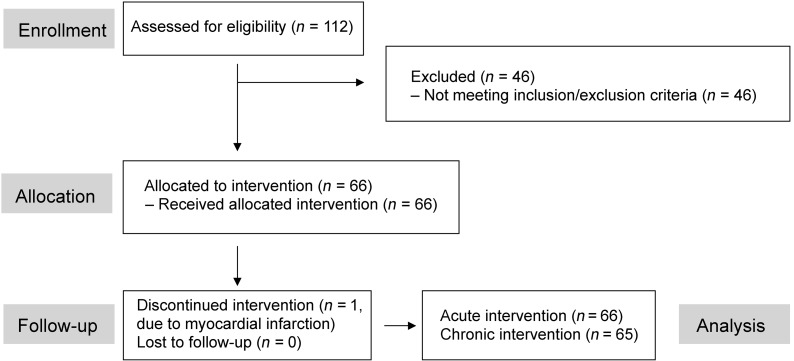
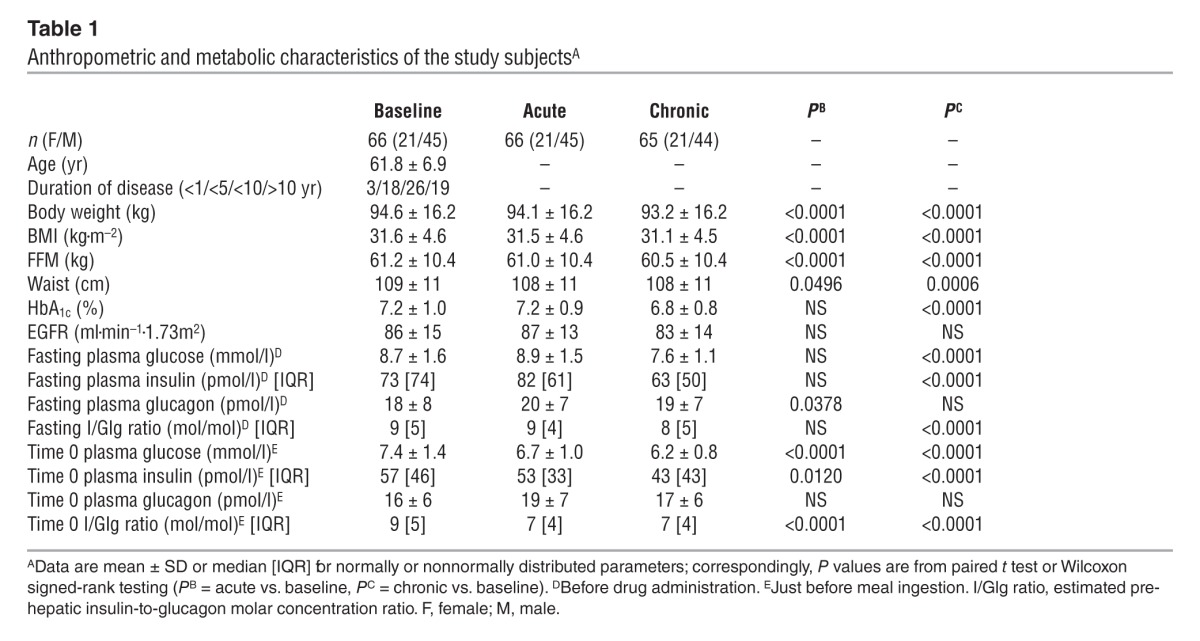
The final patient population (Figure 1) consisted of overweight/obese patients, mostly with a disease duration longer than 5 years, with preserved renal function and good glycemic control (Table 1).
Figure 1. Flow chart.
Flow chart of patient enrollment, allocation, and follow-up.
Table 1.
Anthropometric and metabolic characteristics of the study subjectsA
Baseline.
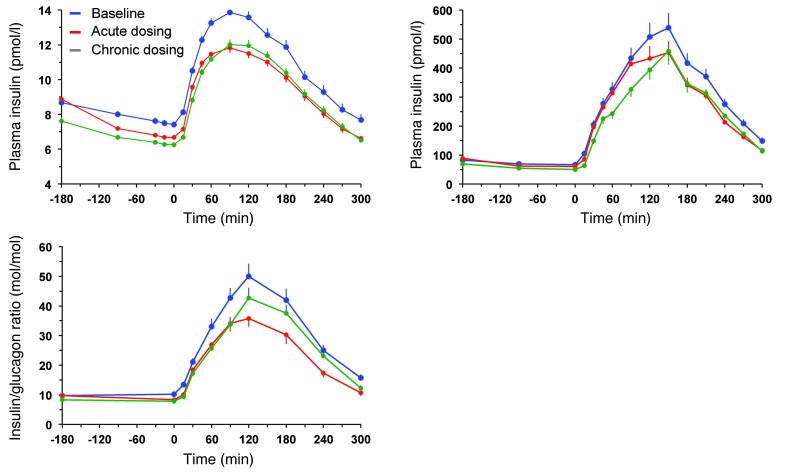
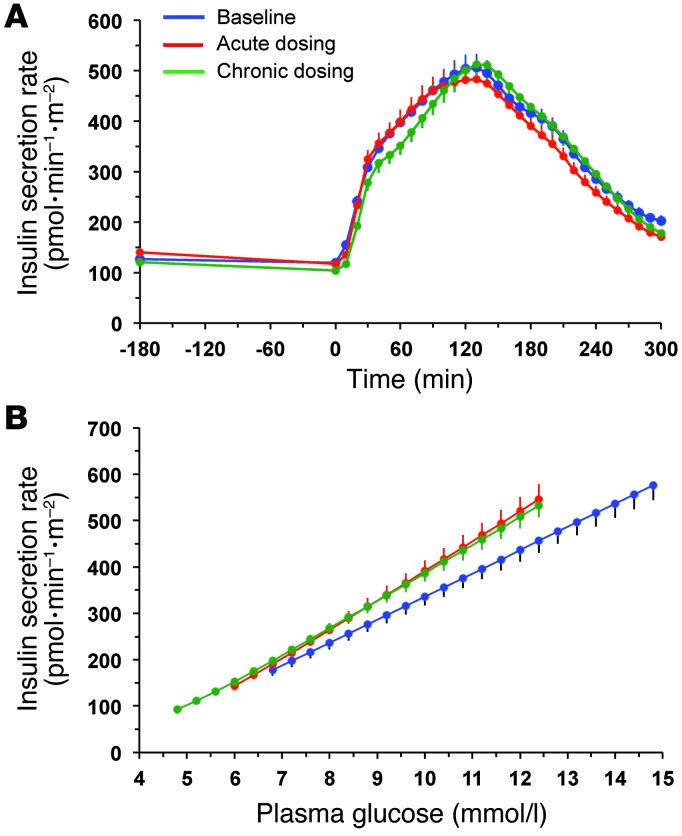
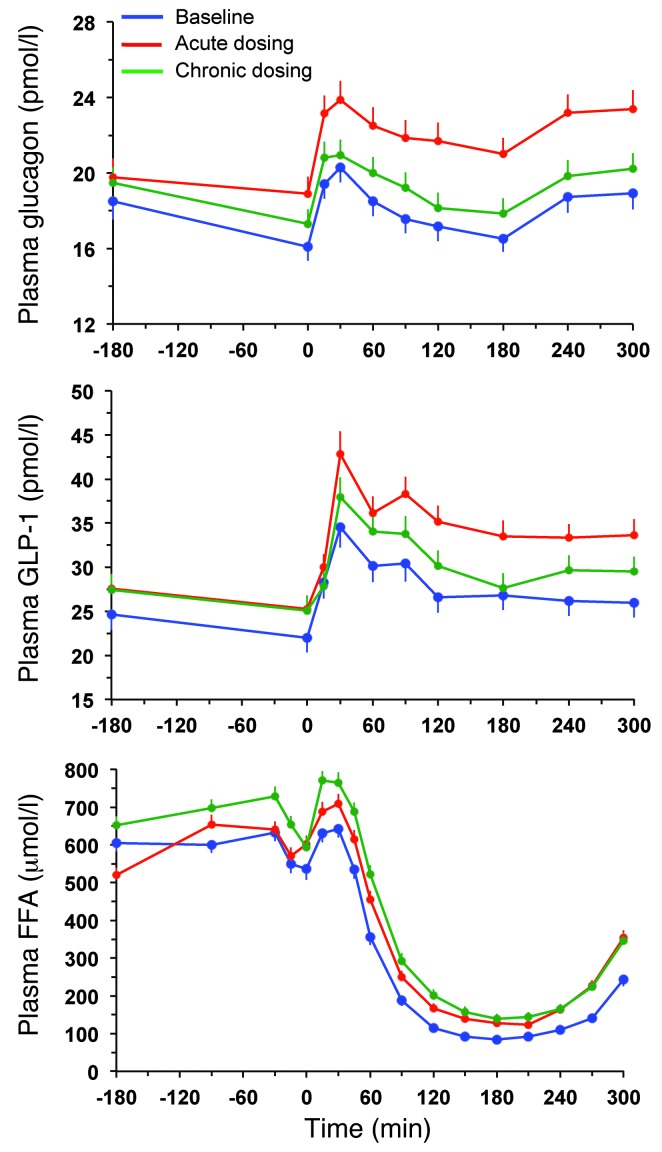
During the 3 hours preceding meal ingestion, plasma glucose concentrations decreased by 1.3 ± 0.8 mmol/l (P < 0.0001), reflecting progression of the fast; over this time period, the estimated prehepatic insulin/glucagon molar concentration ratio did not change (Table 1). Following the ingestion of the mixed meal, plasma glucose excursions peaked at 30 minutes (by ∼5 mmol/l on average) and did not return to baseline values before 5 hours (Figure 2). Plasma insulin and glucagon concentrations, and their estimated prehepatic molar concentration ratios, rose and fell in a time pattern parallel to that of glycemia (Figure 2 and Table 2). The relationship between insulin secretion rates and concomitant plasma glucose concentrations (i.e., β cell glucose sensitivity) was typical of this kind of patients (refs. 19, 20, and Figure 3), the average value (median, 44 [interquartile range {IQR}, 32] pmol•min–1•m–2•mM–1) being reduced by approximately 60% in comparison with that of a historical control group of nondiabetic subjects studied with the exact same protocol (98 pmol•min–1•m–2•mM–1) (19, 20). Fasting insulin secretion rate was within the normal range (21), extrapolating to approximately 27 U/m2 over 24 hours; an average incremental output of 11 U/m2 insulin was used to dispose of the meal. Both potentiation and rate sensitivity were reduced in comparison with those in nondiabetic subjects (1.73 and 1,081 pmol•m–2•mM–1, respectively) (refs. 19, 20, and Table 3). The meal elicited a robust and protracted GLP-1 response and a large decrement in circulating FFA concentrations (Figure 4).
Figure 2. Plasma glucose and insulin concentrations and prehepatic insulin-to-glucagon ratio.
Plasma glucose and insulin concentrations as well as estimated prehepatic insulin-to-glucagon molar concentration ratio in 66 patients with type 2 diabetes at baseline, after a single dose of empagliflozin, and following 4 weeks of chronic empagliflozin administration during 3 hours of fasting and 5 hours after mixed meal ingestion. Plots represent mean ± SEM.
Table 2.
Glucose, hormones, and FFA during the mealA
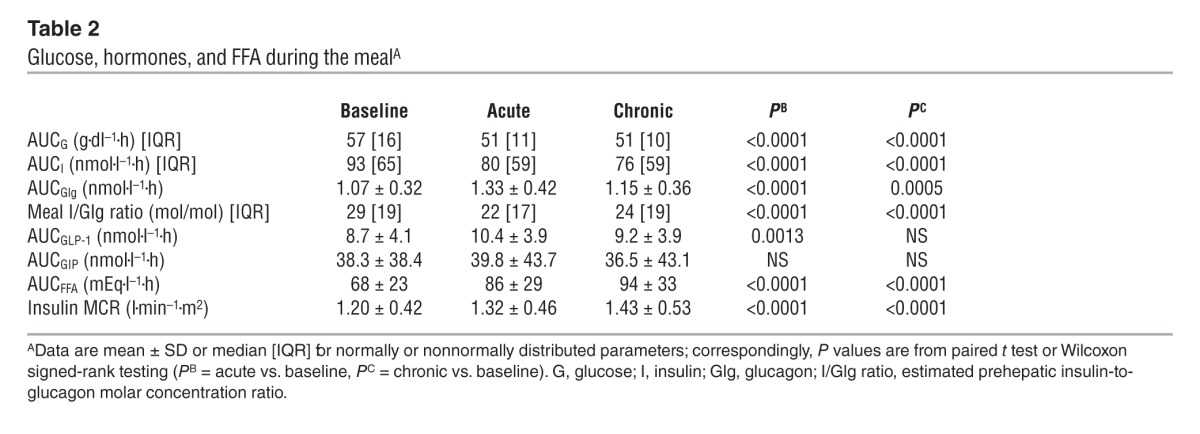
Figure 3. Insulin secretion rates and their relationship to prevailing plasma glucose concentrations.
(A) Insulin secretion rate in 66 patients with type 2 diabetes at baseline, after a single dose of empagliflozin, and following 4 weeks of chronic empagliflozin administration during 3 hours of fasting and 5 hours after mixed meal ingestion. (B) The data in A are plotted against the corresponding plasma glucose concentrations (compare with Figure 2): the mean slopes of the fitting lines measure β cell glucose sensitivity. Plots represent mean ± SEM.
Table 3.
β Cell function parametersA

Figure 4. Glucagon, GLP-1, and FFA response.
Plasma glucagon, GLP-1, and FFA concentrations in 66 patients with type 2 diabetes at baseline, after a single dose of empagliflozin, and following 4 weeks of chronic empagliflozin administration during 3 hours of fasting and 5 hours after mixed meal ingestion. Plots represent mean ± SEM.
During the period after meal ingestion, 61 g oral glucose had appeared in the systemic circulation by the end of 5 hours (Table 4), at which time oral glucose was still appearing at a rate of approximately 5 μmol•kgFFM–1•min–1 (Figure 5A). As glycosuria was negligible (Table 5), body tissue disposal was almost entirely attributable to the sum of oral (61 g) and endogenous glucose (34 g); oxidation and nonoxidative glucose disposal contributed in an approximate ratio of 1:2.5 (Figure 6). Insulin sensitivity — as the ratio of mean glucose metabolic clearance rate (MCR) to mean insulin concentration during meal absorption — was severely impaired, its value being only one-third of that of lean nondiabetic subjects (24 ml•kgFFM–1•min–1•nM–1) fed the same meal (20). Meal-induced thermogenesis averaged 12% (Figure 7).
Table 4.
Glucose fluxes in the fasting state and during the meal (5 hours)A
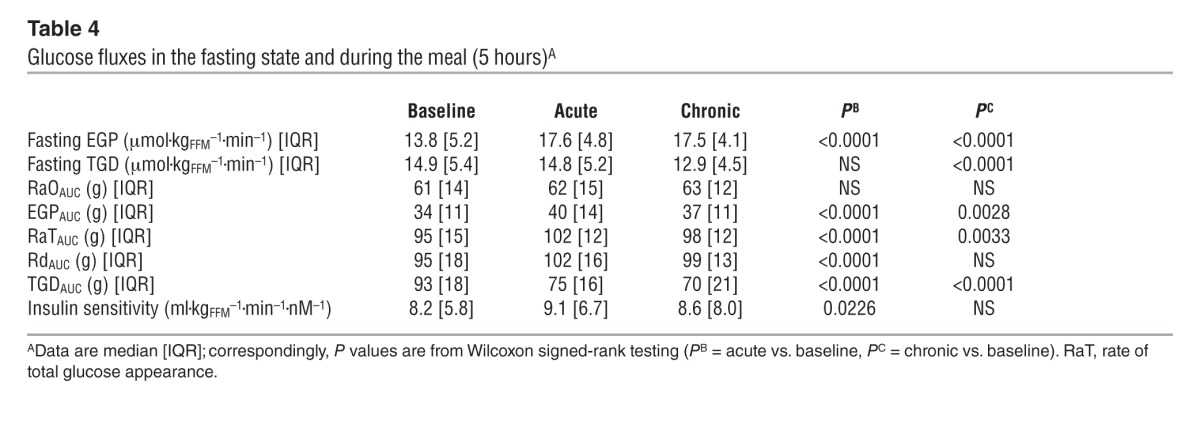
Figure 5. Rates of appearance of oral and endogenous glucose.
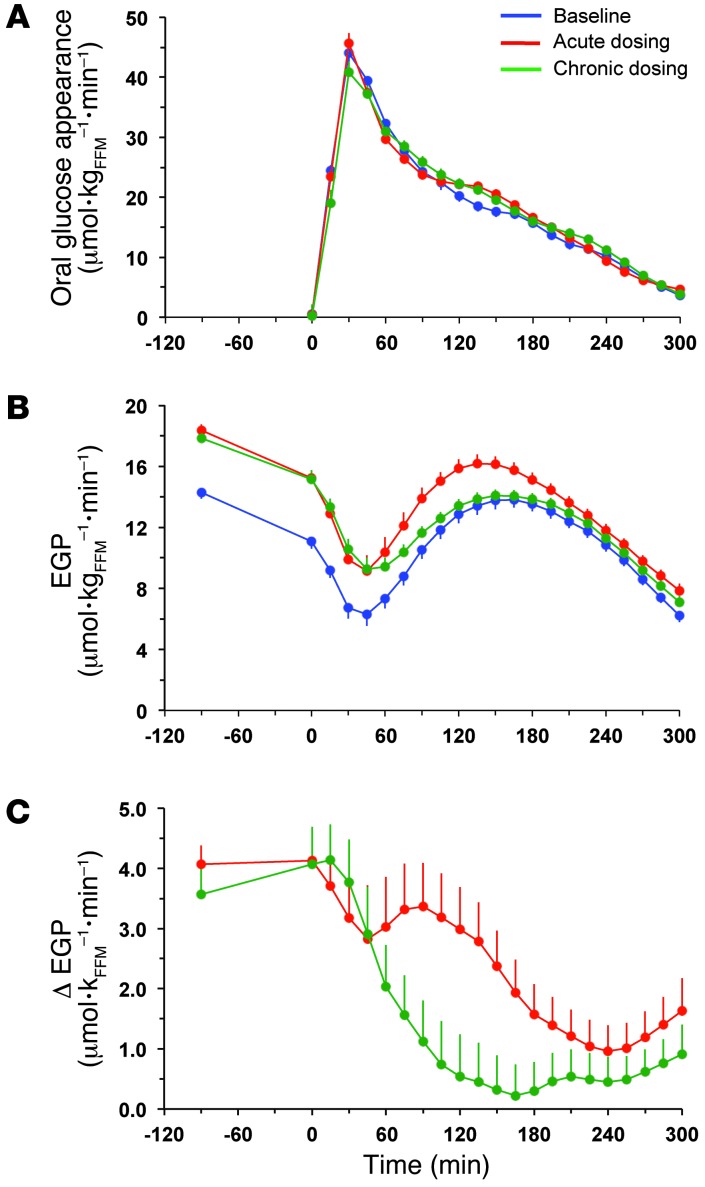
(A) Rates of oral glucose appearance in patients with type 2 diabetes during the baseline study, after a single dose (acute study), and after 28 days of empagliflozin dosing (chronic study). (B) EGP in patients with type 2 diabetes during the baseline study, after a single dose, and after 28 days of empagliflozin dosing. (C) Point-by-point difference in EGP between the acute (red line) or chronic (green line) study and the baseline study in patients with type 2 diabetes. Plots represent mean ± SEM.
Table 5.
UGE and substrate oxidation ratesA
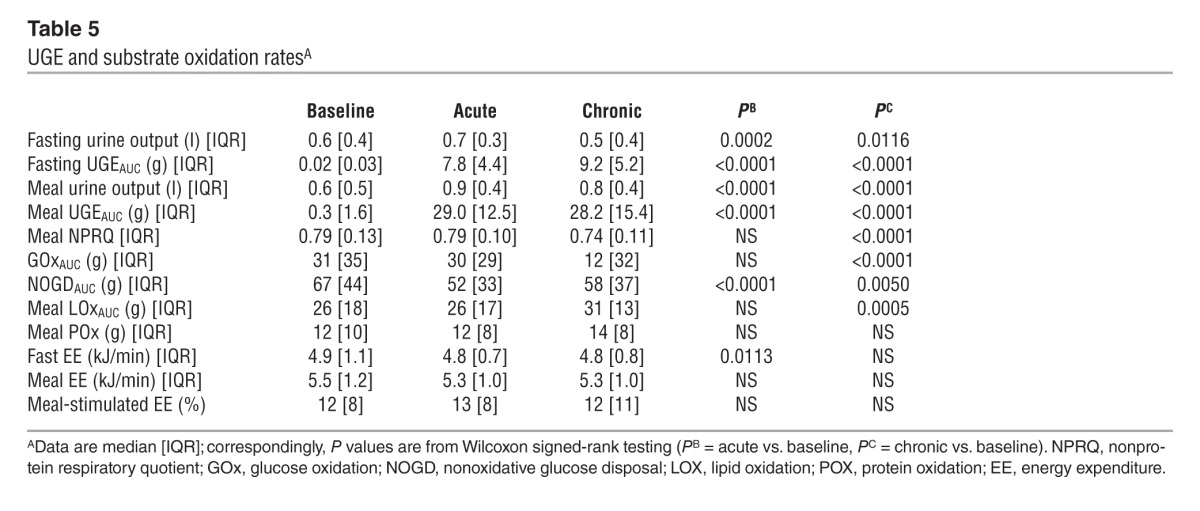
Figure 6. Partition of glucose disposal.
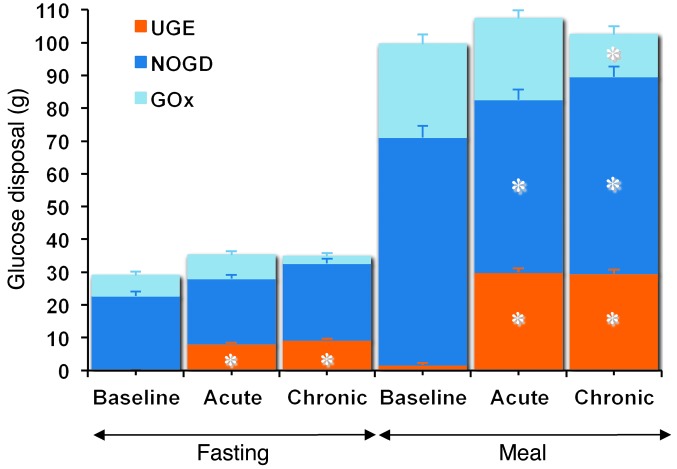
The stacked columns show the partition of total glucose disposal into glucose oxidation (GOx), nonoxidative glucose disposal (NOGD), and UGE during the fasting period (–180 to 0 minutes) and the period after meal ingestion (0 to 300 minutes) in patients with type 2 diabetes during the baseline study, after a single dose (acute study), and after 28 days of empagliflozin dosing (chronic study). Plots represent mean ± SEM. The asterisks indicate statistically significant differences from baseline (exact P values are given in Table 5).
Figure 7. Resting energy expenditure and that after meal ingestion.
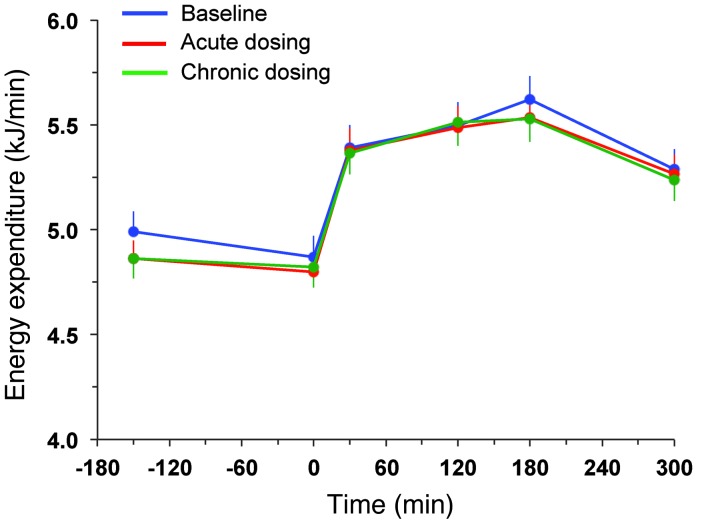
Rates of energy expenditure during 3 hours of fasting and 5 hours after mixed meal ingestion in patients with type 2 diabetes during the baseline study, after a single dose (acute study), and after 28 days of empagliflozin dosing (chronic study). Plots represent mean ± SEM.
Acute study.
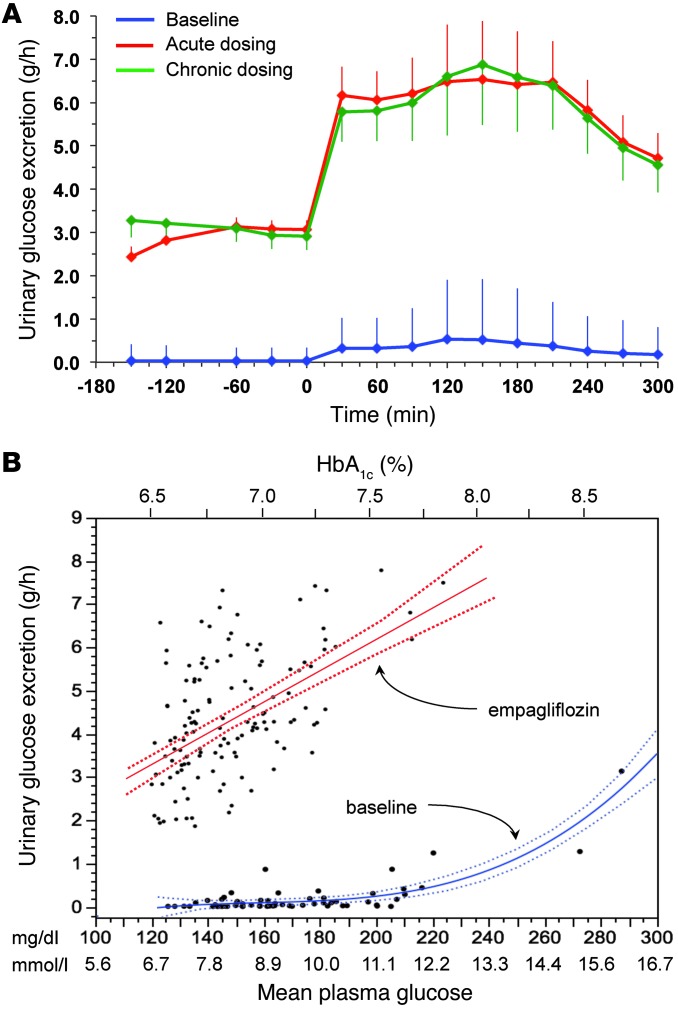
After a single first dose of 25 mg empagliflozin, patients excreted an average of 8 g glucose into the urine over the subsequent 3 hours of fasting and 29 g over the 5-hour period after meal ingestion (Figure 8 and Table 5). Fasting plasma glucose levels (before drug administration) were similar to the corresponding values of the baseline study, but at time 0 — i.e., after 3 hours of fasting — glycemia had dropped by 2.2 ± 0.9 mmol/l, a significantly (P < 0.0001) greater change than that seen in the baseline study (Δ = 0.9 ± 0.7 mmol/l) (Table 1). As plasma insulin decreased more than plasma glucagon, their prehepatic molar concentration ratio at time 0 was significantly decreased as compared with that at baseline (from 9 [IQR, 5] to 7 [IQR, 4] mol/mol, P < 0.0001).
Figure 8. UGE.
(A) Time course of UGE during the fasting period (–180 to 0 minutes) and the period after meal ingestion (0 to 300 minutes) in patients with type 2 diabetes during the baseline study, after a single dose (acute study), and after 28 days of empagliflozin dosing (chronic study). Data were averaged over 30-minute time intervals and expressed as grams per hour. Plots represent mean ± SD. (B) The glucose excretion data in A are plotted against the corresponding mean plasma glucose concentration during the corresponding periods of urine collection (n = 66) for the baseline study (blue lines) and the 2 studies after dosing (n = 132); the latter were combined because they were fully overlapping (red lines). The blue lines are the quadratic polynomial fit and its 95% confidence intervals for the baseline data, and the red lines are the linear fit and its 95% confidence interval for the empagliflozin studies. The top x axis indicates HbA1c levels corresponding to the mean plasma glucose concentrations on the bottom x axis, derived by linear correlation of the entire data set.
Over the postprandial period, the area under the glucose curve was significantly reduced (by 12%), as were the plasma insulin and total insulin secretory responses (Tables 2 and 3). In contrast, the plasma glucagon response was increased (Figure 4), whereby the estimated prehepatic insulin-to-glucagon ratio was decreased, as compared with that at baseline (Figure 3). Fasting EGP was increased by approximately 30%, and EGP was also greater throughout meal absorption (Table 4 and Figure 5B), the difference from the baseline study being greater than 0 at all time points (Figure 5C). Whereas appearance of oral glucose was similar to that at baseline, tissue glucose disposal (TGD) was 20% reduced — virtually entirely due to a fall in nonoxidative glucose disposal (Figure 6) — despite a significant improvement in insulin sensitivity (Table 4). Neither lipid nor protein oxidation was different from those at baseline. Resting energy expenditure and meal-induced thermogenesis were superimposable on the baseline values. With regard to β cell function, glucose sensitivity was improved and total insulin output was decreased, while potentiation and rate sensitivity did not change (Table 3). The GLP-1 response to the meal was enhanced, while meal-induced FFA suppression was significantly blunted (Table 2 and Figure 4).
Chronic study.
After 4 weeks of treatment, 25 mg empagliflozin caused fasting and after meal glycosuria, which were similar in quantity and time course to the acute study (Figure 7 and Table 5). As compared to the baseline study, HbA1c, fasting, and mean glucose levels after meal ingestion were all significantly decreased (Tables 1 and 2). The fasting plasma insulin concentration and the insulin response to the meal were reduced, whereas the glucagon response was still increased, though somewhat less than during the acute study. As a consequence, the estimated prehepatic insulin-to-glucagon ratio was reduced as compared with that at baseline. As was the case in the acute study, both fasting and EGP after meal ingestion were higher than in the baseline study, although differences after meal ingestion were attenuated (Figure 5C). Appearance of oral glucose was comparable to that at baseline and the acute study. TGD was decreased in the fasting state as well as throughout the meal, with both glucose oxidation and nonoxidative glucose disposal contributing to the decrease (Table 4). The decrease in glucose oxidation was matched by an increase in lipid oxidation, with no change in protein oxidation or meal-related energy expenditure (Table 5 and Figures 6 and 7).
Insulin sensitivity was numerically — but not statistically significantly — improved as compared to baseline, whereas β cell glucose sensitivity was enhanced to a similar extent as in the acute study; neither potentiation nor rate sensitivity was different.
The GLP-1 response still appeared somewhat enhanced (though not significantly), and FFA suppression was still impaired. It is of note that insulin clearance was significantly increased following both acute and chronic empagliflozin administration (Table 2).
Discussion
The major new observation of this study is that enhancing glycosuria with a single dose of the SGLT2-inhibitor, empagliflozin, led to a reduction in insulin secretion and TGD and a rise in EGP. Despite the fall in insulin secretion, β cell function was improved; in the face of lower insulin concentrations, insulin sensitivity of tissue glucose uptake also was improved. Because empagliflozin does not directly affect either β cell function or tissue glucose utilization, the current results demonstrate that lowering glucose levels can rapidly, though partially, relieve the glucose toxicity of patients with type 2 diabetes, confirming previous findings in rodents (4).
In this cohort of patients with well-controlled type 2 diabetes with preserved renal function, a single 25-mg dose of empagliflozin — administered after an overnight fast — induced substantial glycosuria (8 g) over the subsequent 3 hours of fasting. This elicited a rise in EGP that averaged 7 g over those 3 hours, thereby exactly balancing the glucose lost through the urine and accounting for the reduction in plasma glucose concentrations. It can be calculated that, had the rise in EGP not occurred, the same glycosuria would have caused fasting glycemia to fall to 4.7 mmol/l instead of the observed 6.7 mmol/l, i.e., to normoglycemic levels. Signals for this immediate EGP response presumably were the changes in glycemia, the drop in the estimated prehepatic insulin-to-glucagon ratio (from 9 [IQR, 5] to 7 [IQR, 4] mol/mol), the prompt rise in circulating FFA levels (which may enhance gluconeogenesis; refs. 22, 23), and, possibly, yet unidentified factors.
In response to the meal, empagliflozin caused marked glycosuria (29 g over 5 hours), which led to a significant decrease in glycemic excursions but also to a reduction in the insulin secretory response and an augmentation of the glucagon response, such that the prehepatic insulin-to-glucagon concentration ratio decreased by 25%. While the lower insulin response is easily explained by the lower glucose levels — which remain the main driver of insulin secretion under all circumstances — multiple factors could contribute to the relative hyperglucagonemia. Both hyperglycemia — by a direct action on the α cell — and increased insulin release — through a paracrine mechanism (24) — restrain glucagon release, but we cannot rule out the participation of other factors. The mechanism of the heightened GLP-1 response remains undetermined, since acute SGLT2 inhibition was not associated with changes in the appearance of oral glucose that would indicate changes in gastric emptying (such as occurs, for example, following gastric bypass surgery; ref. 20). Conversely, there is good evidence that GLP-1 changes within the normal range play no role in the regulation of gastric emptying (25). It is of interest that the greater GLP-1 response, though small (∼20%), should have suppressed glucagon release. With regard to this, growing evidence suggests colocalization and cosecretion of multiple hormones by intestinal cells (26–28).
The makeover of the hormonal milieu following meal-related glycosuria — less insulin, more glucagon, and more GLP-1 — had important metabolic consequences. First, suppression of EGP during meal absorption was significantly blunted, amounting to an extra approximately 6 g of glucose added to the systemic circulation as compared with the control study. Second, the concomitant fall in plasma glucose and insulin concentrations caused a drop in TGD of approximately 18 g over 5 hours, almost entirely accounted for by a decrease in nonoxidative glucose utilization. It can therefore be calculated that, had EGP and TGD remained unaltered in the face of glycosuria, glucose levels after meal ingestion would have decreased by approximately 50% instead of the observed 12%. However, the efficiency of insulin-mediated glucose disposal, as estimated by the ratio of metabolic glucose clearance to insulin levels, was significantly, though only marginally, improved. Third, when viewed in the context of the prevailing glucose levels, insulin secretion was enhanced by approximately 25%. Both the increased GLP-1 response and the reduction of hyperglycemia were likely mechanisms underlying this acute improvement in β cell glucose sensitivity. There was, however, no significant change in either potentiation or rate sensitivity, indicating an overall limited impact on β cell function. Finally, it is of note that the acute deficit of glucose as a substrate did not translate into a higher oxidative use of either lipid or protein substrates, as the energy derived from glucose oxidation was maintained. Thus, there was only a minimal decrement in fasting energy expenditure, without any impairment of meal-induced thermogenesis.
After chronic treatment, the effect of a morning dose of empagliflozin on fasting and glycosuria after meal ingestion was superimposable on that seen following the first dose. This is explained by the fact that the renal glucose threshold, which at baseline marked the appearance of glycosuria at plasma glucose concentrations above approximately 11.1 mmol/l, was shifted to levels well within the normoglycemic range (Figure 8B). This is the expected consequence of a partial inhibition of tubular glucose reabsorption, extending throughout the range of plasma and intraluminal glucose concentrations, induced by competitive binding of empagliflozin to tubular SGLT2 (29). This finding has clinical relevance, in that little weakening of the primary effect of SGLT2 inhibition is to be expected as plasma glucose levels decrease with chronic treatment. Also, both acutely and chronically, the observed glycosuria amounted to a deficit of approximately 20% of the calorie content of the meal.
After 4 weeks of treatment, both HbA1c and fasting glucose levels declined significantly, and postprandial glucose exposure was reduced to a similar extent as with single-dose administration in concomitance with even lower peripheral plasma insulin levels (Table 2). The physiological adaptation to chronic drug-induced glycosuria was qualitatively similar to that seen after the first empagliflozin administration, with a few differences. While fasting EGP was increased to a similar extent, the excess EGP during the meal was somewhat blunted, amounting to only 3 g over 5 hours. Correspondingly, the glucagon response also was attenuated, and the GLP-1 response was no longer different from baseline. The improvement in β cell function was similar to that in the acute study, and estimated insulin sensitivity was at least maintained as compared to baseline. The main difference consisted of a larger decrement in TGD — now affecting both nonoxidative glucose disposal (as in the acute study) and glucose oxidation — as a joint result of prolonged reductions in insulin output and glucose levels (30). As a consequence, energy expenditure was maintained at the cost of a rise in lipid oxidation, which was paralleled (and supported) by higher FFA concentrations (AUCFFA: 94 ± 33 vs. 86 ± 29 mEq•l–1•h, P < 0.01).
In summary, pharmacological blockade of renal glucose reabsorption does reduce fasting and postprandial glycemia both acutely and chronically without causing hypoglycemia, confirming the potential use of empagliflozin as a glucose-lowering agent in patients with type 2 diabetes (18). As expected from studies in experimental diabetes (4), both β cell function and insulin sensitivity are improved, though the full extent of such changes probably requires longer drug exposure with additional relief of glucotoxicity. Pharmacologically induced glycosuria does not alter the appearance of oral glucose (or, presumably, gastric emptying) but results in a compensatory increase in endogenous glucose release and lower tissue glucose uptake as a consequence of lower glucose and insulin levels and higher glucagon levels. In the longer term, the attendant deficit of glucose oxidation is made up for by extra lipid oxidation, thereby maintaining energy balance. Whereas enhanced oxidative lipid utilization — along with the calorie deficit induced by urinary glucose loss — is expected to eventually lead to reduced fat mass (31), it is relevant to observe that treatment with empagliflozin does not result in reduced rates of energy expenditure or a blunted thermogenic effect of feeding. Therefore, the observation in longer-term clinical trials that weight loss is less than predicted by glycosuria suggests that this form of treatment stimulates calorie intake (32).
One limitation of this study is the absence of a control group made up of nondiabetic subjects or patients with type 2 diabetes matched for changes in glucose control or energy deficit. However, the current observations were made in patients with type 2 diabetes with a rather typical clinical phenotype, in whom SGLT2 inhibition, especially as an add on to metformin, would presumably represent a viable approach to achieving target glycemic control.
Methods
Study population.
Sixty-six patients with type 2 diabetes (32 drug-naive patients or patients off any glucose-lowering agent for at least 12 weeks, and 34 patients on a stable dose of metformin of at least 1,500 mg/d for at least 12 weeks) were recruited into the study (Figure 1). Inclusion criteria were sex, age >18 years, BMI between 20 and 40 kg/m2, and HbA1c between 47.5 and 14.1 mmol/mol (6.5%–10.5%). Exclusion criteria were history of malignancy in the last 5 years, marked cardiovascular disorder within the last 6 months, pregnancy or the expectation of conception within the study duration, bariatric surgery within the past 2 years, treatment with antiobesity drugs in the last 3 months, impaired renal function defined as an EGFR <60 ml•min–1•1.73m–2, neurogenic bladder disorders, ALT and AST >3.0xULN, changes in thyroid hormone dosage within 6 weeks, presence of any other endocrine disease except type 2 diabetes, and alcohol or drug abuse.
Study design and protocol.
Patients with type 2 diabetes received empagliflozin in an open-label design; each subject underwent 3 studies: baseline, acute (first single dose of 25 mg empagliflozin), and chronic (28 days of 25 mg/d empagliflozin). Each study consisted of a 5-hour meal tolerance test following a 3-hour basal period combined with a double-tracer technique, as described previously (33). A primed-constant infusion of [6,6-2H2]-glucose (0.28 μmol•min–1•kg–1; prime 28 μmol•kg–1x/5), where x stands for fasting plasma glucose in mmol/l, was administered throughout the test, starting at time point –180 minutes. At time 0, subjects ingested (in <10 minutes) a meal consisting of 1 egg, 50 g parmesan cheese, 50 g white bread, and 75 g glucose in water labeled with 1.5 g [U-13C]-glucose (total calorie content, 710 kcal; 58% carbohydrate; 24% fat; 18% protein). Indirect calorimetry was performed for periods of 30 minutes at fixed intervals (–150 to –120 minutes and –60 to –30 minutes in the fasting state as well as 30 to 60 minutes, 90 to 120 minutes, 150 to 180 minutes, and 270 to 300 minutes after meal ingestion). Urine was collected separately during the basal period and during the meal, total volume was recorded for each period, and samples were immediately frozen for glucose and urea measurements. In both the acute and chronic study, empagliflozin was ingested 30 minutes before starting tracer infusion (i.e., at time –210 minutes). During each study, subjects drank 500 ml water at time –210 minutes and were allowed ad lib water thereafter.
Measurements.
All measurements were performed at a central laboratory (Metabolism Section, Department of Clinical and Experimental Medicine, University of Pisa). For all analytical determinations, samples from the baseline, acute, and chronic study of each study subject were assayed together in order to reduce intrasubject variability. Tracer enrichments of 6,6-[2H2]-glucose and [U-13C]-glucose were measured by gas chromatography/mass spectrometry (on a Finnigan Trace GC/DSQ, Thermo Electron Corporation) using electron impact ionization and selective ion monitoring at mass-to-charge ratios (m/e) 202/200 and 205/200, respectively (33).
Plasma and urine glucose concentrations were measured by a chemical enzymatic method on a Synchron clinical system CX4 (Beckman Instruments). Plasma insulin and C-peptide were assayed by chemiluminescence (on a COBAS e411 instrument, Roche). Glucagon was measured by radioimmunoassay, and total C-terminal amidated GLP-1 was measured by ELISA (Millipore Corporation). FFAs were measured by a chemical enzymatic method on a Synchron clinical system CX4 (Beckman Instruments).
Calculations.
Glucose fluxes were expressed per kg of fat-free mass (FFM), which was estimated using the allometric equation of Watson et al. (34). Glucose clearance rate and fluxes were computed using the circulatory model (35); the model has been validated in rats (35) and applied in human studies of intravenous glucose (36, 37) or mixed meal administration (38) using glucose kinetic parameters derived from human studies. Briefly, from the known infusion rate of 6,6-[2H2] glucose and the calculated glucose concentration component originating from this source, glucose clearance was obtained from the model. Once clearance was determined, the model allows calculation of the glucose rate of appearance from the glucose concentration components. Thus, EGP (μmol•min–1kgFFM–1) was calculated from the endogenous glucose component and oral glucose appearance (RaO; μmol•min–1kgFFM–1) was calculated from the oral glucose component. The total rate of glucose appearance was obtained as the sum of EGP and RaO. Of note, RaO only represents the systemic appearance of ingested free glucose, because only this part of the ingested carbohydrate could be labeled. Therefore, the appearance of bread-derived glucose was imputed to EGP, which consequently showed (Figure 5B) a rise after the first 60 minutes of after meal suppression (the same meal without bread shows a more prolonged suppression of EGP, e.g., Figure 5 in ref. 20). This choice is justified as follows: (a) the meal with bread totals 710 kcal and is closer to a real meal; (b) the same meal was given basally, acutely, and chronically; (c) RaO was virtually superimposable among the 3 studies (Figure 5A), suggesting no difference in gastric emptying and, by extension, in the digestion of the bread; and (d) the presence of bread obviously does not affect fasting EGP, which is the condition under which the difference in EGP from baseline is highest (Figure 5C).
Whole-body glucose utilization (or rate of disappearance; μmol•min–1kgFFM–1) was obtained as the product of clearance and total glucose concentration. For ease of comparison with common units of urinary glucose excretion (UGE), time-integrated glucose fluxes were expressed in grams.
The prehepatic insulin-to-glucagon molar concentration ratio (I/Glg) was estimated by the following formula: {ISR(t)/hPF + [I(t)]}/{[Glg(t)] × (1 + MCRGlg/hPF)}, where ISR(t) is the insulin secretion rate at time t, hPF is hepatic plasma flow; [I(t)] and [Glg(t)] are the measured (peripheral) plasma concentrations of insulin and glucagon at time t, respectively; and MCRGlg is the MCR of glucagon. hPF was estimated by multiplying the cardiac index (3.2 l•min–1•m–2) (39) by a plasma-to-blood ratio of 0.6 and by assuming that hepatic blood flow is 30% of cardiac index (0.576 l•min–1•m–2) (40). MCRGlg was taken to be 0.537 l•min–1•m–2 (41).
Peripheral insulin sensitivity was estimated as the ratio of the average glucose MCR during the 5 hours after meal ingestion to the corresponding mean plasma insulin concentration. UGE was calculated as the product of urine volume and urine glucose concentration and was subtracted from the rate of total glucose disappearance (Rd) to obtain TGD rate. MCR of glucose (MCR; ml•min–1kgFFM–1) was calculated as the ratio of TGD to mean plasma glucose concentration over corresponding period of time. Glucose oxidation rate, lipid oxidation rate, protein oxidation rate, and energy expenditure were obtained from indirect calorimetry measurements, as previously described (42). Nonoxidative glucose disposal was calculated as the difference between TGD and glucose oxidation.
Areas under time-concentration curves (AUC) were calculated (by the trapezium rule) for the 3-hour basal fasting period and the 5-hour period after meal ingestion. Glucose concentration and flux AUCs were expressed in g/dl and g, respectively, to allow a rapid comparison with UGE, which is more often expressed in weight (g) rather than molar units (mmol).
β Cell function modeling.
The model used to reconstruct insulin secretion and its control by glucose has been previously described (43). In brief, the model consists of three blocks: (a) a model for fitting the glucose concentration profile, the purpose of which is to smooth and interpolate plasma glucose concentrations; (b) a model describing the dependence of insulin (or C-peptide) secretion on glucose concentration; and (c) a model of C-peptide kinetics, i.e., the 2-exponential model proposed by Van Cauter et al. (44), in which the model parameters are individually adjusted to the subject’s anthropometric data. In particular, with regard to the insulin secretion block, the relationship between insulin release and plasma glucose concentrations is modeled as the sum of 2 components. The first component is the relationship between insulin secretion and glucose concentration, i.e., a dose-response function. The dose-response function is modulated by a time-varying factor, expressing a potentiation effect on insulin secretion. The mean slope of the dose-response function is taken to represent β cell glucose sensitivity. The second insulin secretion component represents a dynamic dependence of insulin secretion on the rate of change of glucose concentration. This component, termed rate sensitivity, accounts for anticipation of insulin secretion as glucose levels rise. Total insulin secretion is the sum of the two components described above and was calculated every 10 minutes for the whole 5-hour period.
Insulin MCR was calculated as the ratio of total insulin secretion (as reconstructed from C-peptide concentrations) to the insulin AUC for corresponding time intervals (45, 46).
Statistics.
Data are given as mean ± SD or median and IQR for normally or nonnormally distributed variables, respectively. Acute and chronic treatment responses were analyzed by paired t test or Wilcoxon signed-rank test, depending on the underlying data distribution. P values were Bonferroni adjusted for double comparison. A 2-tailed P value of equal to or less than 0.05 was considered statistically significant. All analyses were carried out using JMP 7.0.
Study approval.
The study was carried out at two sites (University of Pisa School of Medicine and Profil) and according to the Declaration of Helsinki and the International Conference on Harmonization Good Clinical Practice principles. The protocol was approved by the Institutional Review Board at each participating site. All participants provided informed written consent.
Acknowledgments
This study was presented at the 73rd Scientific Sessions of the American Diabetes Association, Chicago, Illinois, USA, 21–25 June 2013 (abstract LB#71). The authors thank the patients and staff who participated in this study.
Footnotes
Conflict of interest: This study was sponsored by Boehringer Ingelheim. Ele Ferrannini has served as an ad hoc consultant and occasional speaker for Boehringer Ingelheim, Merck & Co., Sanofi, Eli Lilly and Co., Johnson & Johnson, Astellas, Daiichi Sankyo, Bristol-Myers Squibb/AstraZeneca, and Novartis. Andrea Mari has received research grants from Eli Lilly and Co. and Novo Nordisk. Tim Heise is an employee of Profil. Uli C. Broedl and Hans-Juergen Woerle are employees of Boehringer Ingelheim.
Citation for this article: J Clin Invest. 2013;124(2):499–508. doi:10.1172/JCI72227.
See the related Commentary beginning on page 485.
References
- 1.Wright EM, Loo DD, Hirayama BA. Biology of human sodium glucose transporters. Physiol Rev. 2011;91(2):733–794. doi: 10.1152/physrev.00055.2009. [DOI] [PubMed] [Google Scholar]
- 2.Hummel CS, Lu C, Loo DD, Hirayama BA, Voss AA, Wright EM. Glucose transport by human renal Na+/D-glucose cotransporters SGLT1 SGLT2. Am J Physiol Cell Physiol. 2011;300(1):C14–C21. doi: 10.1152/ajpcell.00388.2010. [DOI] [PMC free article] [PubMed] [Google Scholar]
- 3.Turner JM, Silverman M. Sugar uptake into brush border vesicles from normal human kidney. Proc Natl Acad Sci U S A. 1977;74(7):2825–2829. doi: 10.1073/pnas.74.7.2825. [DOI] [PMC free article] [PubMed] [Google Scholar]
- 4.Rossetti L, Smith D, Shulman GI, Papachristou D, DeFronzo RA. Correction of hyperglycemia with phlorizin normalizes tissue sensitivity to insulin in diabetic rats. J Clin Invest. 1987;79(5):1510–1515. doi: 10.1172/JCI112981. [DOI] [PMC free article] [PubMed] [Google Scholar]
- 5.Yki-Järvinen H. Glucose toxicity. Endocr Rev. 1992;13(3):415–31. doi: 10.1210/edrv-13-3-415. [DOI] [PubMed] [Google Scholar]
- 6.Vallon V, et al. SGLT2 mediates glucose reabsorption in the early proximal tubule. J Am Soc Nephrol. 2011;22(1):104–112. doi: 10.1681/ASN.2010030246. [DOI] [PMC free article] [PubMed] [Google Scholar]
- 7.Jurczak MJ, et al. SGLT2 deletion improves glucose homeostasis preserves pancreatic beta-cell function. Diabetes. 2011;60(3):890–898. doi: 10.2337/db10-1328. [DOI] [PMC free article] [PubMed] [Google Scholar]
- 8.Vallon V, et al. Knockout of Na-glucose transporter SGLT2 attenuates hyperglycemia glomerular hyperfiltration but not kidney growth or injury in diabetes mellitus. Am J Physiol Renal Physiol. 2013;304(2):F156–F167. doi: 10.1152/ajprenal.00409.2012. [DOI] [PMC free article] [PubMed] [Google Scholar]
- 9.Calado J, et al. Familial renal glucosuria: SLC5A2 mutation analysis evidence of salt-wasting. Kidney Int. 2006;69(5):852–855. doi: 10.1038/sj.ki.5000194. [DOI] [PubMed] [Google Scholar]
- 10.Lee H, et al. Familial renal glucosuria: a clinicogenetic study of 23 additional cases. Pediatr Nephrol. 2012;27(7):1091–1095. doi: 10.1007/s00467-012-2109-9. [DOI] [PubMed] [Google Scholar]
- 11.Plosker GL. Dapagliflozin: a review of its use in type 2 diabetes mellitus. Drugs. 2012;72(17):2289–2312. doi: 10.2165/11209910-000000000-00000. [DOI] [PubMed] [Google Scholar]
- 12.Paisley AJ, Yadav R, Younis N, Rao-Balakrishna P, Soran H. Dapagliflozin: a review on efficacy, clinical effectiveness and safety. Expert Opin Investig Drugs. 2013;22(1):131–140. doi: 10.1517/13543784.2013.740009. [DOI] [PubMed] [Google Scholar]
- 13.Devineni D, et al. Pharmacokinetics and pharmacodynamics of canagliflozin, a sodium glucose co-transporter 2 inhibitor, in subjects with type 2 diabetes mellitus. J Clin Pharmacol. 2013;53(6):601–610. doi: 10.1002/jcph.88. [DOI] [PubMed] [Google Scholar]
- 14.Nagata T, et al. Selective SGLT2 inhibition by tofogliflozin reduces renal glucose reabsorption under hyperglycemic but not under hypo- or euglycemic conditions in rats. Am J Physiol Endocrinol Metab. 2013;304(4):E414–E423. doi: 10.1152/ajpendo.00545.2012. [DOI] [PubMed] [Google Scholar]
- 15.Tahara A, et al. Antidiabetic effects of SGLT2-selective inhibitor ipragliflozin in streptozotocin-nicotinamide-induced mildly diabetic mice. J Pharmacol Sci. 2012;120(1):36–44. doi: 10.1254/jphs.12089FP. [DOI] [PubMed] [Google Scholar]
- 16.Heise T, et al. Safety, tolerability, pharmacokinetics and pharmacodynamics following 4 weeks’ treatment with empagliflozin once daily in patients with type 2 diabetes. Diabetes Obes Metab. 2013;15(7):613–621. doi: 10.1111/dom.12073. [DOI] [PubMed] [Google Scholar]
- 17.Zambrowicz B, et al. LX4211, a dual SGLT1/SGLT2 inhibitor, improved glycemic control in patients with type 2 diabetes in a randomized, placebo-controlled trial. Clin Pharmacol Ther. 2012;92(2):158–169. doi: 10.1038/clpt.2012.58. [DOI] [PMC free article] [PubMed] [Google Scholar]
- 18.Ferrannini E, Solini A. SGLT2 inhibition in diabetes mellitus: rationale clinical prospects. Nat Rev Endocrinol. 2012;8(8):495–502. doi: 10.1038/nrendo.2011.243. [DOI] [PubMed] [Google Scholar]
- 19.Muscelli E, et al. Mechanisms for the antihyperglycemic effect of sitagliptin in patients with type 2 diabetes. J Clin Endocrinol Metab. 2012;97(8):2818–2826. doi: 10.1210/jc.2012-1205. [DOI] [PubMed] [Google Scholar]
- 20.Camastra S, et al. Long-term effects of bariatric surgery on meal disposal and β-cell function in diabetic and nondiabetic patients. Diabetes. 2013;62(11):3709–3717. doi: 10.2337/db13-0321. [DOI] [PMC free article] [PubMed] [Google Scholar]
- 21.Ferrannini E, et al. Natural history and physiological determinants of changes in glucose tolerance in a non-diabetic population: the RISC Study. Diabetologia. 2011;54(6):1507–1516. doi: 10.1007/s00125-011-2112-x. [DOI] [PubMed] [Google Scholar]
- 22.Ferrannini E, Barrett EJ, Bevilacqua S, DeFronzo RA. Effect of fatty acids on glucose production and utilization in man. J Clin Invest. 1983;72(5):1737–1747. doi: 10.1172/JCI111133. [DOI] [PMC free article] [PubMed] [Google Scholar]
- 23.Gastaldelli A, et al. Influence of obesity and type 2 diabetes on gluconeogenesis glucose output in humans: a quantitative study. Diabetes. 2000;49(8):1367–1373. doi: 10.2337/diabetes.49.8.1367. [DOI] [PubMed] [Google Scholar]
- 24.Maruyama H, Hisatomi A, Orci L, Grodsky GM, Unger RH. Insulin within islets is a physiologic glucagon release inhibitor. J Clin Invest. 1984;74(6):2296–2299. doi: 10.1172/JCI111658. [DOI] [PMC free article] [PubMed] [Google Scholar]
- 25.Nicolaus M, Brödl J, Linke R, Woerle HJ, Göke B, Schirra J. Endogenous GLP-1 regulates postprandial glycemia in humans: relative contributions of insulin, glucagon, gastric emptying. J Clin Endocrinol Metab. 2011;96(1):229–236. doi: 10.1210/jc.2010-0841. [DOI] [PubMed] [Google Scholar]
- 26.Nilsson O, Bilchik AJ, Goldenring JR, Ballantyne GH, Adrian TE, Modlin IM. Distribution and immunocytochemical colocalization of peptide YY and enteroglucagon in endocrine cells of the rabbit colon. Endocrinology. 1991;129(1):139–148. doi: 10.1210/endo-129-1-139. [DOI] [PubMed] [Google Scholar]
- 27.Habib AM, et al. Overlap of endocrine hormone expression in the mouse intestine revealed by transcriptional profiling and flow cytometry. Endocrinology. 2012;153(7):3054–3065. doi: 10.1210/en.2011-2170. [DOI] [PMC free article] [PubMed] [Google Scholar]
- 28.Habib AM, Richards P, Rogers GJ, Reimann F, Gribble FM. Co-localisation and secretion of glucagon-like peptide 1 and peptide YY from primary cultured human L cells. Diabetologia. 2013;56(6):1413–1416. doi: 10.1007/s00125-013-2887-z. [DOI] [PMC free article] [PubMed] [Google Scholar]
- 29.Liu JJ, Lee T, DeFronzo RA. Why Do SGLT2 inhibitors inhibit only 30-50% of renal glucose reabsorption in humans? Diabetes. 2012;61(9):2199–2204. doi: 10.2337/db12-0052. [DOI] [PMC free article] [PubMed] [Google Scholar]
- 30.Woerle HJ, et al. Mechanisms for abnormal postprandial glucose metabolism in type 2 diabetes. Am J Physiol Endocrinol Metab. 2006;290(1):E67–E77. doi: 10.1152/ajpendo.00529.2004. [DOI] [PubMed] [Google Scholar]
- 31.Bolinder J, et al. Diabetes Obes Metab. Dapagliflozin maintains glycaemic control while reducing weight and body fat mass over 2 years in patients with type 2 diabetes mellitus inadequately controlled on metformin [published online ahead of print August 1, 2013]. doi: 10.1111/dom.12189 . [DOI] [PubMed] [Google Scholar]
- 32.Vasilakou D, et al. Sodium-glucose cotransporter 2 inhibitors for type 2 diabetes: A systematic review meta-analysis. Ann Intern Med. 2013;159(4):262–274. doi: 10.7326/0003-4819-159-4-201308200-00007. [DOI] [PubMed] [Google Scholar]
- 33.Gastaldelli A, et al. Effect of pioglitazone on the metabolic and hormonal response to a mixed meal in type II diabetes. Clin Pharmacol Ther. 2007;81(2):205–212. doi: 10.1038/sj.clpt.6100034. [DOI] [PubMed] [Google Scholar]
- 34.Watson PE, Watson ID, Batt RD. Total body water volumes for adult males and females estimated from simple anthropometric measurements. Am J Clin Nutr. 1980;33(1):27–39. doi: 10.1093/ajcn/33.1.27. [DOI] [PubMed] [Google Scholar]
- 35.Mari A, Stojanovska L, Proietto J, Thorburn AW. A circulatory model for calculating non-steady-state glucose fluxes. Validation and comparison with compartmental models. Comput Methods Programs Biomed. 2003;71(3):269–281. doi: 10.1016/S0169-2607(02)00097-4. [DOI] [PubMed] [Google Scholar]
- 36.Natali A, et al. Dose-response characteristics of insulin action on glucose metabolism: a non-steady-state approach. Am J Physiol Endocrinol Metab. 2000;278(5):E794–E801. doi: 10.1152/ajpendo.2000.278.5.E794. [DOI] [PubMed] [Google Scholar]
- 37.Bonuccelli S, et al. Improved tolerance to sequential glucose loading (Staub-Traugott effect): size and mechanisms. Am J Physiol Endocrinol Metab. 2009;297(2):E532–E537. doi: 10.1152/ajpendo.00127.2009. [DOI] [PubMed] [Google Scholar]
- 38.Polidori D, et al. Canagliflozin lowers postprandial glucose and insulin by delaying intestinal glucose absorption in addition to increasing urinary glucose excretion: results of a randomized, placebo-controlled study. Diabetes Care. 2013;36(8):2154–2161. doi: 10.2337/dc12-2391. [DOI] [PMC free article] [PubMed] [Google Scholar]
- 39.Taylor HL, Tiede K. A comparison of the estimation of the basal cardiac output from a linear formula and the cardiac index. J Clin Invest. 1952;31(2):209–216. doi: 10.1172/JCI102594. [DOI] [PMC free article] [PubMed] [Google Scholar]
- 40.Cherrick GR, Stein SW, Leevy CM, Davidson CS. Indocyanine green: observations on its physical properties, plasma decay, and hepatic extraction. J Clin Invest. 1960;39:592–600. doi: 10.1172/JCI104072. [DOI] [PMC free article] [PubMed] [Google Scholar]
- 41.Fisher M, Sherwin RS, Hendler R, Felig P. Kinetics of glucagon in man: effects of starvation. Proc Natl Acad Sci U S A. 1976;73(5):1735–1739. doi: 10.1073/pnas.73.5.1735. [DOI] [PMC free article] [PubMed] [Google Scholar]
- 42.Ferrannini E. The theoretical bases of indirect calorimetry: a review. Metabolism. 1988;37(3):287–301. doi: 10.1016/0026-0495(88)90110-2. [DOI] [PubMed] [Google Scholar]
- 43.Mari A, Schmitz O, Gastaldelli A, Oestergaard T, Nyholm B, Ferrannini E. Meal and oral glucose tests for assessment of β-cell action: modelling analysis in normal subjects. Am J Physiol Endocrinol Metab. 2002;283(3):E1159–E1166. doi: 10.1152/ajpendo.00093.2002. [DOI] [PubMed] [Google Scholar]
- 44.Van Cauter E, Mestrez F, Sturis J, Polonsky KS. Estimation of insulin secretion rates from C-peptide levels: comparison of individual and standard kinetic parameters for C-peptide clearance. Diabetes. 1992;41(3):368–377. doi: 10.2337/diab.41.3.368. [DOI] [PubMed] [Google Scholar]
- 45.Ferrannini E, et al. The disposal of an oral glucose load in patients with non-insulin-dependent diabetes. Metabolism. 1988;37(1):79–85. doi: 10.1016/0026-0495(88)90033-9. [DOI] [PubMed] [Google Scholar]
- 46.Mari A, Wahren J, DeFronzo RA, Ferrannini E. Glucose absorption and production following oral glucose: comparison of compartmental and arteriovenous-difference methods. Metabolism. 1994;43(11):1419–1425. doi: 10.1016/0026-0495(94)90038-8. [DOI] [PubMed] [Google Scholar]


