

Abstract
The β-galactosidase protein generated by the bacterial LacZ gene is widely used to map gene expression patterns. The ease of its use is only rivaled by green fluorescent protein, which can be used in combination with various other procedures such as immunocytochemistry, flow cytometry, or tract tracing. The β-galactosidase enzymatic reaction provides potentially a more sensitive assay of gene expression than green fluorescent protein. However, the virtual impermeability and tendency to absorb light over a wide range limit the use of the most frequently used β-galactosidase substrate, X-Gal, in combination with other fluorescent labeling procedures. Here, we provide details on a simple photoactivation procedure that transforms the light-absorbing X-Gal product, 5-bromo-4-chloro-3-indolyl (BCI) precipitate, into an intensely fluorescent product excited by 488 and 633 nm light. Photoactivation is achieved through exposure to 730 nm near-infrared light emitted from a femtosecond titanium-doped Sapphire laser. Photoactivation of BCI occurs in tissue sections suspended in buffered saline, glycerol, or even embedded in epoxy resin. A protocol for the use of BCI photoactivation is here provided. Importantly, the BCI photoactivated product is photoswitchable, displaying bistable photochromism. This permits the use of the fluorescent product in a variety of co-localization studies in conjunction with other imaging modalities. As with other bistable and photoswitchable products, the BCI reaction product shows concentration quenching at high density and can be degraded by continuous exposure to intense 730 nm illumination. Therefore, care must be taken in developing imaging strategies. Our findings have implications for the use of X-Gal in gene and protein detection and provide a novel substrate for high density digital information storage.
Keywords: β-Galactosidase, X-Gal reaction, Confocal microscopy, Gene expression, Two photon excitation, Fluorescence
1. Introduction
The bacterial LacZ gene, which encodes the β-galactosidase enzyme, was first described by Jacob and Monod about 40 years ago and has become a principle method to image gene expression [23] including the ROSA-26 line of Cre-reporter expression [15,21]. The enzyme β-galactosidase is only rivaled by green fluorescent protein (GFP) in its use as a marker for gene expression [18]. The substrate of choice that is typically used for the β-galactosidase reaction to reveal gene expression distribution is 5-bromo-4-chloro-3-indolyl β-D-galactopyranoside (X-Gal). Such substrate provides strong staining with a dark blue reaction product through the cleavage of 5-bromo-4-chloro-3-indolyl (BCI) from galactopyranoside. BCI can be easily imaged in transmitted or reflected light, and both in sections and whole-mounted tissue. Several other substrates resulting in red, green or purple modifications of X-Gal have been developed, and fluorescent substrates have been recently introduced [5,6,24]. Even substrates useful for nuclear magnetic resonance (NMR) are now available, increasing the versatility of β-galactosidase [26,29]. However, none of these modifications allows simple timing through direct observation of reaction progression. Such optical control permits fast and easy screening of gene expression using LacZ as a reporter gene.
Disadvantages of the BCI X-Gal reaction product are its sensitivity to organic solvents, such as propylene oxide used for epoxy resin embedding [9], and its tendency to absorb fluorescent light throughout the near UV visible spectrum. This is particularly troublesome when one wants to combine tract tracing with one or more fluorescent lipophilic dyes [13] with the β-galactosidase reaction. Because of these limitations, the diaminobenzidine (DAB) reaction, which is suited to reveal horseradish peroxidase (HRP), is used to turn the second labeling into a brown reaction product that can be imaged together with the blue X-Gal staining [8,9]. However, strong BCI precipitation can even mask imaging of the brown DAB reaction product, and contrast inversion with fluorescence microscopy is needed to convert the absorbance of BCI into a signal. Additional shortcomings of the X-Gal reaction include the inherent difficulty in quantifying the BCI signal and visualizing weak signals [27]. Some of these problems can be overcome by using a mixed substrate that provides a fluorescent product in addition to the X-Gal staining [27], but this reduces the sensitivity as both substrates must compete for the same enzyme. This technique or the use of fluorescent substrate alone can also provide a product that can be used for fluorescent sorting, such as flow cytometry.
We show here that a comparatively simple manipulation using a brief exposure to intense near-infrared Titanium-doped Sapphire (Ti:S) laser light (720–730 nm), raster-scanned within the sample by a multiphoton laser scanning microscope, alters the photochemical properties of the BCI precipitate. As a result of this photoactivation process, instead of absorbing visible light the BCI precipitate becomes a product with a strong and persistent fluorescence emission. This is bistable and photoswitchable between 488 and 633 nm excitation, each with a unique emission spectrum.
The rapid conversion of the BCI precipitate by near-infrared laser exposure presented here improves dramatically the visibility of low levels of BCI and can be easily combined with other epifluorescent signals. This is here demonstrated for the first time for the use of the BCI precipitate in biological systems. However, the bistable photochromism of other indolyl derivatives has been recently exploited for use in digital data storage [12,17]. BCI may also potentially provide material for digital information storage.
2. Materials and methods
2.1. X-Gal reaction for β-galactosidase
We followed the staining for β-galactosidase as originally described [9]. Briefly, our staining solution consisted of 3.632 ml 0.1 M Na2HPO4, 40 μl 0.5 M potassium ferricyanide, 40 μl 0.5 M potassium ferrocyanide, 40 μl of 1% sodium deoxycholate, 8 μl 1 M MgCl2, 40 μl 2% Np-40 and 200 μl X-Gal (60 mg/ml in N,N-dimethyl formamide). Care was taken to add the substances in order with X-Gal (Sigma, St. Louis, MO; Biotium Inc., Hayward, CA) added as the last step.
Mice that carry the LacZ reporter were available from previous studies for the following genes: Bdnf-LacZ and Ntf3-LacZ [8], Atoh1-LacZ [10,19], Neurod1-LacZ [14] and Gata3-LacZ [13]. In addition to whole-mount reacted ears and sections of brains of these mice, we also used sections of X-Gal reactions of ears and brains embedded in epoxy resin. Breeding of mice had been approved by the Creighton University IACUC (#0630). Briefly, adult animals were sacrificed by vertebral dislocation. Embryos older than embryonic day 14.5 were anesthetized with injections of 0.1–0.3 ml of 1% Avertin and perfused transcardially with 4% paraformaldehyde (PFA) in 0.1 M phosphate buffer, followed by immersion of the head in 4% PFA for additional 30 min. Ears and brains were dissected and reacted whole in the X-Gal solution at room temperature on a shaker for 24 h.
We also used other β-galactosidase substrates purchased from Biotium Inc., yielding purple, red or green reflected light colors. No alterations in the excitation/emission spectra of these substrates after photoactivation was found, and we therefore abandoned those alternative substrates. Likewise, we could not elicit significant increase in fluorescence of areas devoid of BCI using the approach described below, thereby eliminating any unspecific effect.
In the present investigation, we used primarily whole ears or subdissected ear epithelia. In addition, we used ear epithelia and brain tissue embedded in epoxy resin and sectioned with glass knives on a Leica RM 2155 microtome at a 1–10 μm thickness to image the distribution of the X-Gal reaction product 5-bromo-4-chloro-3-indolyl precipitate. Whole-mounted tissue was either viewed in 100% glycerol or in phosphate-buffered saline. Whole-mounted ear epithelia were counterstained with Hoechst 33258 (bis-Benzimide) stain (10% in phosphate-buffered saline for 10–24 h). In addition, some epithelia were immunoreacted to reveal the distribution of tubulin. To this purpose, we used a goat anti-mouse primary antibody (15%, Vector Laboratories, Burlingame, CA), followed by Alexa 647-labeled secondary rabbit anti-goat antibody (1:400; Invitrogen, Carlsbad, CA). Epoxy resin embedding was achieved directly from 100% methanol into epoxy resin. The use of propylenoxide needs to be avoided as it dissolves the X-Gal reaction product. Specifically, we dehydrated for 2 × 10 min in 100 ethanol, followed by 1 h agitation in a 1:1 mixture of ethanol and epoxy resin. After 1 h, the stopper cap of the vials with the tissue and the epoxy resin was removed and the vial with tissue was agitated overnight to evaporate the alcohol. The next day, the tissue was embedded in fresh epoxy resin and cured at 65 °C for two days. Polymerized epoxy resin was sectioned at 1–10 μm thickness using glass knifes. Semithin, 1 μm thick, sections were mounted in distilled water on glass slides and heated to expand and dry onto the slide. Following water evaporation, the sections were counterstained with toluidine blue to reveal distribution of cell nuclei, and then coverslipped. Epoxy resin was used as it provides superior histological detail. However, frozen or vibratome-cut sections turned out to be equally suited.
2.2. Imaging
We used the Zeiss LSM 510 Meta NLO confocal microscope (Zeiss, Jena, Germany) for imaging. This microscope has a tunable femtosecond Ti:S laser (Chameleon XR; Coherent Inc., Santa Clara, CA) that allows multiphoton excitation at wavelengths between 705 and 960 nm. In addition, several visible laser wavelengths (477, 488, 543 and 633 nm) are available in this system.
The 488 nm-excited fluorescence originating from the focal plane of the objective was reflected by a dichroic, passed through a confocal pinhole, and bandpass-filtered to allow only blue-green light (500–530 nm) to be detected by the photomultiplier tube. This fluorescence is shown as pseudo-color green in Figs. 1–4 and 6.
Fig. 1.

Imaging of the BCI precipitate of β-galactosidase is compared for transmitted light (A, B), epifluorescent light (C), confocal microscopy without (D, F) and with (E, G) 720 nm photoactivation. The BCI precipitate in cochlear hair cells absorbs rhodamine (568 nm) excitation fluorescence and can be electronically inverted to yield a signal, here false colored as green (C). Such imaging is comparable to either simple transmitted light (A) or transmitted light with a red rhodamine filter (B). Imaging the BCI precipitate with 488 nm excitation shows absorption of the background epifluorescent signal (D, F), while allowing nerve fibers stained using an Alexa 647-conjugated secondary antibody to be visualized (red fibers in D, F). Photoactivation with 720 nm excitation results in emission of a strong 488 nm-excited fluorescent signal in tissue areas of low BCI precipitate concentration (E, G). Note that high levels of BCI cause quenching, yielding a black hole in the fluorescence (G). Boxes in D are shown at higher magnification in E–G. Abbreviations: AC, anterior crista; HC, horizontal crista; OC, organ of Corti; U, utricle. Scale bar: 100 μm.
Fig. 4.
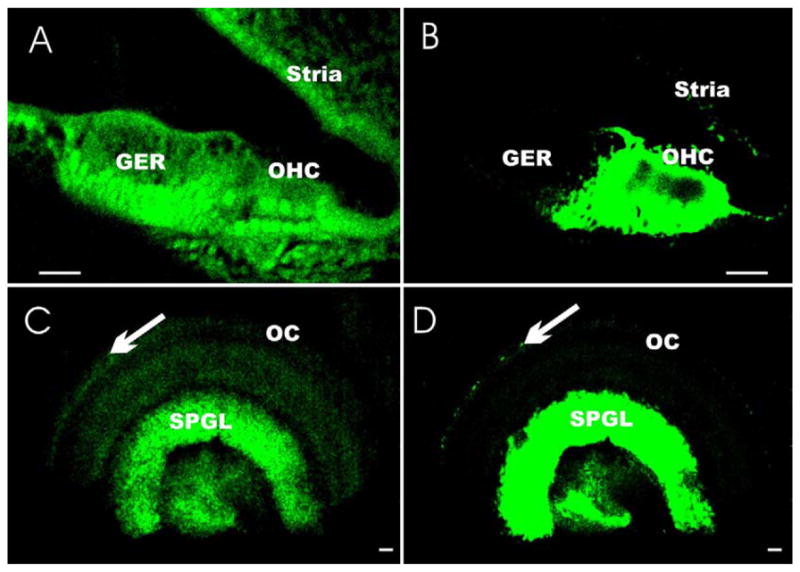
The images show that photoactivation is achieved in epoxy resin-embedded tissue sectioned at 10 μm (A, B) and in whole-mounted tissue exposed in phosphate-buffered saline (C, D). Note that only the intrinsic background fluorescence of the tissue is visible prior to photoactivation (A, C). After photoactivation, the previously invisible BCI precipitate (we selected very light labeling) turned into a brightly fluorescent product (488 nm excitation). This permits imaging of the BCI precipitate in areas of bdnf gene expression in hair cells (OHC) and supporting cells of the upper middle turn of an E18.5 embryonic cochlea. The increased imaging capability of the fluorescent signal allows imaging of the few Neurod1-LacZ-positive hair cells (arrow in C, D) in the organ of Corti (OC), in addition to the strongly labeled neurons of the spiral ganglion (SPGL) that were invisible prior to photoactivation. Other abbreviations: GER, greater epithelial ridge; OHC, outer hair cell. Scale bar: 20 μm.
Fig. 6.

The plate illustrates photobleaching and photoswitching by 488 and 633 nm excitation of BCI photoactivated product in epoxy resin. We first activated the Bdnf gene expression-mediated BCI precipitate (10 μm in epoxy resin) with a single 720 nm scan (40x/1.3 NA objective, 6 mW laser power output) leading to moderate fluorescence after 488 (A) or 633 (B) excitation. We then focused on the area indicated with a white square (C) and scanned 50 times with maximal 488 nm laser power. Subsequently, we took a single image using 488 and 633 nm excitation (C, D). While 488 nm exposure had resulted in noticeable bleaching, this had no effect on the 633 nm-excited fluorescence emission (D). We subsequently restored the 488 nm-excited fluorescence with a single 720 nm scan, followed by 25 scans of 633 nm, again with maximum laser power. The bleaching nearly eliminated the 633 nm-excited fluorescence (white square in F), but substantially increased the 488 nm-excited fluorescence (white square in E). We followed this with another scan at 720 nm, which brought the 633 nm-excited fluorescence back to normal while quenching the 488 nm-excited fluorescence emission at the same time (compare E with H). Another 720 nm scan further bleached the 488 nm emission close to the initial emission (compare A with I), whereas the emission elicited with 633 nm became much stronger (compare B with J). All imaging settings remained constant throughout the experiment. Scale bar: 20 μm.
The Hoechst 33258 nuclear stain was imaged using excitation at 720 nm. The fluorescence emission was separated from the laser light with a 650 nm dichroic, filtered by a bandpass filter (435–485 nm), and then detected by a photomultiplier tube after descanning and passing through a fully-opened pinhole. This signal is shown as pseudo-color blue in the Fig. 2, in which 720 nm excitation is indicated.
Fig. 2.

These images show the appearance of BCI precipitates before (A–F) and after single (G–H) or multiple (G–N) scans using 720 nm excitation (19.5 mW average power at sample; 16 s scan per frame). The intrinsic background fluorescence emitted following 488 nm (A) and 543 nm (B) excitation shows various levels of absorption by BCI (A, B and zoomed in area in B shown in D, E), that is particularly obvious with the Hoechst stain (F). After a single excitation at 720 nm to image the Hoechst stain (F), the properties of BCI have changed. Instead of predominantly absorbing photons, 488 nm (G) and 543 nm (H) excitations produce a strong fluorescence emission. A second 720 nm exposure reveals cell nuclei which could not be seen in the first scan (F, I). Zooming out shows that the small area exposed to 720 nm light emits stronger fluorescent signals after 488, 543 and 720 nm excitation (J–L). A single 720 nm exposure of the entire field results in photoactivation (M, N). Using the lambda mode of the Zeiss 510 laser scanning microscope the maximal 488 nm-excited fluorescence emission is around 528 nm (O). Linear intensity profiles through the BCI precipitate (vertical lines in E, H) show the dramatic increase in fluorescent signal with 543 nm excitation (C). Bar: 100 μm.
Confocal 543 nm-excited fluorescence was similarly reflected by a dichroic and bandpass-filtered to allow the detection of yellow-orange light (565–615 nm) only. This signal is shown as pseudo-color red in Figs. 2 and 3. Finally, the confocal 633 nm-excited fluorescence was bandpass-filtered to allow only the far red light (650–710 nm) to be detected by the photomultiplier. This signal is shown as a blue pseudo-color in Figs. 3 and 6.
Fig. 3.
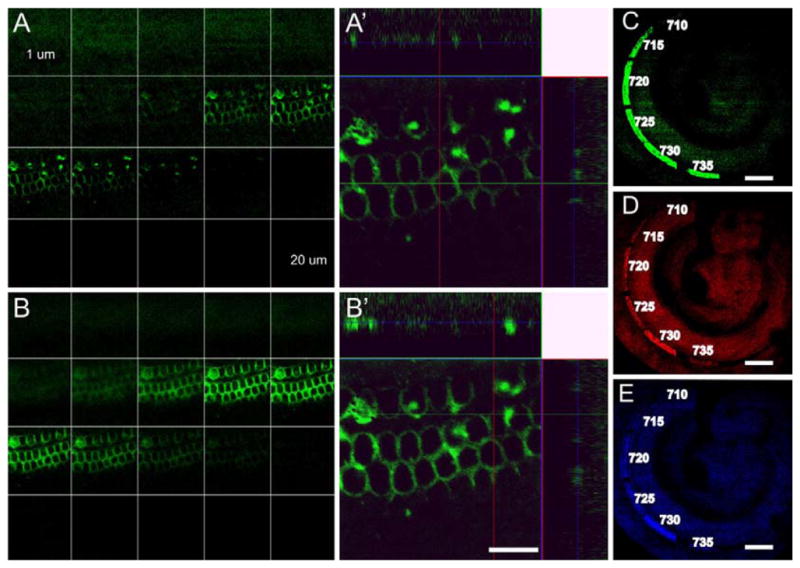
The plate illustrates the depth penetration (A, B) and wavelength dependency (C–E) of the photoactivation process. When using 40x (1.3 NA) lens and 730 nm excitation (2.6 mW average power at sample), the photoactivation process is limited to approximately 3 μm above and below the focal plane (A). Note that repeating the scan (B) produces a brighter signal after 488 nm excitation, but does not change the penetration beyond the ±3 μm already activated with the first scan. Imaging the Z-axis stack in lateral views reveals photoactivation only about 3 μm above and below the center focal plane (A′, B′). We estimated the best wavelength for photoactivation (C–E) using single near-infrared scans of small square regions at different positions along the cochlea (15.4–17.8 mW average laser power). Imaging the entire cochlea by zooming and illuminating with 488 (green, C), 543 (red, D) and 633 nm (blue, E) light reveals that the maximal photoactivation is achieved with 730 nm excitation. Scale bar: A′, B′, 10 μm; C–E, 100 μm.
All confocal pinholes were set to 1 airy diameter, matching the focal spot diameter of the laser in the sample. For photoactivation, the Ti:S laser excitation was initially coarsely tuned between 705 and 960 nm at 60 nm increments, and then more finely between 705 and 735 nm at 5 nm increments.
The Zeiss microscope we used also has a lambda function which allows to determine emission spectra with a given laser or laser combination. Such spectra can be grouped and the relative emission intensity above background can be compared. The lambda function was used to generate emission spectra at approximately 10 nm increments using dichroic mirror settings appropriate for the excitation wavelength.
After photoactivation, we took Z-axis stacks of the preparation to measure the depth of photoactivation to determine whether this was due to a multiphoton process, since multiphoton excitation is inherently spatially localized. For this process, we used a Zeiss PlanApo 40x/1.3 NA oil immersion objective. Other images were taken with either Zeiss PlanApo 10x/0.45 NA or 20x/0.7 NA dry objectives.
Transmitted light imaging and non-confocal epifluorescence were performed with a Nikon E800 microscope using a Photometric ES camera and the Metamorph software for image capturing. Filter cubes used were standard fluorescein isothiocyanate (FITC), rhodamine and Hoechst filter cubes (Chroma Technology Corp, Rockingham, VT); image enhancement was limited to the use of differential interference contrast for transmitted light.
All images were imported into CorelDraw (Corel Corporation, Canada) to assemble plates. Care was taken to keep identical all intensity settings in this process. The average Ti:S laser power transmitted through the objective was calibrated by placing a lower profile, large surface area pyroelectric detector on the microscope stage, just beyond the focal plane of the objective (PM2, Molectron Detector Inc., Portland, OR). All references to the laser power were measured in this way.
3. Results
3.1. The BCI precipitate absorbs fluorescence
BCI strongly absorbs fluorescence throughout the visible spectrum, including laser lines readily available in most confocal systems (Fig. 1A). Because of this absorption, BCI can only be imaged as a negative, unstained outline against the 488 nm-excited background fluorescence. This strong absorbance of other fluorescent signals eliminates even the brightest fluorophores used, for example, to stain nerve fibers traversing the X-Gal-positive area (Fig. 1C) or cell nuclei (Fig. 1F). This absorbance can be turned into a positive signal using electronic contrast inversion settings available with most computer software programs (Fig. 1C). However, this does not change the absorption of other fluorescence signals by the BCI product. Such negative images of BCI, while showing a more widespread X-Gal reaction than transmitted light, provide inferior cellular resolution compared with transmitted light imaging of the BCI precipitate. Absorbance is particularly obvious if BCI is further enhanced using rhodamine filters, which turn the blue reaction product into a black signal (Fig. 1A–C).
3.2. Near-infrared excitation leads to fluorescence emission of fluorescent light after single photon excitation
After attempting to excite the Hoechst stain using two photon excitation at 720 nm, we observed a change in the BCI precipitate when illuminated with 488 nm excitation. The strongly absorbing BCI precipitate started to emit a fluorescent signal (Fig. 1D–G). To investigate this phenomenon, we imaged the apex of the cochlea of an Atoh1-LacZ mouse embryo in which the undifferentiated hair cells were expressing β-galactosidase (Fig. 2A and B). These images were achieved with a 10x/0.45 NA PlanApo lens and the electronic zoom capabilities of the laser scanning microscope.
Initially the BCI precipitate strongly absorbed the background, intrinsic fluorescence excited at 488 and 543 nm. Next, we selected a small region (indicated by the white square in Fig. 2B) and formed image using sequentially 488 nm (Fig. 2D), 543 nm (Fig. 2E) and 720 nm (Fig. 2F) excitation. The same area was then imaged sequentially a second time using identical settings (Fig. 2G–I). There was a dramatic increase in the fluorescent signal emitted from areas that had little intrinsic fluorescence (Fig. 2D and G), or had previously showed absorbance of the intrinsic fluorescence (Fig. 2E and H). Interestingly, the visibility of the Hoechst staining also improved and cell nuclei that were invisible in the first image became now evident (Fig. 2F and I).
We next scanned the larger area that had initially been scanned (Fig. 2A and B). The comparison between the first and the fourth scans taken at the same settings revealed a dramatic change of the X-Gal reaction product only in the area exposed to the 720 nm illumination. Even a single 720 nm exposure of this larger area showed an amplification of the fluorescence signal, albeit much less profound (Fig. 2M and N).
Using the lambda imaging routine on our Zeiss microscope and scanning with the 488, 543 and 633 nm excitation, we analyzed the emission spectrum with 10 nm resolution. The fluorescence emission was strongest following 488 nm excitation, with a maximal emission of the reaction product near 528 nm (Fig. 2L). We compared the signal strength of the fluorescence emission before and after photoactivation. We thus found that photoactivation resulted in a signal that was over 200 times that of the intrinsic background fluorescence (Fig. 2C). As seen in Fig. 2, the conversion process required only a single scan at 720 nm (acquisition time 16 s, 49 mW average power at sample).
Our next goal was to investigate the wavelength and laser power dependency of this photoactivation process. First, we imaged a half turn of the cochlea with 488 nm excitation, imaging consecutively small square sections. The excitation wavelength was titrated between 710 and 960 nm in 60 nm increments for each new square to be imaged. The laser power at the sample varied slightly from 60 to 72 mW as the wavelength was varied. After scanning each square, a single overview image of the entire cochlea (including all of the smaller squares) was acquired using 488 nm excitation. Comparing the first overview image to the second one, it was clear that the single near-infrared scan induced various levels of photoactivation, with the most effective wavelength lying between 710 and 770 nm.
To better determine the optimum photoactivation wavelength, we repeated the procedure by imaging six squares consecutively ranging from 710 to 735 nm at 5 nm increments, keeping this time the average power at the sample constant at approximately 17 mW. The resulting intensity distribution of the photoactivated squares showed that 730 nm was optimal wavelength (Fig. 3C–E).
Obviously, the intensity of the laser power should affect this photoactivation process. We used the optimal conversion wavelength, 730 nm, determined in the previous experiment and used the same set up, but we varied the laser power instead of the wavelength. For a single photoactivation scan, the optimal effect was achieved with an average power of 17 mW when using a 10x/0.45 NA lens. Repeatedly scanning the same region at this laser power produced diminishing yields of 488 nm-excited fluorescence until it disappeared altogether. Re-examination of such areas with transmitted light showed that the dark blue BCI precipitate had also disappeared and small bubbles had formed instead. Thus, continued exposure to the intense beam destroyed the BCI precipitate. In contrast, too little laser power did not result in photoactivation even after prolonged exposure, suggesting a strong power-law dependence of the photoactivation.
Using the Z-axis stepper motor we measured the spatial extent of the photoactivation process. If this is achieved by a multi-photon process, it should be limited to a depth of about 1 μm when using a 40x/1.3 NA lens. Indeed, we found that photoactivation was limited to about 3 μm above and below the focal plane (Fig. 3A and B). We also tried to achieve photoactivation using 633 nm excitation. However, we did not obtain any significant fluorescent emission even after multiple scans at the highest laser power available.
Care needs to be taken with higher NA lens since the intensity of the laser increases as the square of the NA. We recommend starting with low NA lenses, reducing the laser power appropriately as the NA is increased (i.e. if 17 mW is used for 10x/0.45 NA lens, then try 7 mW with a 20x/0.7 NA or 2 mW with a 40x/1.3 NA lens). Care also needs to be taken not to photobleach the fluorescent labels with the other excitation bands. In particular, Alexa 647 used for immunofluorescent labeling is very sensitive to intense near-infrared light and can easily be destabilized. However, reducing the power of the laser as much as possible and using multiple photoactivation scans allow the fluorescent label to be nearly unchanged (Fig. 1D–G). We therefore recommend the use of low power magnification for photoactivation and to photoactivate restricted areas, if desired, using the electronic zoom capacity. This also allows for deeper penetration of the photoactivation that is very limited using higher power lenses.
3.3. Photoactivation is a property of the solid state of the BCI product
Photoactivation in Figs. 1–3 was done using tissue mounted in glycerol. In this part of the investigation, we wanted to check the dependency of this process of photoactivation on the mounting medium. Specifically, we wished to verify whether aqueous solutions (as compared to alcohols) affect this process, and whether this process can work in plastic-embedded tissue. If so, this would indicate that the photoactivation is due to a physicochemical alteration of the X-Gal indolyl ring ferrocyanide complex rather than to interactions with free radicals forming in the solution.
We used tissue mounted in phosphate-buffered saline as well as epoxy resin-embedded tissue sectioned at 1–10 μm thickness. Photoactivation was most easily achieved in tissue suspended in buffer (Fig. 4C and D), since it required the lowest laser power (only 5 mW with the 10x/0.45 NA lens). Indeed, detection of low levels of X-Gal, such as single weakly labeled hair cells in Neurod1-LacZ null mice [14], was difficult in transmitted light. However, those individual cells were clearly visible in the organ of Corti after a single photoactivation (Fig. 4C and D).
It is interesting to note that photoactivation is also very efficient (again, requiring only 5 mW with the 10x/0.45 NA lens) when using epoxy resin-embedded X-Gal-reacted tissue. However, tissue embedded in epoxy resin yielded not only intrinsic background 488 nm-excited fluorescence, but also an even brighter 633 nm excited fluorescent signal with an impressive signal-to-noise ratio (Fig. 4A and B), as we had already noticed with the glycerol-embedded tissue (Fig. 3E). This permits the combination of superior 3D-whole-mount analysis with reflected and transmitted light, followed by detailed histological analysis using the fluorescent signal (Fig. 4A and B).
3.4. Photoactivation of BCI leads to two products, distinguished by specific excitation/emission spectra
These data suggested that more than two emission maxima could be present in the BCI product. We therefore analyzed the optimal excitation/emission properties for the photoactivated BCI precipitate.
As mentioned previously, our confocal system provides a total of five visible wavelength excitation lines: 477, 488, 517, 543 and 633 nm. We excited the product with each wavelength using the lambda mode of the Zeiss microscope to generate an emission profile with a 10 nm resolution using dichroic mirror settings optimized for a given excitation wavelength. These profiles (Fig. 5) showed that, independently from the excitation wavelength, the emission showed only two maxima, one at 527 nm and another at 663 nm. The 488 nm-excited fluorescence emission was the brightest, followed by the 633 nm-excited fluorescence emission. These data indicate that 730 nm photoactivation results in two products with distinct excitation/emission properties.
Fig. 5.

Fluorescence emission spectra of the photoactivated BCI precipitate at different excitation wavelengths. Photoactivation of BCI precipitate results in emissions with peaks near 528 and 663 nm. Excitation with 477, 488 or 517 nm (blue, green yellow vertical lines) causes prominent emission with a peak at 528 nm. Clearly, the emission is most profound after 488 nm excitation (green curve). In contrast, excitation with 543 or 633 nm (red and maroon vertical lines) yields emission near 633 nm with a second peak near 690 nm.
We next investigated the relationship between these two states since optically induced switching between stable states of indole [12] and other products [17] had already been demonstrated.
3.5. BCI precipitate is bistable and photoswitchable
Fluorophores are metastable after exposure, showing photo-bleaching. We therefore investigated the stability of the photoactivated product to 488 nm-mediated photobleaching. After photoactivating an epoxy resin section (Fig. 6A and B), we used again the zoom capacity of the laser scanning microscope to focus on a small photoactivated area. We used the 488 nm excitation with the laser power set to maximum, and we exposed this area frame after frame for 50 consecutive scans. Subsequently, we zoomed out and took a second image showing the effect of the photobleaching (Fig. 6C). Complete 488 nm photobleaching of the activated BCI was difficult to achieve even after 50 scans. Direct comparison with well characterized fluorophores is needed to calibrate the quantum yield.
The data outlined above indicates that we have two distinct species excited at different wavelengths. This raises the question as to whether the photobleaching of one species can affect the population of the other (i.e. whether 633 nm-induced emission can be affected by 488 nm photobleaching and vice versa). We focused on a single photoactivated cell, exposed it to 50 scans using the 488 nm laser at the highest power setting, zoomed out and took an image at both 488 and 633 nm excitation. While 488 nm-excited fluorescence was somewhat reduced (Fig. 6C), no change in the 633 nm-excited fluorescence emission was evident (Fig. 6D). However, when we examined photobleaching by 633 nm excitation, which showed dramatically reduced 633 nm-excited fluorescence emission, 488 nm-excited fluorescence emission was also affected. Zooming out and imaging the preparation showed not only a reduction of the 633 nm-excited fluorescence emission in the bleached area (Fig. 6F), but also an increased 488 nm-excited fluorescence emission in the same area (Fig. 6E). These data suggested that prolonged 633 nm exposure converts the BCI precipitate into a 488 nm excitable product.
The above findings had shown that continued exposure to intense 730 nm excitation can bleach the BCI precipitate completely. We therefore examined whether bleaching with 488 or 633 nm light had also eliminated the BCI product. Viewing the section with transmitted light we found the product unchanged. We therefore re-activated the product again using a single scan at 730 nm (5 mW laser power). This activated the previously bleached area, increasing the 633 nm-excited fluorescence while reducing the 488 nm-induced fluorescence emission from the same area. This suggests that 730 nm photoactivation turns the BCI precipitate into at least two metastable, photoswitchable products that emit after 488 and 633 nm excitation, with a stable proportion of both products re-established after 730 nm excitation. The relative emission of this product can be shifted with 633 nm excitation and bleached with 488 nm excitation.
This raises the question on how repeatable this process is. To further investigate this issue, we reactivated the previously 633 nm bleached region using 730 nm excitation to compare the reactivated fluorescence intensity with the nearby previously unbleached product. After 25 scans both products showed no fluorescence, suggesting that previous bleaching had little effect on the overall stability. Continued exposure with 730 nm excitation enhanced the fluorescent signal in all wavelengths, erasing all previous bleaching effects. However, this shifted the overall emission to a stronger 633 nm-excited fluorescence emission at the expenses of 488 nm-excited fluorescence (Fig. 6G–J).
3.6. Summary of the procedure and recommended protocol for the use of photoactivation of BCI precipitate to reveal β-galactosidase in tissue sections and whole-mounts
In summary, our data show that near-infrared 730 nm excitation results in the photoactivation of the BCI precipitate with variable and photoswitchable fluorescence emissions at 527 and 663 nm after excitation with 488 and 633 nm, respectively. The photoactivation process is a function of the solid state of the BCI–ferrocyanide complex resulting from the β-galactosidase-mediated enzymatic reaction and is particularly stable in epoxy-embedded material.
The recommended protocol is as follows:
Use fixed tissue, frozen cut tissue sections, whole-mounts, vibratome-cut sections (up to a 200 μm thickness) or razor blade-cut sections of tissue of choice in the desired mouse line that expresses LacZ to run the β-galactosidase reaction.
Avoid overfixation. We recommend short perfusion with 4% PFA. Storage of tissue longer than 1 h should be in 0.4% PFA or 2% glutaraldehyde in phosphate buffer.
Wash tissue or sections in phosphate buffer to remove fixative.
Incubate tissue or sections in the β-galactosidase reaction mixture [3.632 ml 0.1 M Na2HPO4, 40 μl 0.5 M potassium ferricyanide, 40 μl 0.5 M potassium ferrocyanide, 40 μl 1% sodium deoxycholate, 8 μl 1 M MgCl2, 40 μl 2% Np-40 and 200 μl X-Gal (60 mg/ml in N,N-dimethyl formamide)] at 24 °C overnight on a shaker. Make sure that the tissue is covered with fluid at all times.
Following the reaction, areas of β-galactosidase enzymatic activity will turn blue. Such areas can be embedded in epoxy resin for high resolution sections or viewed directly.
Mount sections or preparations on a slide, coverslip using glycerol, and expose the desired area to infrared illumination of 730 nm using the Ti:S laser with minimal power settings. Increase laser power stepwise.
Check the progress of photoactivation after each Ti:S sweep with fluorescence microscopy using a FITC filter cube. Areas in which photoactivation is achieved will fluoresce brightly, areas without BCI product will provide background, areas with BCI product that has not been photoactivated will appear dark.
Once photoactivation is achieved, use 488 nm laser excitation to obtain a fluorescent image.
Pitfalls and recommendations:
Make sure that the 730 laser power is set low, otherwise the BCI product will overheat and will be destroyed.
Avoid excessive imaging of the photoactivated product before the final image is taken.
If possible, take images of additional labeling before the tissue is photoactivated. Some fluorescent dyes fade with the high intensity near-infrared laser exposure, which is needed for photoactivation.
Best is to use sequential laser scanning. Image first other fluorescent labeled structures, followed by imaging of the photoactivated BCI product.
4. Discussion
We present here data suggesting a simple solution to image the BCI precipitate consecutively in transmitted and fluorescent light. Near-infrared Ti:S laser excitation mediates a photoactivation process somewhat similar to the uncaging process used to image certain fluorescent substances [22]. In this procedure, like in others used to study distribution of gene expression in whole embryos or animals [24], the X-Gal reaction provides excellent whole-mount imaging capacity [10].
Combined with the photoactivation process described here, a single reaction yields superior images using either reflected, transmitted or epifluorescent illumination. Specifically, 730 nm excitation converts a product that strongly absorbs 488 nm light into a fluorescent product with a peak emission around 528 or 663 nm when excited by 488 or 633 nm, respectively (Fig. 5). Once photoactivated, the fluorescent product is stable when excited by visible light. This conversion process is sensitive to continued excitation with intense near-infrared imaging, but can be completely destroyed with continuous exposure. Therefore, care has to be taken to adjust the laser power properly to obtain optimal photoactivation without unnecessary bleaching. We find that checking for loss of the blue X-Gal signal using transmitted light imaging is an easy way to monitor the photoactivation process, even in critical tissue.
4.1. Photoactivated BCI can be used for fluorescent co-localization studies
In contrast to the BCI precipitate that blocks fluorescence, photoactivated BCI allows imaging of other fluorescence signals. Specifically, we have shown that Alexa 647 and Hoechst nuclear stains are visible in tissue areas showing strong photoactivated BCI precipitate, but not in areas in which X-Gal was not activated (Figs. 1 and 2). Photoactivation of BCI thus allows imaging of co-localized or adjacent fluorescent signals with the X-Gal reaction product, thus improving the usefulness of this reaction product (Fig. 1).
Photoactivation also increases the signal-to-noise ratio of X-Gal to the extent that weak signals, questionable or invisible in transmitted light, can yield a strong and clearly visible signal after photoactivation (Figs. 2–4). While photoactivation results in increased sensitivity, it may be necessary to take images with the second labeling prior to photoactivation, since certain fluorophores, in particular those excited with 633 nm light, may also tend to bleach with intense or continuous 730 nm exposure.
Interestingly, the Hoechst staining benefits dramatically from this approach, allowing imaging of cell nuclei that were invisible before photoactivation (Fig. 1). We suggest that the potential use near ultraviolet excitation of fluorophores absorbing in the 350–450 nm needs to be explored.
4.2. Photoactivation of BCI may increase sensitivity of gene expression detection
In contrast to techniques in which both transmitted and epifluorescent reactions are used to generate a mixed imaging capability to monitor the appearance of β-galactosidase [27], our technique does not compromise either imaging or sensitivity. If anything, epifluorescent imaging of photoactivated X-Gal has better imaging capabilities than X-Gal visualized by transmitted or reflected light. The epifluorescence signal, if photoactivated carefully, does not result in noticeable bleaching of the BCI product, allowing its continued use in transmitted light microscopy.
As with other chromophores, high concentrations of BCI precipitate result in concentration quenching. Indeed, such quenching blocks photoactivation in tissue areas of very high BCI precipitation, and one should not attempt to overcome this using continuous or intense exposure. Recent work indicates the use of a fluorescent product formation through β-galactosidase enzymatic activity [5,26] in continuous monitoring for plate assay methods or flow cytometry [2,6,20]. However, the reaction products do not allow imaging with transmitted or reflected light, and the photostability of one of these products (fluorescein) is possibly inferior to the photoactivated BCI product presented here.
4.3. BCI precipitate can be used to improve visibility of an enzymatic reaction
The photoactivation procedure is effective in tissue embedded in epoxy resin but also in freshly fixed and X-Gal-reacted tissue suspended in glycerol or buffer. The latter aspect is particularly interesting as it can allow the use of this process to photoactivate the BCI precipitate followed by flow cytometry-mediated cell sorting, as previously demonstrated for fluorescent β-galactosidase reaction products [2,6]. This aspect of GFP-mediated gene expression studies has thus far eluded LacZ gene marking. Obviously, penetration of the X-Gal reaction solution is needed to generate BCI. However, this is possible, thus making it likely that this reaction can occur in lightly fixed or even living cells to be used for flow cytometry after photoactivation. For example, we recently showed that only the Atoh1-LacZ can label undifferentiated hair cells in mutants not expressing this transcription factor, while others failed to label those cells with any marker, including Atoh1-GFP [19]. The use of the inherent enzymatic amplification of the X-Gal enzymatic reaction, combined with photoactivation and followed by flow cytometry, should allow to isolate those cells to study their gene expression profiles compared to differentiated hair cells of littermates. Alternatively, already existing protocols using vital fluorescent staining can be used [5,20].
Likewise, studies seeking to isolate onset of gene expression using LacZ markers or weak expression in a small subset of cells, such as the few Neurod1-LacZ-positive hair cells [14], may benefit from the improved visibility and enhanced sensitivity of the combined process. Indeed, it was recently shown that fluorescence in situ hybridization using fluorescent dendrimers or fluorescent alkaline reaction products results in superior imaging of low amounts of mRNA that went unnoticed in previous studies using enzymatic reaction combined with reflected or transmitted light imaging of the reaction product [4,11]. We are currently testing a new in situ hybridization using β-galactosidase combined with the photoactivation process described here, rather than fluorescent alkaline phosphatase reactions [4]. We assume that this will result in superior imaging that may compete with the most sensitive in situ processes known thus far [4,11]. This will also offer both light and fluorescent imaging capacity, and will add to the use of β-galactosidase-mediated reactions to facilitate the imaging of gene distribution in whole embryos using photoshift [24] or NMR [7,16,29].
4.4. Wide medical and technical potential applications of the BCI precipitate
Indole ring derivatives are used in various medical diagnostics, providing early insights into certain types of cancer and bowel problems [3,28]. Thus far these products are imaged using 345 nm excitation with 480 nm emission. Clearly, our near-infrared activation reflects this absorption, as it is near double that wavelength (approximately 690 nm). We suggest that photoactivation of the 5-hydroxyindole-3-acetic acid (5-HIAA) reaction product of 5-hydroxytryptamine (5-HT) may provide an even more sensitive tool to measure the amount of this product using standards to estimate the concentration. Our data clearly imply that diverse applications could benefit from studying such properties more closely. Such applications are relevant for diagnostics of human diseases and drug discovery exploiting minichip-based essays, as recently proposed for the fluorescent β-galactosidase reaction [26].
A potential application of the photoswitchable product combined with the inherent spatial localization is related to the use of BCI precipitate for data storage. This is a rapidly evolving area, in which the use of both indolyl [12,25] and other fluorescent products is explored [17]. The distribution of single granules of BCI precipitate can be easily imaged and the product is a bistable fluorophore with the ability to be restored with photoactivation (Fig. 5). This should allow a higher packing density of digital information, since single dots of photoactivated product would benefit from the localized three-dimensional excitation capacity provided by the non-linear excitation. In this context, we wish to emphasize that photoactivation is a solid state effect that functions well if the BCI precipitate is embedded in epoxy resin (Figs. 3 and 5), a potential carrier medium for a BCI nanoparticle suspension.
4.5. Concluding remarks
In summary, we present here a simple near-infrared photoactivation process that allows conversion of the non-fluorescent BCI X-Gal reaction product into a fluorescent product with superior visibility. This procedure has a great potential for the extension of the use of the LacZ reporter gene in techniques unexplored so far, such as flow cytometry and confocal flu-orescent imaging alone or in combination with other labels. Moreover, the BCI precipitate can be viewed directly after photoactivation [1]. We also present insights into potential wide applications of this novel effect in biomedical, pharmacological and computer science studies.
Acknowledgments
This work was supported by NIH grants DC005590 (BF). This investigation was conducted in a facility constructed with support from Research Facilities Improvement Program Grant Number 1 C06 RR17417-01 from the National Center for Research Resources, National Institutes of Health. We acknowledge the use of the confocal microscope facility of the NCCB, supported by EPSCoR EPS-0346476 (CFD 47.076).
Abbreviations
- Ti
S, titanium-doped Sapphire
- GFP
green fluorescent protein
- BCI
5-bromo-4-chloro-3-indolyl
References
- 1.Balercia G, Chen S, Bentivoglio M. Electron microscopic analysis of fluorescent neuronal labeling after photoconversion. J Neurosci Methods. 1992;45:87–98. doi: 10.1016/0165-0270(92)90046-g. [DOI] [PubMed] [Google Scholar]
- 2.Bauman JG, Bayer JA, van Dekken H. Fluorescent in-situ hybridization to detect cellular RNA by flow cytometry and confocal microscopy. J Microsc. 1990;157(Part 1):73–81. doi: 10.1111/j.1365-2818.1990.tb02948.x. [DOI] [PubMed] [Google Scholar]
- 3.Bolandparvaz S, Vasei M, Owji AA, Ata-Ee N, Amin A, Daneshbod Y, Hosseini SV. Urinary 5-hydroxy indole acetic acid as a test for early diagnosis of acute appendicitis. Clin Biochem. 2004;37:985–989. doi: 10.1016/j.clinbiochem.2004.07.003. [DOI] [PubMed] [Google Scholar]
- 4.Breininger JF, Baskin DG. Fluorescence in situ hybridization of scarce leptin receptor mRNA using the enzyme-labeled fluorescent substrate method and tyramide signal amplification. J Histochem Cytochem. 2000;48:1593–1599. doi: 10.1177/002215540004801202. [DOI] [PubMed] [Google Scholar]
- 5.Brustugun OT, Mellgren G, Gjertsen BT, Bjerkvig R, Doskeland SO. Sensitive and rapid detection of beta-galactosidase expression in intact cells by microinjection of fluorescent substrate. Exp Cell Res. 1995;219:372–378. doi: 10.1006/excr.1995.1241. [DOI] [PubMed] [Google Scholar]
- 6.Chilvers KF, Perry JD, James AL, Reed RH. Synthesis and evaluation of novel fluorogenic substrates for the detection of bacterial beta-galactosidase. J Appl Microbiol. 2001;91:1118–1130. doi: 10.1046/j.1365-2672.2001.01484.x. [DOI] [PubMed] [Google Scholar]
- 7.Cui W, Otten P, Li Y, Koeneman KS, Yu J, Mason RP. Novel NMR approach to assessing gene transfection: 4-fluoro-2-nitrophenyl-beta-D-galactopyranoside as a prototype reporter molecule for beta-galactosidase. Magn Reson Med. 2004;51:616–620. doi: 10.1002/mrm.10719. [DOI] [PubMed] [Google Scholar]
- 8.Farinas I, Jones KR, Tessarollo L, Vigers AJ, Huang E, Kirstein M, de Caprona DC, Coppola V, Backus C, Reichardt LF, Fritzsch B. Spatial shaping of cochlear innervation by temporally regulated neurotrophin expression. J Neurosci. 2001;21:6170–6180. doi: 10.1523/JNEUROSCI.21-16-06170.2001. [DOI] [PMC free article] [PubMed] [Google Scholar]
- 9.Fritzsch B, Nichols DH, Echelard Y, McMahon AP. Development of midbrain and anterior hindbrain ocular motoneurons in normal and Wnt-1 knockout mice. J Neurobiol. 1995;27:457–469. doi: 10.1002/neu.480270403. [DOI] [PubMed] [Google Scholar]
- 10.Fritzsch B, Matei VA, Nichols DH, Bermingham N, Jones K, Beisel KW, Wang VY. Atoh1 null mice show directed afferent fiber growth to undifferentiated ear sensory epithelia followed by incomplete fiber retention. Dev Dyn. 2005;233:570–583. doi: 10.1002/dvdy.20370. [DOI] [PMC free article] [PubMed] [Google Scholar]
- 11.Gerhart J, Baytion M, Perlman J, Neely C, Hearon B, Nilsen T, Getts R, Kadushin J, George-Weinstein M. Visualizing the needle in the haystack: in situ hybridization with fluorescent dendrimers. Biol Proced Online. 2004;6:149–156. doi: 10.1251/bpo84. [DOI] [PMC free article] [PubMed] [Google Scholar]
- 12.Kaletas BK, Williams RM, Konig B, De Cola L. Strong fluorescence enhancement of 2-bromo-3-(1H-indol-3-yl)maleimide upon coordination to a Lewis-acidic metal complex. Chem Commun (Camb) 2002;7:776–777. doi: 10.1039/b111599e. [DOI] [PubMed] [Google Scholar]
- 13.Karis A, Pata I, van Doorninck JH, Grosveld F, de Zeeuw CI, de Caprona D, Fritzsch B. Transcription factor GATA-3 alters pathway selection of olivocochlear neurons and affects morphogenesis of the ear. J Comp Neurol. 2001;429:615–630. doi: 10.1002/1096-9861(20010122)429:4<615::aid-cne8>3.0.co;2-f. [DOI] [PubMed] [Google Scholar]
- 14.Kim WY, Fritzsch B, Serls A, Bakel LA, Huang EJ, Reichardt LF, Barth DS, Lee JE. NeuroD-null mice are deaf due to a severe loss of the inner ear sensory neurons during development. Development. 2001;128:417–426. doi: 10.1242/dev.128.3.417. [DOI] [PMC free article] [PubMed] [Google Scholar]
- 15.Leone DP, Genoud S, Atanasoski S, Grausenburger R, Berger P, Metzger D, Macklin WB, Chambon P, Suter U. Tamoxifen-inducible glia-specific Cre mice for somatic mutagenesis in oligodendrocytes and Schwann cells. Mol Cell Neurosci. 2003;22:430–440. doi: 10.1016/s1044-7431(03)00029-0. [DOI] [PubMed] [Google Scholar]
- 16.Li Y, Yang CM. A tryptophan-containing open-chain framework for tuning a high selectivity for Ca2+ and 13C NMR observation of a Ca2+-indole interaction in aqueous solution. J Am Chem Soc. 2005;127:3527–3530. doi: 10.1021/ja046517i. [DOI] [PubMed] [Google Scholar]
- 17.Lim SJ, An BK, Jung SD, Chung MA, Park SY. Photoswitchable organic nanoparticles and a polymer film employing multifunctional molecules with enhanced fluorescence emission and bistable photochromism. Angew Chem Int Ed Engl. 2004;43:6346–6350. doi: 10.1002/anie.200461172. [DOI] [PubMed] [Google Scholar]
- 18.Mallon BS, Shick HE, Kidd GJ, Macklin WB. Proteolipid promoter activity distinguishes two populations of NG2-positive cells throughout neonatal cortical development. J Neurosci. 2002;22:876–885. doi: 10.1523/JNEUROSCI.22-03-00876.2002. [DOI] [PMC free article] [PubMed] [Google Scholar]
- 19.Matei V, Pauley S, Kaing S, Rowitch D, Beisel KW, Morris K, Feng F, Jones K, Lee J, Fritzsch B. Smaller inner ear sensory epithelia in Neurog 1 null mice are related to earlier hair cell cycle exit. Dev Dyn. 2005;234:633–650. doi: 10.1002/dvdy.20551. [DOI] [PMC free article] [PubMed] [Google Scholar]
- 20.Metzger JM, Lin WI, Samuelson LC. Vital staining of cardiac myocytes during embryonic stem cell cardiogenesis in vitro. Circ Res. 1996;78:547–552. doi: 10.1161/01.res.78.4.547. [DOI] [PubMed] [Google Scholar]
- 21.Ohyama T, Groves AK. Generation of Pax2-Cre mice by modification of a Pax2 bacterial artificial chromosome. Genesis. 2004;38:195–199. doi: 10.1002/gene.20017. [DOI] [PubMed] [Google Scholar]
- 22.Post JN, Lidke KA, Rieger B, Arndt-Jovin DJ. One-and two-photon photoactivation of a paGFP-fusion protein in live Drosophila embryos. FEBS Lett. 2005;579:325–330. doi: 10.1016/j.febslet.2004.11.092. [DOI] [PubMed] [Google Scholar]
- 23.Studer M, Lumsden A, Ariza-McNaughton L, Bradley A, Krumlauf R. Altered segmental identity and abnormal migration of motor neurons in mice lacking Hoxb-1. Nature. 1996;384:630–634. doi: 10.1038/384630a0. [DOI] [PubMed] [Google Scholar]
- 24.Tung CH, Zeng Q, Shah K, Kim DE, Schellingerhout D, Weissleder R. In vivo imaging of beta-galactosidase activity using far red fluorescent switch. Cancer Res. 2004;64:1579–1583. doi: 10.1158/0008-5472.can-03-3226. [DOI] [PubMed] [Google Scholar]
- 25.Wolak MA, Sullivan JM, Thomas CJ, Finn RC, Birge RR, Lees WJ. Thermolysis of a fluorinated indolylfulgide features a novel 1,5-indolyl shift. J Org Chem. 2001;66:4739–4741. doi: 10.1021/jo015693w. [DOI] [PubMed] [Google Scholar]
- 26.Xu H, Ewing AG. A rapid enzyme assay for beta-galactosidase using optically gated sample introduction on a microfabricated chip. Anal Bioanal Chem. 2004;378:1710–1715. doi: 10.1007/s00216-003-2317-z. [DOI] [PubMed] [Google Scholar]
- 27.Yang NC, Hu ML. A fluorimetric method using fluorescein di-beta-D-galactopyranoside for quantifying the senescence-associated beta-galactosidase activity in human foreskin fibroblast Hs68 cells. Anal Biochem. 2004;325:337–343. doi: 10.1016/j.ab.2003.11.012. [DOI] [PubMed] [Google Scholar]
- 28.Yoshitake T, Iizuka R, Fujino K, Inoue O, Yamagata K, Nohta H, Yamaguchi M. Simultaneous determination of serotonin and 5-hydroxyindole-3-acetic acid in human urine by automated precolumn derivatization and semi-microbore column liquid chromatography with fluorescence detection. Anal Sci. 2004;20:1687–1690. doi: 10.2116/analsci.20.1687. [DOI] [PubMed] [Google Scholar]
- 29.Yu J, Otten P, Ma Z, Cui W, Liu L, Mason RP. Novel NMR platform for detecting gene transfection: synthesis and evaluation of fluorinated phenyl beta-D-galactosides with potential application for assessing LacZ gene expression. Bioconjug Chem. 2004;15:1334–1341. doi: 10.1021/bc049936d. [DOI] [PubMed] [Google Scholar]