

Abstract
Pharmacologic induction of fetal globin synthesis is an accepted therapeutic strategy for treatment of the beta hemoglobinopathies and thalassemias, as even small increases in hemoglobin F (HbF) levels reduce clinical severity in sickle cell disease and reduce anemia in beta thalassemia. Prior generation short chain fatty acid therapeutics, arginine butyrate and phenylbutyrate, increased fetal and total hemoglobin levels in patients, but were limited by high doses or intravenous infusion. A fetal globin-inducing therapeutic with convenient oral dosing would be an advance for these classic molecular diseases.
Healthy adult human subjects were treated with a novel SCFA derivative, sodium 2,2 dimethylbutyrate (SDMB), or placebo, with one of four single dose levels (2, 5, 10 and 20 mg/kg) or daily doses (5, 10, or 15 mg/kg) over 14 days, and monitored for adverse clinical and laboratory events, drug levels, reticulocytes, and HbF assays. SDMB was well-tolerated with no clinically significant adverse events related to study medication. The terminal half-life ranged from 9–15 hours. Increases in mean absolute reticulocytes were observed at all dose levels in the 14-day study. The favorable PK profiles and safety findings indicate that SDMB warrants further investigation for treatment of anemic subjects with beta hemoglobinopathies.
Keywords: short chain fatty acids, anemias, pharmacokinetic profiles, erythropoiesis, fetal hemoglobin
Introduction
Fetal hemoglobin (HbF, α2γ2) is normally developmentally suppressed to levels <2% by 6 months of age.1 In the beta globin diseases, residual elevated levels are associated with reduced clinical severity in sickle cell disease (SCD) and beta thalassemia.1–15 Fetal (γ) globin chains interfere with the polymerization of sickle hemoglobin, thereby preventing many pathologic and clinical consequences of sickling.1–5 HbF levels ≥ 8.6% correlate with improved survival, and higher levels (>20%) of HbF and F-cells are associated with milder, even benign, clinical courses in sickle cell disease.1–11 Three classes of therapeutic agents have been shown to induce HbF expression in affected patients: chemotherapeutic agents, which cause cytostasis or demethylation, (such as hydroxyurea, 5-azacytidine, decitabine), erythropoietin, and short chain fatty acids (SCFAs) and SCFA derivatives (SCFADs), such as arginine butyrate (AB) and sodium phenylbutyrate (SPB), when administered with iron supplements.1,15–32
Unlike chemotherapeutics, the SCFAs are not known to be mutagenic, carcinogenic or teratogenic.29 Sodium phenylbutyrate and arginine butyrate enhance both fetal and total hemoglobin levels in patients with sickle cell disease and beta thalassemia.1,15–21,26–32 Some previously transfusion-dependent thalassemia patients even became transfusion-independent.15–16,18–20,29 However, these earlier SCFAs (including AB and SPB) are rapidly cleared from plasma, and require intravenous (IV) infusion or large oral doses. These first-generation SCFA compounds also inhibit histone deacetylases, which generally inhibit erythroid cell proliferation, and therefore require dose titration and intermittent dose schedules.26–29 There remains an unmet medical need in patients with beta hemoglobinopathies for convenient oral therapeutics that induce fetal (γ)-globin gene expression without inhibiting erythroid cell proliferation.
Sodium 2,2-dimethylbutyrate (SDMB or HQK-1001, previously designated ST-20) is a new generation SCFA that is orally bioavailable in non-human primate models and induces fetal globin synthesis in reporter gene assays, in patients’ cultured cells and in transgenic mice.26–28 SDMB also stimulates erythroid cell proliferation and survival,26,28 and increases total hemoglobin levels in phlebotomized anemic baboons.27 The compound has a favorable pharmacokinetic profile in non-human primates and is non-mutagenic.27 The studies described were designed to evaluate the clinical safety of SDMB in healthy adult human subjects, before initiating trials in patients with anemias associated with beta globin disorders.
Subjects, Materials and Methods
The safety and pharmacokinetics of SDMB were evaluated in healthy adult human subjects in two clinical studies. The first study consisted of 4 cohorts of approximately 8 healthy adult subjects treated with a single dose, with escalation to higher single doses in additional cohorts thereafter. The second study consisted of 14 days of once-daily dosing in 5 single-dose level cohorts with safety monitoring for the ensuing 28 days, followed by the same treatment program in additional cohorts with dose escalation. In addition, some subjects at all dose levels in the repeat-dose study were treated with iron, which is required for fetal globin synthesis and erythropoietic effects with other therapeutic agents.1,13,15,22,29
Eligibility
Criteria for eligibility in both studies included healthy male and female adults, ages 18–45 years with normal screening laboratory studies including hematology, chemistry, urinalysis, and coagulation parameters. Female subjects could not be pregnant and, if of child-bearing potential and engaging in potential reproductive activity, were required to employ an effective method of birth control during the course of the study and for one month after study medication exposure. Male subjects were also required to use effective contraception throughout the study. Subjects could not have received any prescription medication, with the exception of multivitamins or contraceptives, within 2 weeks prior to study drug administration, and must have had a negative urine screen for substances of abuse. In the repeat-dose study, serum ferritin levels at screening were required to be greater than 50 ng/mL for Cohort 1 and greater than 30 ng/mL for Cohorts 2, 3, 4, and 5.
Both studies were conducted at Charles River Clinical Services Northwest, in Tacoma, Washington. Subjects in both studies provided written informed consent prior to eligibility screening and study participation. The protocol, amendments and informed consent forms for both studies were approved by Aspire Independent Review Board, La Mesa, CA, and were conducted in accordance with the International Compilation of Human Subject Research Protections 2009 (www.fda.gov) and Guidelines for Good Clinical Practice.
Study Design
This was a Phase 1, placebo-controlled, single dose-escalation and multiple dose clinical study to evaluate and compare the safety and pharmacokinetics (PK) of SDMB compared to placebo in healthy adult human subjects. Subjects were admitted to a Phase 1 Clinical Research Unit (CRU) for the first 24 hours of both studies and treated as out-subjects thereafter. The single-dose study involved 5 cohorts of subjects each receiving either SDMB or placebo on Day 0. The multiple-dose study also involved 5 cohorts of subjects receiving either study drug or placebo from Day 0 for 14 consecutive days. Follow-up evaluations were conducted every two weeks for 28 days after discontinuation of study medication in both trials.
In the single-dose study, there were 5 planned cohorts at dose levels of 2, 5, 10, 20, or 30 mg/kg. Each cohort was comprised of 8 subjects, with 6 receiving active drug and 2 receiving placebo. All cohorts were dosed in a fasting state. Subjects in the 20 mg/kg cohort also received a second dose of investigational product under fed conditions after a 7-day washout period. The Principal Investigator (PI) reviewed all safety data to determine if dose limiting toxicity (DLT) had occurred. Once the safety of the prior cohort had been determined, study drug was administered to subjects in the next dose level cohort. The PK findings from the 20 mg/kg cohort revealed that subject plasma dimethylbutyric acid (DMB) levels were significantly higher than those required to stimulate HbF expression in erythroid cell cultures in vitro. It was therefore decided not to enroll subjects in the planned 30 mg/kg cohort. There were no safety observations limiting further dose escalation.
In the repeat-dose study, each cohort consisted of 8 subjects, with 6 receiving active medication and 2 receiving placebo, except for Cohort 2, which enrolled 9 subjects, with 7 receiving active drug and 2 receiving placebo. Cohorts 1, 2, and 3 tested 5 mg/kg doses under 3 conditions- fasting, fed, or fed and with iron supplements, respectively. Iron supplements were administered at 325 mg per day of oral ferrous gluconate, to determine whether iron altered pharmacokinetic profiles. Cohorts 4 and 5 received 10 mg/kg and 15 mg/kg, respectively under fed conditions with oral iron. After safety observations and PK data from the prior cohorts were reviewed, Cohorts 3 and 4 were dosed concurrently. Cohort 5 was dosed after data from Cohort 4 showed no dose-limiting toxicity (DLT).
Safety was assessed in both studies by vital signs, physical examination, screening neurological examination, clinical laboratory studies, 12-lead electrocardiogram (ECG), and monitoring for adverse events. Special hematology studies (fetal hemoglobin-containing reticulocytes [F-reticulocytes], fetal hemoglobin-containing red blood cells [F-cells], fetal hemoglobin levels) were also performed to provide potential insights into SDMB pharmacodynamic (PD) activity. In the single dose study, examinations and laboratory monitoring were performed at two baseline points and Days 0, 1, 2, 3, 7, 14, and 28. In the multi-dose study, laboratory monitoring tests were performed at 2 baseline points, and 6 times on study, at Days 0, 6, 13, 20, 27 and 41. With the PK studies listed below, approximately 500 mls of blood was withdrawn over the 6-week period. Pharmacokinetic measures were evaluated during the course of both studies. These included maximum observed DMB plasma concentration (Cmax), minimum concentration (Cmin), average concentration (Cavg), time of maximum concentration (Tmax), area under the plasma concentration-time curve from time 0 to time of last measurable plasma concentration (AUC(0-last)), area under the curve from time 0 to last quantifiable concentration (AUC(0-lqc)), area under the plasma concentration-time curve from 0 time extrapolated to infinity (AUC(0-∞)), percentage of AUC that is extrapolated beyond the last measurable concentration (AUC%extrap), apparent plasma terminal-phase elimination rate constant (λz), terminal-phase half life (t1/2), apparent oral volume of distribution, terminal phase (Vz/F), total body clearance (CL/F), renal clearance (CL/R), and cumulative urinary excretion (Ae).
DMB Plasma Concentration Assay
In the single dose study, plasma concentrations of SDMB were measured using liquid chromatography mass spectrometry/mass spectrometry (LC-MS/MS), as previously described.36 The analyte was extracted from heparinized human plasma by protein precipitation with acetonitrile, followed by derivatization to a benzyl amide. The linear concentration range (for calibration) was validated and documented from 0.2 μg/mL to 50 μg/mL with 1/x2 weighting. The lower limit of quantification (LLOQ) was 0.20 μg/mL. In the repeat-dose study, plasma concentrations of SDMB were measured using a validated LC-MS/MS assay method at Frontage Laboratories (Malvern, PA). The LLOQ for plasma levels was validated at 0.100 μg/mL. Quantitation of levels higher than 50 μg/mL was performed using dilutions with blank plasma and validated in the SOPs developed for the assay.
Pharmacokinetic Data Analysis
Pharmacokinetic analyses for both the single-dose and repeat-dose studies were performed using noncompartmental methods employing WinNonlin® Professional versuib 5.2 (Pharsight Corp, Mountain View, CA).
Hematology Analyses
Absolute reticulocytes were measured by an Advia Coulter Counter at Children’s Hospital Oakland, Oakland, CA. The proportions of reticulocytes and red blood cells which express some HbF, (F-reticulocytes and F-cells respectively) were analyzed by FACScan analysis as previously described35 employing a PE Mouse Anti-human fetal hemoglobin antibody (Invitrogen, Carlsbad, CA), a PE Mouse isotype Control (Beckman-Coulter, Brea, CA), and Retic-COUNT reagent (BD Biosciences, San Jose CA), adapted from the manufacturer’s directions.33
Statistical Analysis
In the single-dose study, pharmacokinetic linearity and dose proportionality were assessed for AUCinf, Cmax, and CL/F versus dose using GraphPad Prism software version 5. The relationship between the log of the pharmacokinetic parameter and the dose was assessed for linearity. Dose linearity over the dose range was shown if the slope of the linear relationship was not significantly different from one, or from zero in the case of CL/F. The effect of food on the Cmax, AUClast, and AUCinf values was assessed by use of a paired t-test, and Tmax values were compared using a Wilcoxon signed rank test. The analyses were also performed using the GraphPad software. Summary statistics were analyzed for all safety variables.
In the repeat-dose study, data were summarized by visit, fed vs. fasting condition, administration of oral iron, dose level and measurement time. Comparisons between fed and fasting conditions, dose levels, and administration of oral iron in terms of AUC(0-lqc), AUC(0-∞), Cmax, Cmin, Cavg, Tmax, T1/2, CL/F, λz and CLr were made using an Analysis of Variance (ANOVA) model. Comparisons were made in early PD measures (changes from baseline in absolute reticulocytes and F-reticulocytes) between dose level cohorts and between utilization (or not) of iron supplementation using ANOVA, and Statview software. Adverse events were characterized by dose level, fed or fasting state, presence or absence of iron, system organ class (SOC), using MedDRA (Medical Dictionary for Regulatory Activities) v. 9 preferred term coding, and AE and laboratory abnormality severity grading was performed using the NCI CTC Version 3. The PI determined AE relationship to study medication.
Results
In the single dose study, 32 subjects (12 males and 20 females) were enrolled and randomized into 1 of 4 treatment groups as described. All subjects received study drug SDMB or placebo, and completed the study. The ages of the subjects ranged from 18 to 44 years, and the majority of the subjects (90%) were Caucasian; demographic features of the study subjects are shown in Table 1. No dose limiting toxicity (DLT) was observed at any dose level studied. The 24 subjects (16 females and 2 males) who had received active drug were included in the PK analysis population.
Table 1.
Demographics and Baseline Characteristics of Study Subjects
| Single Dose Study | Repeat Dose Study | |||
|---|---|---|---|---|
|
| ||||
| Demographic Parameter | Sodium 2,2 Dimethylbutyrate Total (n=32) | Placebo (n=8) | Sodium 2,2 Dimethylbutyrate Total (n=41) | Placebo (n=10) |
| Gender, n (%) | ||||
| Male | 12 (37.5) | 4 (50.0) | 19 (46) | 5 (50) |
| Female | 20 (62.5) | 4 (50.0) | 22 (54) | 5 (50) |
| Race, n (%) | ||||
| Caucasian | 29 (90.6) | 7 (87.5) | 28 (68) | 6 (60) |
| African American | 3 (9.38) | 1 (12.5) | 12 (29) | 4 (40) |
| Asian/Pacific | 0 | 1 (2) | 0 | |
| Islander | ||||
| Mean Age, years | 29.8 | 28.9 | 28.3 | 31.4 |
| Range (min, max) | 18, 44 | 18, 43 | 18, 41 | 18, 41 |
In the repeat-dose study, 41 subjects (22 males and 19 females), ages 18 to 41 years were enrolled and randomized to 1 of 5 treatment groups; 68% of subjects were Caucasian, as shown in Table 1. Thirty-seven subjects completed the study; three subjects discontinued participation due to scheduling conflicts, and one subject was discontinued due to non-compliance with study procedures. The PK population in this study therefore consisted of 29 subjects (13 females and 16 males) who received active study medication.
Pharmacokinetics
Single-Dose Study
The mean plasma drug concentrations increased at each sampling point in a dose proportional fashion up through 20 mg/kg. Measurable (DMB) concentrations were observed at the earliest time point (15 minutes post-dose) for all subjects at the lowest initial dose level of 2 mg/kg (n=6), although concentrations were below the LLQ for all subjects in this cohort at 48 and 72 hours. Only one subject in each of the 5 and 10 mg/kg cohorts had measurable concentrations at the 72 hour sampling point. The highest peak DMB plasma concentration detected in any subject was 105 μg/mL at the 0.75 hour sampling point, in the 20 mg/kg cohort.
The 20 mg/kg cohort was assessed under fasting and non-fasting conditions in a crossover fashion. Prior food ingestion was associated with a lower Cmax and later Tmax, but nearly identical terminal-phase pharmacokinetics (shown in Figure 1) and exposure (AUC) (shown in Table 2 and Supplemental Figures 1 and 2). Mean Cmax was reduced by 32% after food (89 μg/mL fasting vs. 60 μg/mL non-fasting; p = 0.0037), while median Tmax increased 5-fold from 0.75 hours in the fasting state to 4.50 hours in the non-fasting state (p = 0.0355, nonparametric analysis based on medians). DMB half-life, clearance, and distribution were unaffected by the presence of food.
Figure 1.
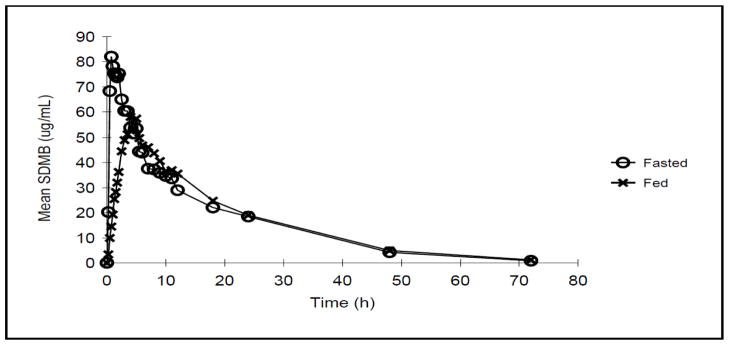
Mean Concentration-Time Plots with administration of SDMB after fasting or fed conditions (Single Dose Study, 20 mg/kg/dose level)
Table 2.
Comparison of Sodium 2,2 Dimethylbutyrate Administered under Fasted and Non-Fasting Conditions. Studies were performed at the 20 mg/kg dose level.
| Dependent Variable | Mean | Frel % | p-value | ||
|---|---|---|---|---|---|
| Fasting | Nonfasting | Difference | |||
| Cmax (μg/mL) | 88.92 | 60.40 | 28.52 | 67.9 | 0.0037 |
| AUC(0-last) h•μg/mL | 1174 | 1162 | 12.10 | 99.0 | 0.8559 |
| AUC (0-∞) h•μg/mL | 1190 | 1186 | 3.267 | 99.7 | 0.9638 |
| Tmax | 0.750 | 4.50 | −3.75 | NC | 0.0355 |
Abbreviations: CI: confidence interval; Frel: relative bioavailability; NC: not calculated; SD: standard deviation
Noncompartmental analyses of individual subject concentration-time data demonstrated that the estimated mean maximal plasma concentration (Cmax) values increased with dose from 4.8 to 20.4, 38.1, and 88.9 μg/mL, respectively, for the 2, 5, 10, and 20 mg/kg doses. Cmax was achieved rapidly from a mean of 0.6 hours following a 2 mg/kg dose to a mean of 1.3 hours following a 20 mg/kg dose. The mean half-life of SDMB at the differing dose levels ranged from 5.6 to 11.3 hours. Exposure (AUC) increased in a dose proportional fashion, ranging from 38.4 to 1190 h • μg/mL over the 2 to 20 mg/kg dose range. In general, the inter-subject variability in Cmax was very low, with CV% values ranging from 14 to 19%. Higher variability was evident in AUC with CV% values ranging from 13 to 61 per cent.
Repeat Dose Study
Mean plasma DMB concentration-time data for the repeat dose study are shown by treatment group in Figure 2, and Supplemental Figure 1. Dose proportional increases in mean plasma concentrations of SDMB were observed over the 5 to 15 mg/kg dose range at Day 0 and at steady state on Day 13.
Figure 2.

Mean Sodium 2,2 Dimethylbutyrate Plasma Concentration vs. Time Plots by Treatment Group – Day 13 (Repeat Dose Study)
Dose proportionality was assessed across all cohorts. Supplemental Figures 2a and 2b present plots of the Cmax at Day 0 and Day 13, respectively, presented along a regression line. Values for both parameters increased in a linear fashion. Inter-subject variability was low, and, in general, the concentration-time profiles appeared similar for all subjects. Administration of SDMB with food resulted in a significant delay in Tmax and a slight decrease in Cmax (Table 3), as observed with single ascending doses. There was a nearly 4-fold increase in Tmax after both a single dose (Day 0) and multiple doses (Day 13), as shown in Tables 2 and 3. The maximum study medication concentration (Cmax) at Day 13 decreased approximately 15% when taken after food ingestion (Figure 1, Table 2). However, there were no significant changes in total medication exposure as defined by AUC, also shown in Table 3.
Table 3.
Mean Plasma Non-Compartmental SDMB Pharmacokinetic Parameters – Food Effect at Day 0 and Day 13 (Cohorts 1 and 2; Repeat Dose Study)
| Day 0 | Day 13 | |||||||
|---|---|---|---|---|---|---|---|---|
| Cohort | Dose Level a (mg/kg) | Food Status | Cmax (μg/mL) | *Tmax (h) | AUCINF (h•μg/mL) | Cmax (μg/mL) | *Tmax (h) | AUCτ (h•μg/mL) |
| 1 | 5 | Fasted | 21.2 | 1.11 | 275 | 26.8 | 0.58 | 293 |
| 2 | 5 | Fed | 17.7 | 4.40 | 303 | 22.4 | 2.33 | 312 |
The * denotes a significant difference between fasted and fed states.
The SDMB pharmacokinetic profiles include rapid absorption within 15 minutes after ingestion, a half-life probably allowing once per day dosing, dose proportionality with exposure and low inter-subject variability. In addition, well-tolerated oral doses of SDMB result in plasma concentrations greater than those required in cell culture studies to induce fetal globin expression and proliferation of erythroid precursors.28,30 These attributes suggest a practicable agent for clinical application as a long-term therapeutic.
Concomitant ferrous fumarate was taken by subjects in Cohort 3 (5 mg/kg under fed conditions), and results were compared to those obtained in Cohort 2, who had received the same dose of study medication with food but without concomitant iron. There were no meaningful differences in Cmax, Tmax, or AUC on Day 0 or Day 13 in the presence or absence of iron (Table 4).
Table 4.
Day 0 Mean Plasma Non-Compartmental SDMB Pharmacokinetic Parameters versus Dose – Cohorts 2 and 3 (without and with Iron)
| Day 0 | Day 30 | ||||||||
|---|---|---|---|---|---|---|---|---|---|
| Cohort | Dose Level a (mg/kg) | Food Status | Iron Status | CMAX (μg/mL) | TMAX (h) | AUCINF (h•μg/mL) | Cmax (μg/mL) | Tmax (h) | AUCτ (h•μg/mL) |
| 2 | 5 | Fed | No | 17.7 | 4.40 | 303 | 22.4 | 2.33 | 312 |
| 3 | 5 | Fed | Yes | 16.3 | 4.35 | 287 | 24.8 | 2.88 | 360 |
Pharmacodynamics
This study was designed for evaluations of SDMB safety and PK, and did not provide dosing of sufficient duration to fully characterize SDMB pharmacodynamics. Nonetheless, limited pharmacodynamic data collected in the repeat-dose study revealed changes in absolute reticulocytes between mean baseline and peak values, usually occurring 2 weeks following completion of study dosing (at Day 27), consistent with the timing required for maturation of red blood cell precursors, as shown in Figure 3 and Table 6. Mean absolute reticulocytes (109 cells/L) in the placebo group at baseline and Day 27 were 51 +/− 12 and 62 +/− 20, respectively, which was not statistically significant (p=0.19). Mean absolute reticulocytes increased on average from 50% to 60% above the mean baseline values in the subjects who received study medication. For example, at baseline in Cohort 1 (5 mg/kg, fasted) mean absolute reticulocytes were 50 +/−12 and mean peak reticulocytes were 81 +/− 24, (p=0.02); in Cohort 4 (10 mg/kg) mean baseline reticulocytes were 58 +/− 8 and mean peak reticulocytes were 84 +/− 14, (p=0.003), and in Cohort 5 (15 mg/kg; fed), the mean baseline was 46 +/− 11 and mean peak level was 72 +/− 11, a 50% increase (p=0.001). No changes in laboratory values consistent with hemolysis, such as elevations in LDH or bilirubin, or declines in Hgb or hematocrit were observed in treated patients to suggest that the reticulocyte changes were secondary to hemolysis. No differences were detected between Caucasian and African American subjects in reticulocyte response rates in this small sample. Although there was a trend toward SDMB associated increases in F-reticulocytes, comparison with placebo responses were not statistically significantly different in these small groups.
Figure 3.

Mean absolute reticulocytes at baseline (white bars) and with treatment (dark bars). The asterisks demonstrate where significant changes were detected.
Table 6.
Mean absolute reticulocytes (109 cells/L) at baseline and peak values.
| Pre | Peak | p Value vs. placebo | |||
|---|---|---|---|---|---|
| SDMB dose | Mean | SD | Mean | SD | |
| Placebo | 52 | 12 | 62 | 20 | |
| 5 mg/kg (fasted) | 50 | 12 | 81 | 24 | 0.03 |
| 10 mg/kg (fed) | 58 | 8 | 84 | 14 | 0.055 |
| 15 mg/kg (fed) | 46 | 11 | 72 | 11 | 0.02 |
Safety Results
In the single-dose study, SDMB was well-tolerated at all dose levels (Table 5a). There were no serious adverse events, deaths, or discontinuations from study due to adverse events. Most AEs were grade 1 (mild) in severity and considered unrelated to study medication. Headache was the most common AE (28.0% in treated and 25% in controls), with higher frequency in fasting subjects. Three AEs in three different subjects were considered possibly related to study drug: upper abdominal pain, in a subject receiving 2 mg/kg, and dysphoria and dizziness in subjects receiving 10 mg/kg. There were no clinical or laboratory findings suggesting significant intolerance or toxicity in any of the dose level cohorts.
Table 5a.
Subject Incidence of Adverse Events in the Single Dose Study
| Adverse Events | Placebo N=8 |
SDMB N=24 |
|---|---|---|
|
| ||
| Headache | 2 | 7 |
| Vessel puncture site hematoma | 1 | 4 |
| Dizziness | 2 | 3 |
| Nausea | 1 | 2 |
| URI | 1 | 2 |
| Diarrhea | 1 | 2 |
| Anxiety | 1 | |
| Dysmenorrhea | 1 | |
| Injection | 1 | |
| Menorrhagia | 1 | |
| Pain in extremity | 1 | |
| Pharyngitis | 1 | |
| Pharyngolaryngeal pain | 1 | |
| Sialoadenitis | 1 | |
In the repeat-dose study, SDMB was similarly well-tolerated at all dose levels evaluated (Table 5b). No laboratory findings or clinically significant AEs, or SAEs, leading to discontinuation were reported. The most common AE was mild headache, which occurred in 23%, whereas 40% of subjects in the placebo-treated subjects reported headache. No DLT was noted in the dosing range evaluated.
Table 5b.
Subject Incidence of Adverse Events in the Multi-dose Study
| Adverse Events | Placebo N=10 |
SDMB N=31 |
|---|---|---|
|
| ||
| Headache | 4 | 7 |
| Menstrual Cramps | 1 | 2 |
| Diarrhea | 2 | |
| Flatulence | 2 | |
| Nausea | 2 | |
| Pharyngitis | 2 | |
| Abdominal distention | 1 | |
| Contusion of hand (s) | 1 | |
| Dyspepsia | 1 | |
| Emesis | 1 | |
| Euphoria | 1 | |
| Foot pain | 1 | |
| Intra-ocular infection | 1 | |
| Lymphadenopathy, axillary | 1 | |
Elevated creatine phosphokinase (CK) levels were observed at baseline and at later time points on study in 6 of 10 subjects who received placebo and 15 of 30 subjects who received SDMB, across all dose levels and laboratory sampling points. These minor elevations at random times were classified by the PI as not clinically significant and were not reported as AEs. No apparent dose-response relationship with CK levels was noted, and there were no findings suggestive of clinical myopathy or cardiac injury, i.e., no myalgias, weakness, brown urine or chest discomfort. The proportion of subjects with CK elevations was not statistically different between placebo and treated subjects. The Principal Investigator (PI) did not consider elevated CK values related to study medication, as asymptomatic CK elevations are commonly observed in multiple studies at the clinical site and often attributed to prior exercise and commonly normalizing after inactivity.
Discussion
Additional therapeutics are needed for treatment of the underlying pathology in beta globin diseases.1,2,15,29 Although hydroxyurea is a centrally important therapeutic in reducing crisis frequency and prolonging survival in SCD patients,1, 23–25 some patients are reluctant to utilize this agent because of concerns regarding potential mutagenicity, carcinogenicity and teratogencity.
SDMB is an oral SCFA that stimulates fetal globin gene expression in many experimental models, proliferation of human erythroid progenitor cells in culture, and increases red blood cell counts in phlebotomized baboons.26–27 SDMB does not induce mutagenicity in the Ames assay, the lymphocyte chromosomal aberration assay, or micrococcal nuclease testing. Twenty-six week repeat dose toxicology studies with SDMB in rats and dogs have not shown any significant adverse effects at dose levels up to 500 mg/kg/day. At the dose levels evaluated here, SDMB was well-tolerated without significant toxicity. There were no imbalances in rates of AEs or laboratory abnormalities when comparing SDMB safety to that associated with placebo.
Based on precedents with hydroxyurea, arginine butyrate, and phenylbutyrate, where months of treatment are typically required for augmentation of fetal globin levels, no pharmacodynamic effects from SDMB treatment were anticipated in healthy adult individuals in the brief time-frame of this study. However, increases in absolute reticulocytes, without hemolysis, suggested an erythropoietic effect at all dose levels in the 2-week dosing study, an early indication of erythropoietic effects. In summary, the favorable safety profile, pharmacokinetic features, and early erythropoietic effects observed in this study support further investigation of SDMB in anemic subjects with beta globin diseases.
Supplementary Material
Acknowledgments
Funding for these studies was provided by HemaQuest Pharmaceuticals, Inc.
We are deeply grateful for the support of the NIH-RAID Pilot Program in making this study possible, for production of the investigational therapeutic and placebo, and for performing several preclinical studies required for the IND for SDMB. We are also grateful to Dr. Frans Kuypers for performing the Advia analyses for absolute reticulocytes, to Shirley Purvis for expert analysis of F-reticulocytes, and to Dr. Robin Downey for serving as Principal Investigator.
References
- 1.Steinberg MH, Rodgers GP. Pharmacologic modulation of fetal hemoglobin. Medicine (Baltimore) 2001;80(5):328–344. doi: 10.1097/00005792-200109000-00007. [DOI] [PubMed] [Google Scholar]
- 2.Steinberg MH. Predicting clinical severity in sickle cell anemia. Brit J Haematol. 2005;129(4):465–481. doi: 10.1111/j.1365-2141.2005.05411.x. [DOI] [PubMed] [Google Scholar]
- 3.Perrine RP, Brown MJ, Clegg JB, Weatherall DJ, May A. Benign sickle anemia. Lancet. 1972;2 (7788):1163–1167. doi: 10.1016/s0140-6736(72)92592-5. [DOI] [PubMed] [Google Scholar]
- 4.Bunn HF. Pathogenesis and treatment of sickle cell disease. N Engl J Med. 1997;337:762. doi: 10.1056/NEJM199709113371107. [DOI] [PubMed] [Google Scholar]
- 5.Nagel RL, Bookchin RM, Johnson J, et al. Structural bases of the inhibitory effects of hemoglobin F and A2 on the polymerization of hemoglobin S. Proc Natl Acad Sci USA. 1979;76:670–672. doi: 10.1073/pnas.76.2.670. [DOI] [PMC free article] [PubMed] [Google Scholar]
- 6.Perrine RP, Pembrey ME, John P, Perrine S, Shoup F. Natural history of sickle cell anemia in Saudi Arabs. A study of 270 subjects. Ann Intern Med. 1978;88:1–6. doi: 10.7326/0003-4819-88-1-1. [DOI] [PubMed] [Google Scholar]
- 7.Noguchi CT, Rodgers GP, Sergeant G, Schechter AN. Levels of fetal hemoglobin necessary for treatment of sickle cell disease. N Engl J Med. 1988;318(2):96–99. doi: 10.1056/NEJM198801143180207. [DOI] [PubMed] [Google Scholar]
- 8.Platt OS, Thorington BD, Brambilla DJ, et al. Pain in sickle cell disease. Rates and risk factors. N Eng J Med. 1991;325(1):11–16. doi: 10.1056/NEJM199107043250103. [DOI] [PubMed] [Google Scholar]
- 9.Platt OS, Brambilla DJ, Rosse WF, et al. Mortality in sickle cell disease: Life expectancy and risk factors for early death. N Eng J Med. 1994;330(23):1639–1644. doi: 10.1056/NEJM199406093302303. [DOI] [PubMed] [Google Scholar]
- 10.Franco RS, Yasin Z, Palascak MB, Ciraolo P, Joiner CH, Rucknagel DL. The effect of fetal hemoglobin on the survival characteristics of sickle cells. Blood. 2006;108(3):1073–1076. doi: 10.1182/blood-2005-09-008318. [DOI] [PMC free article] [PubMed] [Google Scholar]
- 11.Powars D, Weiss JN, Chan LS, Schroeder WA. Is there a threshold level of fetal hemoglobin that ameliorates morbidity in sickle cell anemia? Blood. 1984;63:921–926. [PubMed] [Google Scholar]
- 12.Kato GJ, Gladwin MT, Steinberg MH. Deconstructing sickle cell disease: reappraisal of the role of hemolysis in the development of clinical subphenotypes. Blood Rev. 2007;21:37–47. doi: 10.1016/j.blre.2006.07.001. [DOI] [PMC free article] [PubMed] [Google Scholar]
- 13.Rodgers GP, Dover GJ, Uyesaka N, Noguchi CT, Schechter AN, Nienhuis AW. Augmentation by erythropoietin of the fetal hemoglobin response to hydroxyurea in sickle cell disease. N Engl J Med. 1993;328:73–80. doi: 10.1056/NEJM199301143280201. [DOI] [PubMed] [Google Scholar]
- 14.Chang YC, Smith KD, Moore RD, Serjeant GR, Dover GJ. An analysis of fetal hemoglobin variation in sickle cell disease: the relative contributions of the X-linked factors, beta-globin haplotypes, alpha-globin gene number, gender, and age. Blood. 1995;85:1111–1117. [PubMed] [Google Scholar]
- 15.Perrine SP. Fetal globin induction: can it cure beta thalassemia? Am Soc Hematol Educ Program. 2005:38–44. doi: 10.1182/asheducation-2005.1.38. [DOI] [PMC free article] [PubMed] [Google Scholar]
- 16.Perrine SP, Ginder GD, Faller DV, et al. A short-term trial of butyrate to stimulate fetal-globin-gene expression in the beta-globin disorders. N Eng J Med. 1993;328:81–86. doi: 10.1056/NEJM199301143280202. [DOI] [PubMed] [Google Scholar]
- 17.Little JA, Dempsey NJ, Tuchman M, Ginder GD. Metabolic persistence of fetal hemoglobin. Blood. 1995;85:1712. [PubMed] [Google Scholar]
- 18.Atweh GF, Sutton M, Nassif I, et al. Sustained induction of fetal hemoglobin by pulse butyrate therapy in sickle cell disease. Blood. 1999;93:1790–1797. [PMC free article] [PubMed] [Google Scholar]
- 19.Collins AF, Pearson HA, Giardina P, McDonagh KT, Brusilow SW, Dover GJ. Oral sodium phenylbutyrate therapy in homozygous β thalassemia: A clinical trial. Blood. 1995;85:43–49. [PubMed] [Google Scholar]
- 20.Perrine SP, Castaneda SA, Boosalis MS, White GL, Jones BM, Bohacek R. Induction of fetal globin in β-Thalassemia: Cellular obstacles and molecular progress. Ann NY Acad Sci. 2005;1054:1–9. doi: 10.1196/annals.1345.033. 2005 New York Academy of Sciences. [DOI] [PMC free article] [PubMed] [Google Scholar]
- 21.Dover GJ, Brusilow SW, Charcahe S. Induction of HbF production in subjects with sickle cell anemia by oral sodium phenylbutyrate. Blood. 1994;84:339–342. [PubMed] [Google Scholar]
- 22.Nagel RL, Vichinsky E, Shah M, Johnson R, Spadacino E, Fabry M, Mangahas L, Abel R, Stamatoyannopoulos G. F-reticulocytes response in sickle cell anemia treated with recombinant human erythropoietin: a double blind study. Blood. 1993;81:9–14. [PubMed] [Google Scholar]
- 23.Charache S, Dover GJ, Moyer MA, Moore JW. Hydroxyurea-induced augmentation of fetal hemoglobin production in subjects with sickle cell anemia. Blood. 1987;69:109. [PubMed] [Google Scholar]
- 24.Steinberg MH, Lu ZH, Barton FB, Terrin ML, Charache S, Dover GJ. Fetal hemoglobin in sickle cell anemia: determinants of response to hydroxyurea. Blood. 1997;89:1078–1088. [PubMed] [Google Scholar]
- 25.Steinberg MH, Barton F, Castro O, et al. Effects of hydroxyurea on mortality and morbidity in adult sickle cell anemia: risks and benefits up to 9 years of treatment. JAMA. 2003;289:1645–1651. doi: 10.1001/jama.289.13.1645. [DOI] [PubMed] [Google Scholar]
- 26.Boosalis MS, Bandyopadhyay R, Bresnick EH, et al. Short chain fatty acid derivatives stimulate cell proliferation and induce STAT-5 activation. Blood. 2001;97:3259–3267. doi: 10.1182/blood.v97.10.3259. [DOI] [PMC free article] [PubMed] [Google Scholar]
- 27.Pace BS, White GL, Dover GJ, Boosalis MS, Faller DV, Perrine SP. Short-chain fatty acid derivatives induce fetal globin expression and erythropoiesis in vivo. Blood. 2002;100:4640–4648. doi: 10.1182/blood-2002-02-0353. [DOI] [PMC free article] [PubMed] [Google Scholar]
- 28.Castaneda S, Boosalis MS, Emery D, Thies A, Faller DV, Perrine SP. Enhancement of growth and survival and alterations in bcl-family proteins in beta thalassemic erythroid progenitors by novel short chain fatty acid derivatives. Blood Cells, Molecules, & Diseases. 2005;35:217–226. doi: 10.1016/j.bcmd.2005.06.007. [DOI] [PMC free article] [PubMed] [Google Scholar]
- 29.Perrine SP. Fetal globin stimulant therapies in the beta-hemoglobinopathies: principles and current potential. Pediatr Annals. 2008;37:339–346. doi: 10.3928/00904481-20080501-10. [DOI] [PubMed] [Google Scholar]
- 30.Cappellini MD, Graziadei G, Ciceri L, et al. Oral Isobutyramide therapy in subjects with thalassemia intermedia: results of a phase II open study. Blood Cells Molecules, Dis. 2000;26:105–111. doi: 10.1006/bcmd.2000.0283. [DOI] [PubMed] [Google Scholar]
- 31.Resar LMS, Segal JB, Fitzpatrick LK, et al. Induction of fetal hemoglobin synthesis in children with sickle cell anemia on low-dose oral sodium phenylbutyrate therapy. J Pediatr Hematol/Oncol. 2002;24:737–741. doi: 10.1097/00043426-200212000-00011. [DOI] [PubMed] [Google Scholar]
- 32.Ikuta T, Kan YW, Swerdlow PS, Faller DV, Perrine SP. Alterations in protein-DNA interactions in the γ-globin gene promoter in response to butyrate therapy. Blood. 1998;92:2924–2933. [PubMed] [Google Scholar]
- 33.Emery DW, Yannaki E, Tubb J, Nishino T, Li Q, Stamatoyannopoulos G. development of virus vectors for gene therapy of beta chain hemoglobinopathies: flanking with a chromatin insulator reduces gamma globin gene silencing in vivo. Blood. 2002;100:2012–2019. doi: 10.1182/blood-2002-01-0219. [DOI] [PubMed] [Google Scholar]
- 34.Parise RA, Beumer JH, Kangani CO, Holleran JL, Eiseman JL, Smith NF, Covey JM, Perrine SP, Egorin MJ. Liquid chromatography-mass spectrometric assay for quantitation of the short-chain fatty acid, 2,2-dimethylbutyrate (NSC 741804), in rat plasma. J Chromatogr B Analyt Technol Biomed Life Sci. 2008;862:168–74. doi: 10.1016/j.jchromb.2007.12.002. [DOI] [PMC free article] [PubMed] [Google Scholar]
Associated Data
This section collects any data citations, data availability statements, or supplementary materials included in this article.