

Abstract
Objectives
Understanding the similarities and differences between substance use rates for American Indian (AI) young people and young people nationally can better inform prevention and treatment efforts. We compared substance use rates for a large sample of AI students living on or near reservations for the years 2009–2012 with national prevalence rates from Monitoring the Future (MTF).
Methods
We identified and sampled schools on or near AI reservations by region; 1,399 students in sampled schools were administered the American Drug and Alcohol Survey. We computed lifetime, annual, and last-month prevalence measures by grade and compared them with MTF results for the same time period.
Results
Prevalence rates for AI students were significantly higher than national rates for nearly all substances, especially for 8th graders. Rates of marijuana use were very high, with lifetime use higher than 50% for all grade groups. Other findings of interest included higher binge drinking rates and OxyContin® use for AI students.
Conclusions
The results from this study demonstrate that adolescent substance use is still a major problem among reservation-based AI adolescent students, especially 8th graders, where prevalence rates were sometimes dramatically higher than MTF rates. Given the high rates of substance use-related problems on reservations, such as academic failure, delinquency, violent criminal behavior, suicidality, and alcohol-related mortality, the costs to members of this population and to society will continue to be much too high until a comprehensive understanding of the root causes of substance use are established.
The American Indian (AI) population is relatively small compared with other racial/ethnic minority groups in the United States. Yet, this population is disproportionately affected by a variety of health problems, including substance abuse.1 Based on our ongoing surveillance of this group and data from other studies, AI adolescent substance use rates for alcohol, marijuana, inhalants, and other drugs have been consistently higher than their Euro-American counterparts since at least 1975.2–4 For example, in 2004, last-month illicit drug use (e.g., marijuana, inhalants, prescription drugs, methamphetamine, and/or cocaine) among AI/Alaska Native (AN) young people aged 12–17 years was 26.0% compared with 10.6% for their non-AI/AN counterparts.5 For the time period 1993–2005, young people living on or near AI reservations were found to have equal or higher rates of use for all substance use measures at each grade level when compared with nationally representative rates from the annual Monitoring the Future (MTF) survey conducted by the University of Michigan Institute for Social Research. The differences were greatest for marijuana.6 Furthermore, surveys of reservation-based AI young people have shown that their rates of use are not only higher than national rates, but are also higher than the rates of non-reservation AI young people.7,8
Given the high rates of substance use that have been reported for AI young people and, in particular, reservation-based AI young people, it is essential that researchers monitor substance use among this group to better inform prevention and treatment efforts that will aid in reducing the resulting substantial health, social, and economic costs.9 However, the few studies that have measured substance use rates for reservation AI young people have typically used limited samples, often focusing on one or two tribes or a subset of a tribe. At the same time, studies that have relied on large national samples have included a relatively small number of AIs, with most of those being non-reservation AIs.10
We present substance use rates for a large sample of AI young people living on or near reservations as part of our ongoing surveillance of this group. We computed lifetime, annual, and last-month prevalence rates for 8th-, 10th-, and 12th-grade AI young people for the time period 2009–2012 and compared them with national prevalence rates from MTF for that same time period.
METHODS
Participants
Participants for this study were part of an annual survey of AI young people who reside on or near reservations. We identified schools with ≥20% AI students on or near reservations, stratified these schools by region, and then sampled them according to the relative AI population within that region based on 2000 U.S. Census data for designated AI areas. The sampling scheme is based on six geographic regions in which reservation-based AIs reside (Northwest, Northern Plains, Northeast, Southeast, Southern Great Plains, and Southwest), with recruitment in each region to approximate the percentage of AIs residing in each respective region. We based our regional designations on those delineated by Snipp,11 who noted that although there is significant diversity among tribes, different areas of the country are identified with tribes that share some common qualities. Three states were excluded from the sampling frame: Alaska and California were excluded due to survey protocols required by those states, while Oklahoma was excluded because most Oklahoma tribes do not occupy reservations as such; rather, they live in areas designated as Oklahoma Tribal Statistical Areas. No identified schools in the Northeast participated in the survey. Thus, for this analysis, we used data from five regions: Northern Plains, Southwest, Upper Great Lakes, Northwest, and Southeast.
Schools were paid $500 for participation and given a comprehensive report on their survey findings. Because the survey is voluntary, one or more regions may be underrepresented in any given year. Thus, in the following year, recruitment is increased in underrepresented regions. For this study, we combined three school years—2009–2010, 2010–2011, and 2011–2012—to obtain a sample with a regional distribution that was more closely aligned with that of the population.
A total of 33 schools were surveyed in 11 states with reservations (Alabama, Arizona, Minnesota, Montana, Nebraska, Nevada, North Dakota, Oregon, South Dakota, Washington, and Wisconsin). Twenty-five of the schools were located within the boundaries of AI reservations, while eight schools enrolled students from nearby reservations. Twenty-eight schools were public schools and five were Bureau of Indian Education schools. Combining data from all schools, the number of completed surveys represented 80% of student enrollment in those schools.
Because the primary purpose of this study was to compare AI substance use with MTF findings for the same time period, only students in the 8th, 10th, and 12th grades who self-identified on the survey as AI were included in the analysis, resulting in a final sample of 601 8th graders, 448 10th graders, and 350 12th graders.
Procedures
Once tribal and/or school approvals were obtained, surveys were administered by school staff during normal classroom sessions. Parents could opt out their children by returning a form sent via mail or by contacting the school. Students could also decline to participate or choose to leave blank any questions they did not wish to answer. Fewer than 1% of students refused to take the survey or were opted out by their parents. Teachers and/or staff were instructed to remain in the area but not close enough to observe student responses. Students placed their completed surveys in an envelope, which was then sealed and sent back for scanning.
Instrument and measures.
Students were administered the American Drug and Alcohol Survey (ADAS), an instrument that has been in use, with substantial updates, since the mid-1980s. Its various measures, including substance use measures, have been shown to be reliable and valid,12 and it is listed in the Substance Abuse and Mental Health Services Administration's Measures and Instruments Resource guide.13 Names and types of substances have been continuously updated to reflect the current substances and nomenclature being used by young people. The wording for substances is similar to that of MTF; any substantial differences are noted in Table 1.
Table 1.
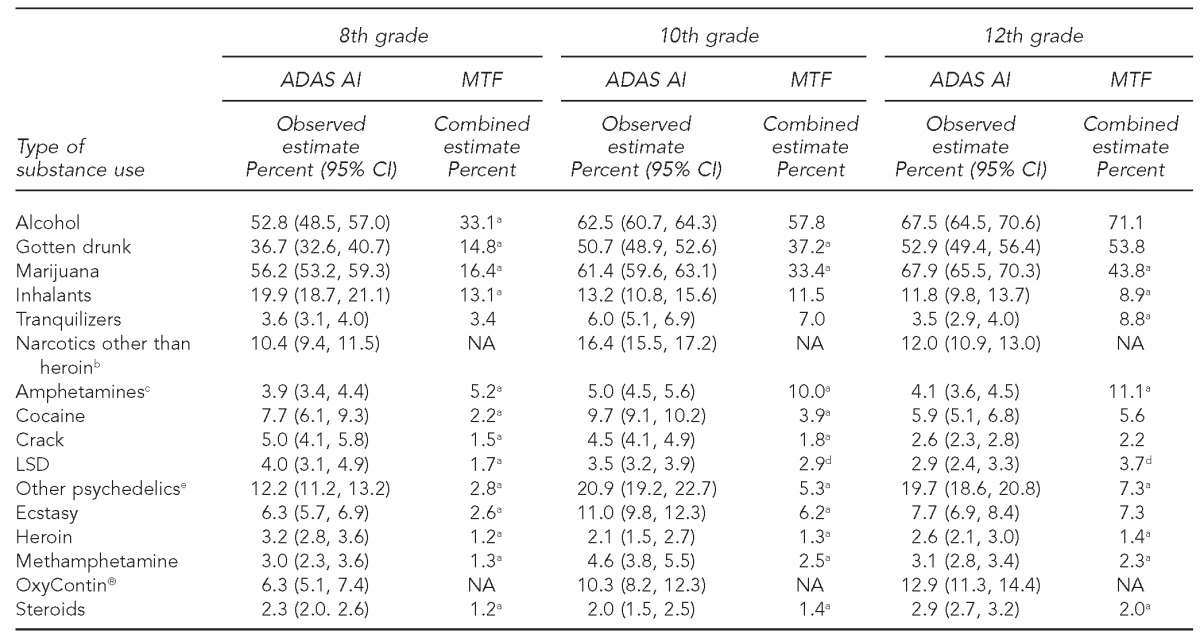
Lifetime prevalence of alcohol and drug use comparing reservation AI and MTF students in the U.S.,combining years 2009–2011
aa = 0.01
bNarcotics other than heroin examples used in survey wording: ADAS: codeine, methadone, opium, and morphine; MTF: methadone, opium, morphine, codeine, Demerol, Vicodin, OxyContin, and Percocet.
cAmphetamine examples used in survey wording: ADAS: uppers, bennies, speed, etc., not including legal stimulants; MTF: uppers, ups, pep pills, and drugs such as Adderall and Ritalin, taken without a doctor's permission and not including nonprescription drugs.
da = 0.05
eOther psychedelic examples used in survey wording: ADAS: mescaline, peyote, mushrooms, etc.; MTF: mescaline, Peyote, “shrooms” or Psilocybin, and PCP. MTF uses the wording “hallucinogens” in place of “psychedelics.”
AI = American Indian
MTF = Monitoring the Future
ADAS = American Drug and Alcohol Survey
CI = confidence interval
NA = not available
LSD = lysergic acid diethylamide
PCP = phencyclidine
Analysis
For each substance on the survey, lifetime, annual, and last-month prevalence levels were computed by grade. Because the sample was stratified and clustered, prevalence levels and their 95% confidence intervals (CIs) were computed using Stata®.14 The sample was specified as being stratified by region, with the primary sampling unit being a community. In addition, to correct for over- or underrepresentation by region, observations were weighted accordingly.
MTF national estimates from 2009, 2010, and 201115–17 were combined to provide a more valid comparison with our data. The observed MTF estimate for each prevalence measure is a weighted mean based on the number of observations per year, and a combined variance for each estimate was computed. We used an independent sample t-test, assuming equal variance, to test for statistically significant differences (a=0.05 and 0.01 were considered significant) between mean substance use for the two samples.
RESULTS
Tables 1–3 contain lifetime, annual, and last-month prevalence rates, respectively, for a variety of substances for 8th, 10th, and 12th graders. In each table, the mean estimates and the 95% CIs for AI young people are given, while only the observed estimates are shown for the nationally representative sample.
Table 2.
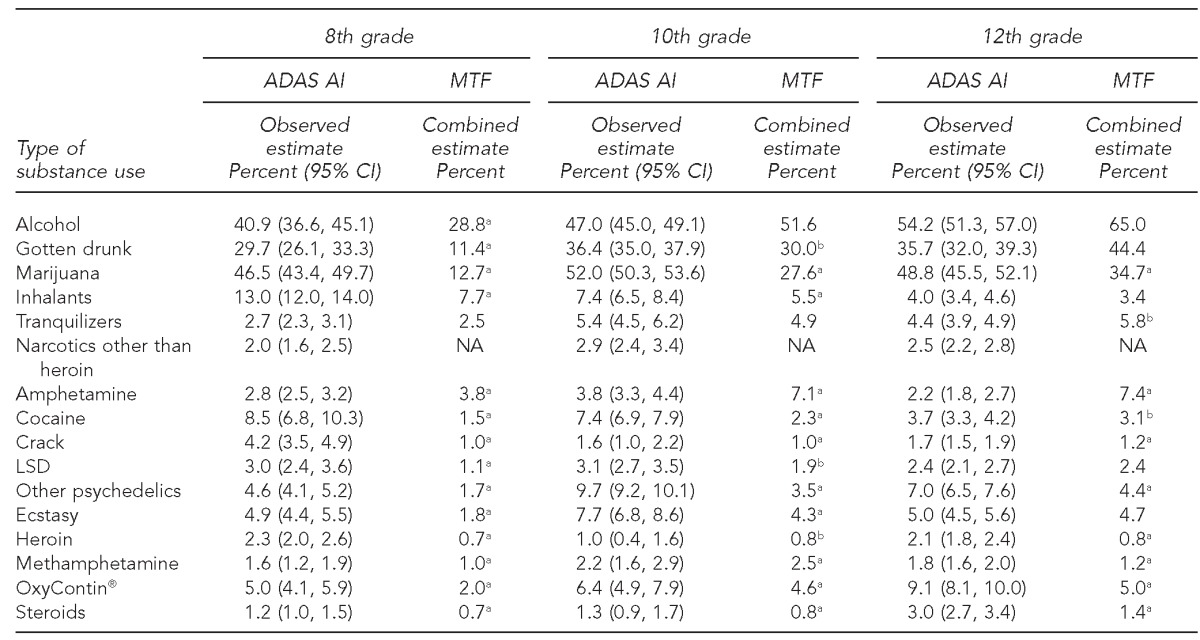
Annual prevalence of alcohol and drug use comparing reservation AI and MTF students in the U.S., combining years 2009–2011
aa = 0.01
ba = 0.05
AI = American Indian
MTF = Monitoring the Future
ADAS = American Drug and Alcohol Survey
CI = confidence interval
NA = not available
LSD = lysergic acid diethylamide
Table 3.
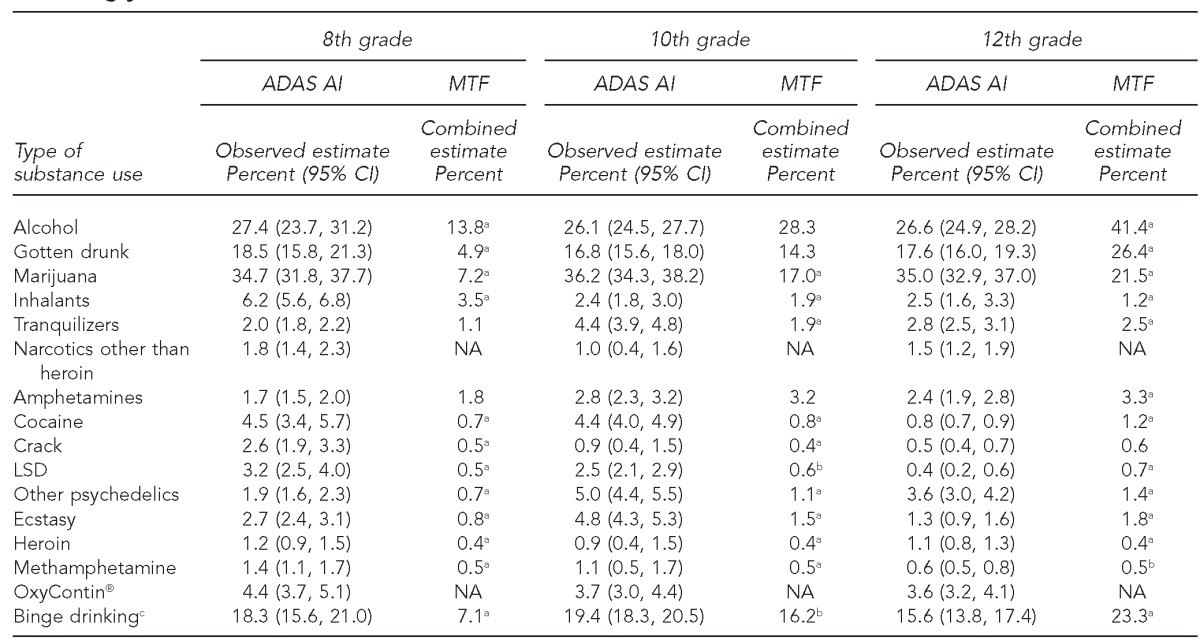
Last-month prevalence of alcohol and drug use comparing reservation AI and MTF students in the U.S., combining years 2009–2011
aa = 0.01
ba = 0.05
c≥5 drinks in a two-hour period during the last two weeks
AI = American Indian
MTF = Monitoring the Future
ADAS = American Drug and Alcohol Survey
CI = confidence interval
NA = not available
LSD = lysergic acid diethylamide
Lifetime prevalence
As shown in Table 1, the highest lifetime use rate for 8th-grade AI young people was for marijuana (56.2%), followed by alcohol (52.8%) and gotten drunk (36.7%). Approximately 19.9% of AI 8th graders reported using inhalants. Also at relatively high levels of use were narcotics other than heroin (10.4%) and other psychedelics (12.2%).
Among AI 10th graders, the ranking for lifetime prevalence was alcohol (62.5%), marijuana (61.4%), and gotten drunk (50.7%). The use rates of other substances were much lower, with other psychedelics at 20.9%, narcotics other than heroin at 16.4%, inhalants at 13.2%, ecstasy at 11.0%, and OxyContin® at 10.3% (Table 1).
For 12th graders, use rates were similar to those for 10th graders, with the highest rates of use for marijuana (67.9%), alcohol (67.5%), and gotten drunk (52.9%), followed by other psychedelics (19.7%), OxyContin (12.9%), narcotics other than heroin (12.0%), and inhalants (11.8%). Heroin and LSD had some of the lowest lifetime use rates, with rates for all grade levels at ≤4% (Table 1).
For 8th and 10th graders, lifetime prevalence rates for all substances except tranquilizers and amphetamines were significantly higher for AI young people than for MTF young people, with many AI rates at least twice those for MTF. For example, 36.7% of AI 8th graders reported ever getting drunk compared with 14.8% of 8th graders nationally. Additionally, 56.2% of AI 8th graders and 61.4% of AI 10th graders reported ever using marijuana compared with 16.4% and 33.4% of 8th- and 10th-grade students nationally. For amphetamines, the national rates were significantly higher than the rates for AI young people, with AI rates of 3.9%, 5.0%, and 4.1% for those in 8th, 10th, and 12th grade, respectively, compared with national rates of 5.2%, 10.0%, and 11.1% of 8th, 10th, and 12th graders, respectively. These differences may be due, in part, to the differences in survey wording. The ADAS wording is “amphetamines (uppers, speed, etc. do NOT include legal stimulants),” while MTF asks about amphetamines used without a doctor's orders and includes a pre-specified list with prescribed drugs such as Ritalin, Adderall, and Concerta®18 (Table 1).
Annual prevalence
Table 2 shows annual prevalence rates for substance use. Mirroring lifetime prevalence, the highest annual use rate for AI 8th graders was for marijuana (46.5%), followed by alcohol (40.9%), gotten drunk (29.7%), and inhalants (13.0%). Among 10th graders, the ranking for annual prevalence was marijuana (52.0%), alcohol (47.0%), and gotten drunk (36.4%). For 12th graders, annual use rates were similar to those for 10th graders, with the highest rates of use for alcohol (54.2%), marijuana (48.8%), and gotten drunk (35.7%). The next highest annual rate for 12th graders was for OxyContin (9.1%). LSD, methamphetamine, and heroin use had some of the lowest annual rates (≤3.1%) for all three grades.
In comparing national and AI rates, the results were similar to those of lifetime prevalence, with AI young people using substances at greater rates than their non-AI counterparts. For 8th and 10th graders, use was significantly greater for AI young people than for young people nationally for all substances except tranquilizers and amphetamines. For 12th graders, there were fewer significant differences. Alcohol, drunkenness, ecstasy, inhalants, and LSD rates were not significantly different from national rates. Marijuana again showed the most striking difference in rates, with 48.8% of AI 12th graders reporting using in the last year vs. a national rate of 34.7% (Table 2).
Last-month prevalence
As expected, rates for last-month prevalence dropped significantly from annual rates for all grade groups. The highest last-month rate for 8th-grade AI young people was once again for marijuana (34.7%), followed by alcohol (27.4%), gotten drunk (18.5%), and inhalants (6.2%). Among 10th graders, the ranking for last-month prevalence was marijuana (36.2%), alcohol (26.1%), and gotten drunk (16.8%). For 12th graders, last-month use rates for alcohol (26.6%), marijuana (35.0%), and gotten drunk (17.6%) were similar to those for 10th graders. However, many of the rates for 12th graders were significantly lower than those for 8th and 10th graders. Table 3 also shows rates for binge drinking (≥5 drinks in a two-hour period during the last two weeks). The AI rates were 18.3% for 8th graders, 19.4% for 10th graders, and 15.6% for 12th graders.
Comparing 8th-grade national and AI rates showed that last-month use of substances was significantly higher for AI young people, except for tranquilizers and amphetamines, where the differences were not significant. Last-month marijuana use for AI 8th graders (34.7%) was almost five times that of non-AI 8th graders (7.2%), while AI rates for gotten drunk and binge drinking (18.5% and 18.3%, respectively) were also much higher than the national rates (4.9% and 7.1%, respectively). For 10th graders, AI rates for alcohol use, ever gotten drunk, and amphetamines were not significantly different from the national rates. The difference between the AI rate and the national rate for binge drinking among 10th graders (19.4% vs. 16.2%) was much lower than for 8th graders (18.3% vs. 7.1%) (Table 3).
The pattern of results changed considerably for 12th graders. Last-month national 12th-grade rates of alcohol use, drunkenness, and binge drinking (41.4%, 26.4%, and 23.3%, respectively) were all significantly higher than the rates for AI 12th graders (26.6%, 17.6%, and 15.6%, respectively). In addition, national last-month rates for ecstasy, LSD, cocaine, and amphetamines were also higher than the comparable AI rates. Last-month marijuana use for AI young people (35.0%) was still higher than the national rate (21.5%), as were many of the other substance use rates. However, the differences in the rates were, for the most part, considerably smaller than the comparable differences in 8th and 10th grades (Table 3).
DISCUSSION
The results from this study demonstrate that adolescent substance use is still a major problem among reservation-based AI students. This finding is especially true for 8th graders, where lifetime, annual, and last-month prevalence rates were significantly higher than the national rates for nearly all substances. In many cases, the differences were quite dramatic. For example, AI 8th-grade lifetime marijuana use was 56.2% compared with the national rate of 16.4%, while the rate for ever getting drunk for AI young people was 36.7% compared with 14.8% nationally. For other psychedelics, the AI rate of 12.2% was five times higher than the national rate. Binge drinking by AI 8th graders was reported at 18.3%, while the national rate was 7.1%. The alcohol results were consistent with research showing that AI young people drink at younger ages than their non-AI counterparts.19,20
On the other hand, AI 12th graders showed significantly lower alcohol-related rates for last-month use compared with the national rates. In addition, binge-drinking rates were higher for 12th graders nationally than for AI young people (23.3% vs. 15.6%, respectively). The finding of lower last-month use for AI 12th graders likely reflects, at least in part, the extremely high dropout rates for AIs.21 For example, Faircloth and Tippeconnic22 found that fewer than half of AI students in 12 states with high percentages of AI populations graduate from high school, compared with approximately 70% of the non-native populations in those states. At one extreme, the graduation rates in South Dakota were 75.6% for non-AI young people and 30.4% for AI young people.
This study also found that although lifetime rates of substance use for AI 12th graders were in many cases higher than national rates, the difference between AI and national rates, including the alcohol measures, decreased or reversed direction for annual and last-month rates. This finding suggests that some AI young people who stay in school may have experimented significantly with alcohol and other substances at younger ages, but by 12th grade were infrequent or non-users. It may be that the risk for continued use or excessive drinking was reduced among those AI young people who remained in school. A longitudinal study is required to examine this hypothesis and to identify the factors that lead to lower substance use at higher grades.
Beginning in 2009, the ADAS included OxyContin® for last-month, annual, and lifetime use, while MTF measured OxyContin annual prevalence during this time period. Comparing the AI and MTF annual rates showed higher AI rates for all age groups. By 12th grade, 9.1% of AI young people reported using OxyContin in the past year, compared with 5.0% nationally. The last-month use rate was 3.6% for AI young people, one of the higher rates outside of alcohol and marijuana. Very little research has been done on the use of OxyContin among AIs. In a study of Midwestern rural reservation AIs, Momper et al.23 found evidence consistent with high rates of substance use among adults combined with the ability to buy the drug on reservations. The authors noted that their findings were consistent with reports of increased selling of OxyContin prescriptions in poor rural areas as a source of income.24,25 Future studies that contribute to understanding which AI young people are using this drug, how they are using it, and where they are obtaining it seem imperative.
Some of the most conspicuous findings were the very high rates of marijuana use at all ages—use rates that were often greater than those for alcohol. Marijuana use rates have been high for AI young people for more than a decade.26 Whitesell et al.10 found a disproportionate risk for marijuana initiation among younger members of two reservation communities (located in the Northern Plains and in the Southwest) surveyed from 1997 to 1999, with the risk for marijuana initiation beginning to accelerate around 11–12 years of age. Such high rates suggest that, on Indian reservations, marijuana use is normative behavior with few sanctions against use. In addition, greater availability is likely, as illicit pot farms, especially those run by gangs with ties to Mexico, have expanded very quickly on Indian reservations.27 Identification of the factors leading to these high rates of use at a relatively young age is needed.
Limitations
This study was subject to several limitations. Although this study used a large sample of AI students living on or near reservations, it did not reflect a random sample of all schools on or near reservations, nor did it reflect the AN population. As noted previously, schools from the Northeast, California, Oklahoma, and Alaska did not participate in the survey. Thus, use rates do not reflect these populations. In addition, a study using earlier data from this project found significantly higher use rates of marijuana and alcohol for Northern Plains and Upper Great Lakes young people and higher use rates of methamphetamine for Southwest young people.6 If regional differences among AI young people mirror those of the national population of young people, AI rates for at least these substances may be higher than MTF rates, in part because a larger proportion of reservation-based AI young people live in the Northern Plains and the Southwest compared with young people in general. Finally, it is important to note that our results may have underestimated the substance use rates for adolescents in age ranges of 10th and 12th graders due to the high AI dropout rate.
CONCLUSION
The results found in this study are not meant to stigmatize AI young people; rather, they are intended to call attention to the critical need for improved prevention and intervention efforts targeted to AI reservation-based young people. Although a number of factors have been found to relate to higher substance use rates among AIs, including lower income, educational attainment, and socioeconomic opportunity,28,29 a comprehensive understanding of the root causes of the myriad health, economic, and social disparities in this population has not yet been established. For example, although substance abuse has been linked to historical trauma in AI families, there is no clear model of causality. Without such an understanding, efforts to reduce substance use rates among reservation-based AI young people will be less effective. Given the high rates of substance use-related problems on reservations (e.g., academic failure, delinquency, violent criminal behavior, suicidality, and alcohol-related mortality), the costs to members of this population and to society will continue to be much too high.
Footnotes
All procedures for this study received approval from Colorado State University's Institutional Review Board. This research was supported by grant #R01DA03371 from the National Institute on Drug Abuse of the National Institutes of Health (NIH). The contents of this article are solely the responsibility of the authors and do not necessarily reflect the views of NIH.
REFERENCES
- 1.Substance Abuse and Mental Health Services Administration (US), Center for Behavioral Health Statistics and Quality. Rockville (MD): SAMHSA; 2011. [cited 2012 Aug 7]. The NSDUH report: substance use among American Indian or Alaska Native adolescents. Also available from: URL: http://store.samhsa.gov/product/Substance-Use-among-American-Indian-or-Alaska-Native-Adolescents/NSDUH11-1004-3. [Google Scholar]
- 2.Beauvais F. Trends in drug use among American Indian students and dropouts, 1975 to 1994. Am J Public Health. 1996;86:1594–8. doi: 10.2105/ajph.86.11.1594. [DOI] [PMC free article] [PubMed] [Google Scholar]
- 3.Beauvais F, Jumper-Thurman P, Burnside M. The changing patterns of drug use among American Indian students over the past 30 years. Am Indian Alsk Native Ment Health Res. 2008;15:15–24. doi: 10.5820/aian.1502.2008.15. [DOI] [PubMed] [Google Scholar]
- 4.Bachman JG, Wallace JM, Jr, O'Malley PM, Johnston LD, Kurth CL, Neighbors HW. Racial/ethnic differences in smoking, drinking, and illicit drug use among American high school seniors, 1976–89. Am J Public Health. 1991;8:372–7. doi: 10.2105/ajph.81.3.372. [DOI] [PMC free article] [PubMed] [Google Scholar]
- 5.Substance Abuse and Mental Health Services Administration (US) NSDUH Series H-27. Rockville (MD): SAMHSA, Office of Applied Studies; 2005. [cited 2012 Aug 7]. Results from the 2004 National Survey on Drug Use and Health: national findings and detailed tables. Also available from: URL: http://www.samhsa.gov/data/NSDUH.aspx. [Google Scholar]
- 6.Miller KA, Stanley LR, Beauvais F. Regional differences in drug use rates among American Indian youth. Drug Alcohol Depend. 2012;126:35–41. doi: 10.1016/j.drugalcdep.2012.04.010. [DOI] [PMC free article] [PubMed] [Google Scholar]
- 7.Beauvais F. Comparison of drug use rates for reservation Indian, non-reservation Indian and Anglo youth. Am Indian Alsk Native Ment Health Res. 1992;5:13–31. doi: 10.5820/aian.0501.1992.13. [DOI] [PubMed] [Google Scholar]
- 8.Freedenthal S, Stiffman AR. Suicidal behavior in urban American Indian adolescents: a comparison with reservation youth in a southwestern state. Suicide Life Threat Behav. 2004;34:160–71. doi: 10.1521/suli.34.2.160.32789. [DOI] [PubMed] [Google Scholar]
- 9.Hawkins EH, Cummins LH, Marlatt GA. Preventing substance abuse in American Indian and Alaska native youth: promising strategies for healthier communities. Psychol Bull. 2004;130:304–23. doi: 10.1037/0033-2909.130.2.304. [DOI] [PubMed] [Google Scholar]
- 10.Whitesell NR, Beals J, Mitchell CM, Novins DK, Spicer P, O'Connell J, et al. Marijuana initiation in 2 American Indian reservation communities: comparison with a national sample. Am J Public Health. 2007;97:1311–8. doi: 10.2105/AJPH.2005.071266. [DOI] [PMC free article] [PubMed] [Google Scholar]
- 11.Snipp CM. American Indian and Alaska Native children: results from the 2000 Census. Washington: Population Reference Bureau; 2005. [cited 2012 Jun 13]. Also available from: URL: http://www.prb.org/pdf05/americanindianalaskachildren.pdf.
- 12.Oetting ER, Beauvais F. Adolescent drug use: findings of national and local surveys. J Consult Clin Psych. 1990;58:385–94. doi: 10.1037//0022-006x.58.4.385. [DOI] [PubMed] [Google Scholar]
- 13.Substance Abuse and Mental Health Services Administration (US) SAMHSA's measures and instruments resource guide. Rockville (MD): SAMHSA; 2007. [cited 2007 Feb 13]. Also available from: URL: http://preventionplatform.samhsa.gov/macro/csap/mir_search_create/redesign/search_results.cfm?Category=&Row=&CategoryID=&CFID=655964&CFTOKEN=44451760&searchmode=allinstruments. [Google Scholar]
- 14.StataCorp. College Station (TX): StataCorp LP; 2007. Stata®: Release 10. [Google Scholar]
- 15.Johnston LD, O'Malley PM, Bachman JG, Schulenberg JE. Ann Arbor (MI): Institute for Social Research, University of Michigan; 2012. [cited 2012 Jul 29]. Monitoring the Future: national results on adolescent drug use: overview of key findings, 2011. Also available from: URL: http://www.slstoday.org/images/mtf-overview2011.pdf. [Google Scholar]
- 16.Johnston LD, O'Malley PM, Bachman JG, Schulenberg JE. Bethesda (MD): National Institutes of Health (US), National Institute on Drug Abuse; 2010. [cited 2012 Jul 29]. Monitoring the Future: national results on adolescent drug use: overview of key findings, 2009. Also available from: URL: http://www.monitoringthefuture.org/pubs/monographs/overview2009.pdf. [Google Scholar]
- 17.Johnston LD, O'Malley PM, Bachman JG, Schulenberg JE. Ann Arbor (MI): Institute for Social Research, University of Michigan; 2011. [cited 2012 Jul 29]. Monitoring the Future: national results on adolescent drug use: overview of key findings, 2010. Also available from: URL: http://www.monitoringthefuture.org/pubs/monographs/mtf-overview2010.pdf. [Google Scholar]
- 18.Johnston LD, O'Malley PM, Bachman JG, Schulenberg JE. Ann Arbor (MI): Institute for Social Research, University of Michigan; 2011. [cited 2012 Jul 29]. Monitoring the Future national survey results on drug use, 1975–2011, volume I, secondary school students. Also available from: URL: http://www.monitoringthefuture.org/pubs/monographs/mtf-vol1_2011.pdf. [Google Scholar]
- 19.Friese B, Grube JW, Seninger S, Paschall MJ, Moore RS. Drinking behavior and sources of alcohol: differences between Native American and white youths. J Stud Alcohol Drugs. 2011;72:53–60. doi: 10.15288/jsad.2011.72.53. [DOI] [PMC free article] [PubMed] [Google Scholar]
- 20.Henry KL, McDonald JN, Oetting ER, Walker PS, Walker RD, Beauvais F. Age of onset of first alcohol intoxication and subsequent alcohol use among urban American Indian adolescents. Psychol Addict Behav. 2011;25:48–56. doi: 10.1037/a0021710. [DOI] [PMC free article] [PubMed] [Google Scholar]
- 21.Swaim RC, Beauvais F, Chavez EL, Oetting ER. The effect of school dropout rates on estimates of adolescent substance use among three racial/ethnic groups. Am J Public Health. 1997;87:51–5. doi: 10.2105/ajph.87.1.51. [DOI] [PMC free article] [PubMed] [Google Scholar]
- 22.Faircloth SC, Tippeconnic JW., III . Los Angeles: The Civil Rights Project/Proyecto Derechos Civiles at UCLA; 2010. [cited 2012 Jul 31]. The dropout/graduation rate crisis among American Indian and Alaska Native students: failure to respond places the future of native peoples at risk. Also available from: URL: http://civilrightsproject.ucla.edu/research/k-12-education/school-dropouts/the-dropout-graduation-crisis-among-american-indian-and-alaska-native-students-failure-to-respond-places-the-future-of-native-peoples-at-risk. [Google Scholar]
- 23.Momper SL, Delva J, Reed BG. OxyContin misuse on a reservation: qualitative reports by American Indians in talking circles. Subst Use Misuse. 2011;46:1372–9. doi: 10.3109/10826084.2011.592430. [DOI] [PubMed] [Google Scholar]
- 24.General Accounting Office (US) Washington: GAO; 2003. [cited 2012 Aug 7]. Report to Congressional requesters. Prescription drugs: OxyContin abuse and diversion and efforts to address the problem (GAO-04-110) Also available from: URL: http://www.gao.gov/new.items/d04110.pdf. [Google Scholar]
- 25.Hays LR. A profile of OxyContin addiction. J Addict Dis. 2004;23:1–9. doi: 10.1300/J069v23n04_01. [DOI] [PubMed] [Google Scholar]
- 26.Beauvais F, Jumper-Thurman P, Helm H, Plested B, Burnside M. Surveillance of drug use among American Indian adolescents: patterns over 25 years. J Adolesc Health. 2004;34:493–500. doi: 10.1016/j.jadohealth.2003.07.019. [DOI] [PubMed] [Google Scholar]
- 27.Millman J. Mexican pot gangs infiltrate Indian reservations in U.S. Wall Street Journal 2009 Nov 5. [cited 2012 Aug 6]. Also available from: URL: http://online.wsj.com/article/SB125736987377028727.html.
- 28.Herman-Stahl M, Chong J. Substance abuse prevalence and treatment utilization among American Indians residing on-reservation. Am Indian Alsk Native Ment Health Res. 10:1–23. doi: 10.5820/aian.1003.2002.1. 202. [DOI] [PubMed] [Google Scholar]
- 29.Myhra LL. “It runs in the family”: intergenerational transmission of historical trauma among urban American Indians and Alaska Natives in culturally specific sobriety maintenance programs. Am Indian Alsk Native Ment Health Res. 2010;10:1–23. doi: 10.5820/aian.1802.2011.17. [DOI] [PubMed] [Google Scholar]