Abstract
Distinguishing individual Russula species has been difficult due to extensive phenotypic plasticity and obscure morphological and anatomical discontinuities. Due to highly similar macroscopic features, such as the presence of a red-cap, species identification within the Russula subgenus Amoenula is particularly difficult. Three species of the subgenus Amoneula have been reported in Korea. We used a combination of morphology and three molecular markers, the internal transcribed spacer (ITS), 28S nuclear ribosomal large subunit (LSU), and RNA polymerase II gene (RPB2), for identification and study of the genetic diversity of Russula subgenus Amoenula in Korea. We identified only two species in Korea (R. mariae and R. violeipes); these two species were indistinguishable according to morphology and LSU, but were found to be reciprocally monophyletic species using ITS and RPB2. The markers, ITS, LSU, and RPB2, have been tested in the past for use as DNA barcoding markers, and findings of our study suggest that ITS and RPB2 had the best performance for the Russula subgenus Amoneula.
Keywords: DNA barcoding, Internal transcribed spacer, RNA polymerase II gene, Russula mariae, Russula violeipes, 28S nuclear ribosomal large subunit
The genus Russula makes a significant contribution to plant host taxa as an ectomycorrhizal symbiont, and is found across a wide range of habitats from tropical to arctic ecosystems [1, 2]. In addition to their ecological roles, many Russula species are important food sources for insects [3] and humans [4].
The genus Russula is a highly diverse group in the fungal division Basidiomycota. To date, approximately 750 Russula species have been reported worldwide [5]. The Russula subgenus Amoenula Sarnari [6], includes four species (R. amoena Quélet [type], R. amoenicolor Romagnesi, R. mariae Peck, and R. violeipes Quélet), and was later amended to include a fifth species (R. mukteshwarica [7]). Amoenula is characterized by long hyphal ends, absence of dermatocystidia of pileipellis, and bayonet-like hairs in the epicuticular [6]. A phylogenetic analysis based on the internal transcribed spacer (ITS) recovered a well-supported grouping of the two Amoenula representatives (R. amoenicolor, R. violeipes) [8]. Another study based on the 28S nuclear ribosomal large subunit (LSU) showed that R. amoena, R. violeipes, and R. bella Hongo (synonym R. mariae) of the subgenus Amoenula formed a monophyletic group that included R. mairei from the subgenus Russula [9].
The individual species within the subgenus Amoenula differ in their spore print coloration and the presence and shape of specialized cells in the pileipellis [6]. Despite these distinguishing morphological characteristics, species identification is difficult, as spore prints require fresh specimens and their color is dependent on spore density, while observation of differences in micro-morphological features can be difficult.
ITS, LSU, and RNA polymerase II (RPB2) are three commonly used molecular markers for fungal phylogenetics. The ITS region has the most clearly defined barcode gap between inter- and intraspecific variation across a broad range of fungi; therefore, its adoption as the fungal barcode marker to the Consortium for the Barcode of Life has been formally suggested [10]. The LSU marker is normally more conserved and easier to align than ITS, while RPB2 is also highly conserved among eukaryotes and has proven to be useful for systematics and identification of fungal species [11].
Three species of the Russula subgenus Amoenula, R. amoena, R. mariae, and R. violeipes, have been reported from Korea [12]. Each of these has a red-cap and overlapping measurements of basidiospore and basidia size, making morphological identification difficult. Through the Russula barcode project, a study initiated by the National Institute of Biological Resources (NIBR) of Korea in an effort to understand the diversity of Russula in Korea [13] based on ITS, we found that there were many misidentifications in Russula, particularly in the subgenus Amoenula. In our study, we clarify the status of Russula species of the subgenus Amoenula in Korea by analysis of microscopic features and DNA sequences of specimens collected across South Korea. In addition, we evaluate the utility of the three commonly used molecular markers for fungi (ITS, LSU, and RPB2) for species identification in this group.
MATERIALS AND METHODS
Materials studied
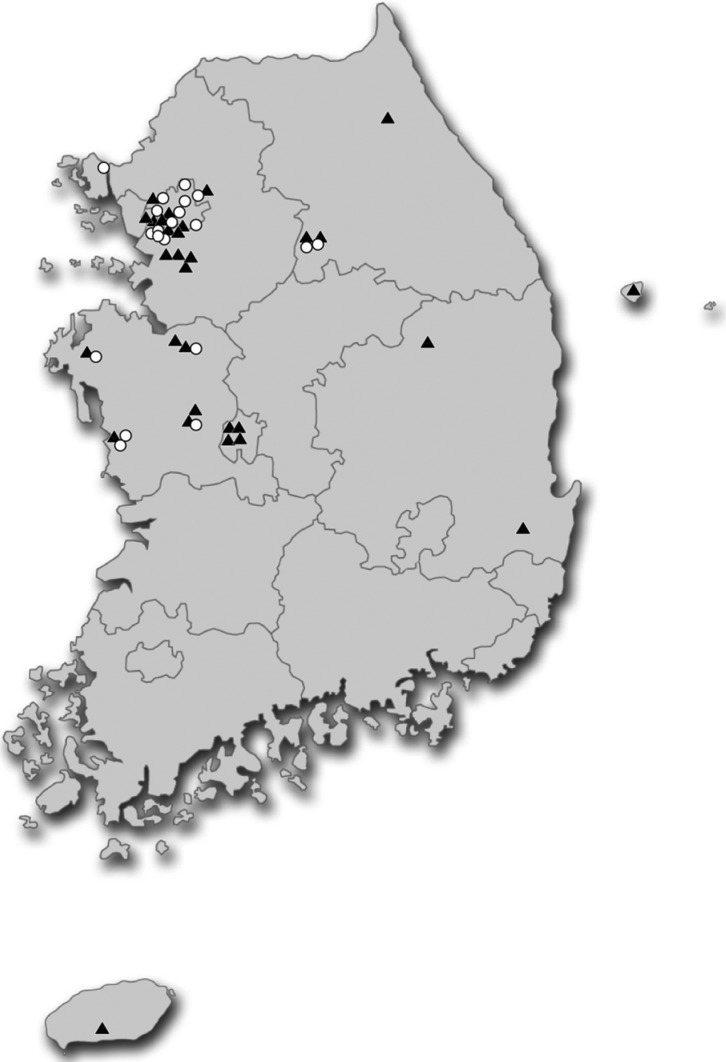
Fruiting body samples of Russula were collected from locations throughout South Korea between 1985~2012 (Table 1, Figs. 1 and 2); dried specimens were deposited in the Herbarium Conservation Center of the National Academy of Agricultural Sciences (HCCN) or Seoul National University Fungus Collection (SFC). These specimens were identified using field guides [14], a photographic illustration website (http://www.mtsn.tn.it/russulales-news/), and a light microscope (Nikon 80i; Nikon, Tokyo, Japan).
Table 1.
Specimens used in this study
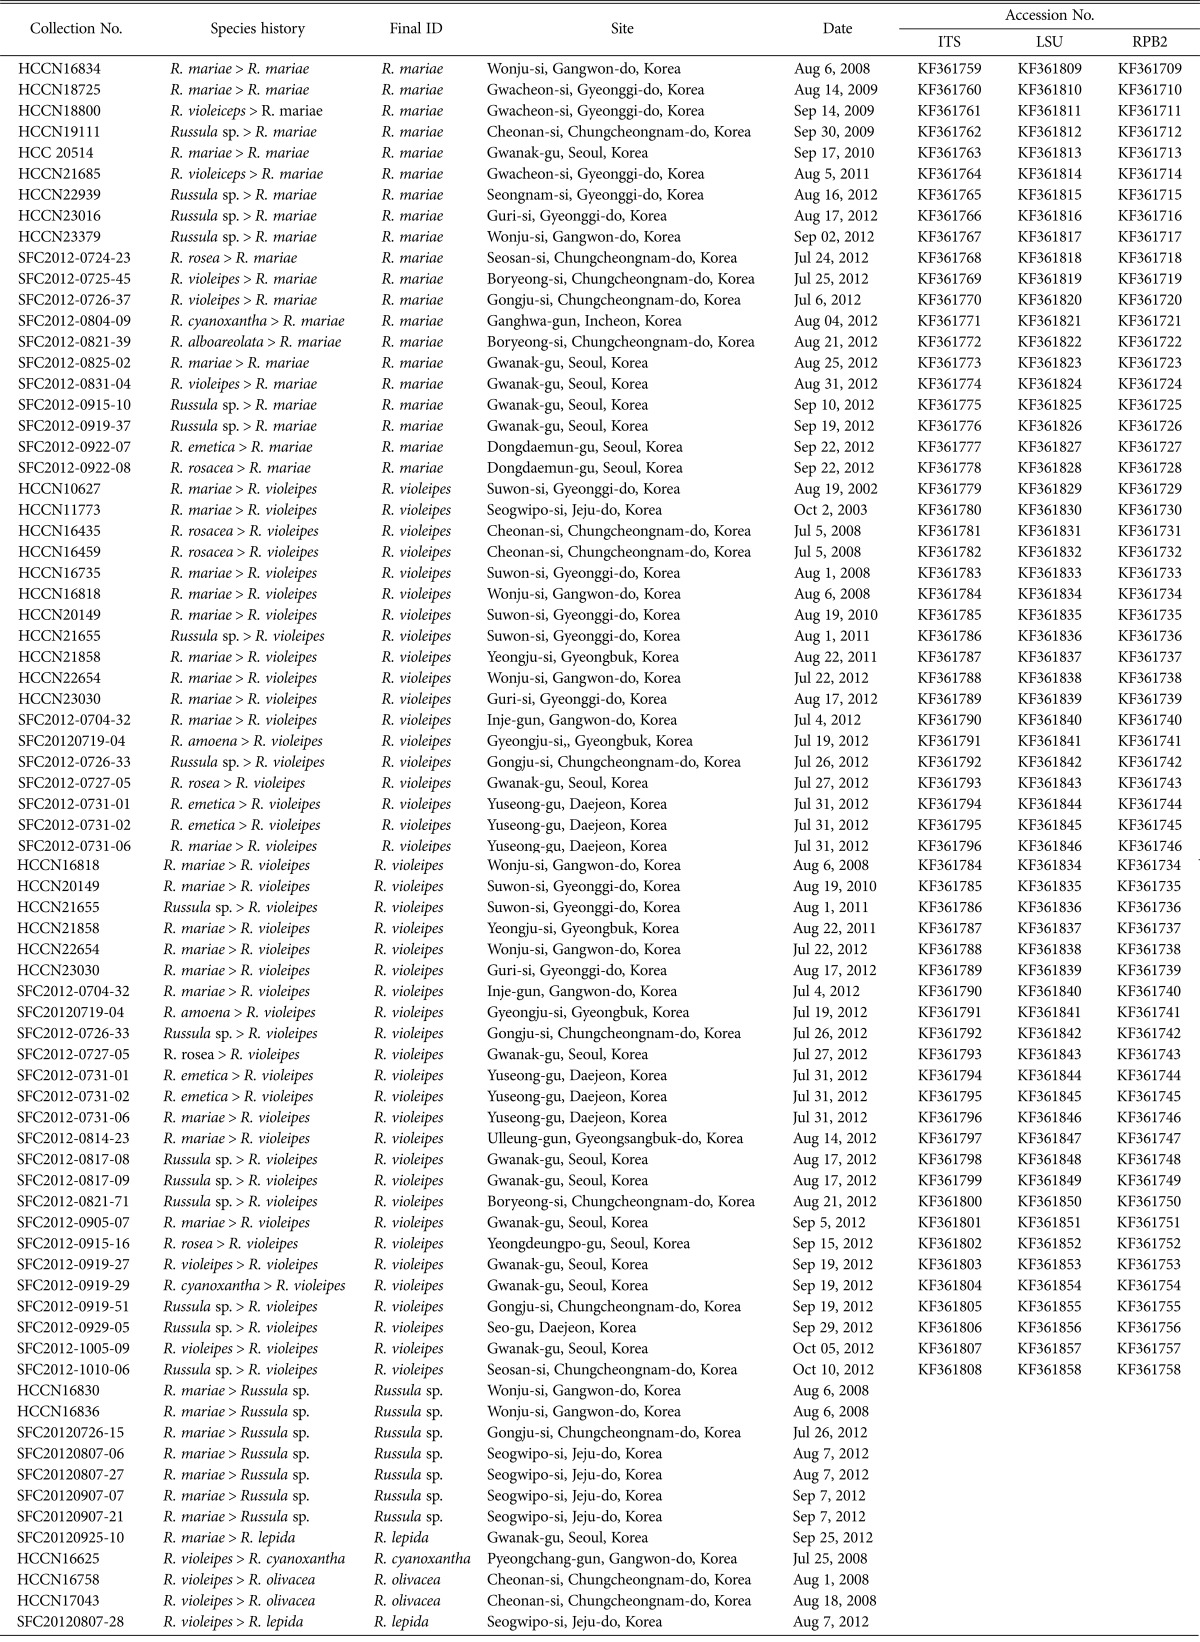
HCCN, Herbarium Conservation Center of the National Academy of Agricultural Sciences; SFC, Seoul National University Fungus Collection.
Fig. 1.
Geographic distribution of Russula specimens used in this study. Black triangles represent sampling sites for R. violeipes, and white circles represent sampling sites for R. mariae.
Fig. 2.
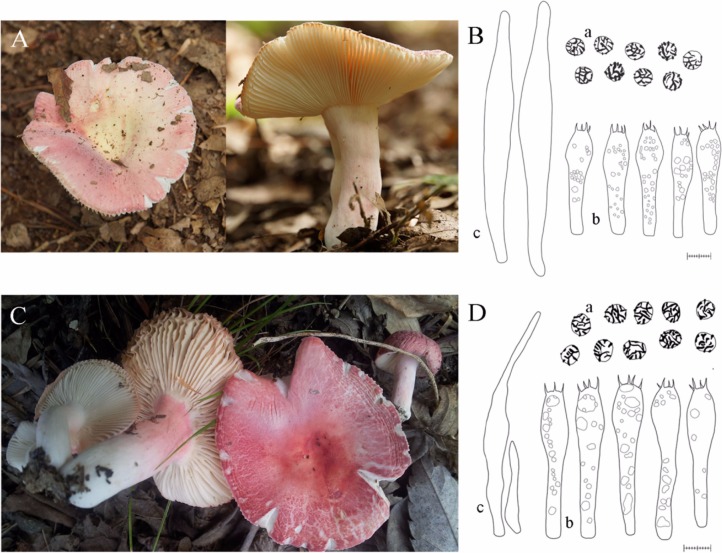
Morphological features of Russula mariae (A, B) and R. violeipes (C, D) from Korea. a, basidiospores; b, basidia; c, pleurocystidia (scale bars: B, D = 10 µm).
A total of 62 specimens initially identified as R. mariae (24 specimens), R. violeipes (11 specimens), R. amoena (1 specimen), and other morphologically similar Russula species (26 specimens) were examined in this study (Table 1). Each specimen was re-examined for verification of species identity following three steps: i) grouping based on size of basidia and basidiospore, ii) performance of sequence analysis, and iii) comparison of morphological details to published data.
DNA extraction, PCR amplification and sequencing
Genomic DNA from fresh or dried tissues was extracted using the modified CTAB extraction protocol of Rogers and Bendich [15]. The ITS region was amplified using primers ITS1F or ITS5 and ITS4 [16], the LSU region was amplified using primers ITS3 and LR5 [17], with a newly designed primer-Russ3R (CCATTAYGCCARCATCCTAAGCA), and RPB2 was amplified using primers fRPB2-5F or bRPB2-6F and bRPB2-7R or bRPB2-7.1R [11]. PCR reactions were performed on a C1000 thermal cycler (Bio-Rad, Hercules, CA, USA) using the Maxime PCR PreMix-StarTaq (Intron Biotechnology Inc., Seoul, Korea) in a final volume of 20 µL containing 10 pmol of each primer and 1 µL of DNA. The PCR conditions used were 95℃ for 5 min, followed by 35 cycles of 95℃ for 40 sec, 55℃ for 40 sec, and 72℃ for 1 min, and a final extension step at 72℃ for 10 min. The PCR products were electrophoresed through a 1% agarose gel stained with loading STAR (Dyne Bio, Seoul, Korea) and purified using the Expin PCR Purification Kit (GeneAll Biotechnology, Seoul, Korea) according to the manufacturer's instructions. Sequencing was performed in both forward and reverse directions for each sample using the PCR primers. DNA sequencing was performed at the DNA synthesis and Sequencing Facility, Macrogen (Seoul, Korea), using an ABI3700 automated DNA sequencer (PE Applied Biosystems, Foster City, CA, USA).
Sequence analysis
Sequences were assembled, proofread, and edited using PHYDIT v3.1 [18]. The resulting consensus sequences were deposited in GenBank (accession numbers are shown in Table 1). Outgroups and publicly available sequences for R. mariae and R. violeipes were obtained from GenBank. Different outgroups were selected for each marker based on previous phylogenetic studies of the Russula genus [8, 9]. Multiple alignments were performed using the default settings of MAFFT v6.903b [19] and the L-INS-algorithm [19]. Ambiguously aligned positions were checked manually. We determined the most appropriate substitution model using the Bayesian information criterion in jModelTest 2.1.1 [20] for the three markers. The K80 + I, K80 + G, and K80 + G + I models were selected as the best-fit models for ITS, LSU, and RPB2, respectively. Bayesian inference phylogenetic analyses were performed for each dataset using a Metropolis-coupled Markov chain Monte Carlo algorithm implemented in MrBayes v3.2.1 [21] with four chains. Two independent searches with random starting trees were run for each dataset for 20 million generations, sampling every 100th generation. Tracer v1.5 [22] was used in determining whether runs reached convergence, and 25% of the data were removed as burnin. Final consensus trees were constructed using the 50% majority rule, with posterior probabilities for each node.
Genetic diversity measures
In order to assess the variation of base substitution among sites, the number of steps per five successive bases was estimated for the most-parsimonious trees based on each of the three markers using MacClade 4.0 [23]. To determine whether ITS, LSU, and RPB2 are adequate barcoding markers for these species, maximum intraspecific sequence dissimilarity and intra- and interspecific distances were calculated for 1) each species and 2) Korean samples in each species. Maximum intraspecific sequence dissimilarities were calculated using PHYDIT v3.1 [18], while intra- and interspecific distances were calculated using the Kimura 2-parameter model [26] in MEGA5 [27].
RESULTS
Dataset preparation
initially identified as R. mariae (24 specimens), R. violeipes (11 specimens), R. amoena (1 specimen), and other morphologically similar Russula species (26 specimens) collected from different geographic locations in Korea were selected for this study (Fig. 1). We used a combination of microscopic features and ITS sequence analysis in order to determine which specimens had been misclassified. Of the 24 specimens initially identified as R. mariae, four were determined to be true R. mariae, 12 as R. violeipes, one as R. lepida, and seven unknown. Of the 11 specimens initially identified as R. violeipes, two were determined to be true R. violeipes, five as R. mariae, two as R. olivacea, and one each of R. cyanoxantha and R. lepida. Based on morphological and sequence analysis, the single R. amoena included in this study was shown to be a misidentified R. violeipes. Of the 26 individuals previously identified as other Russula species based on macro-morphological characteristics, 11 were re-identified as R. mariae and 15 as R. violeipes. The final dataset for this study included 20 R. mariae and 30 R. violeipes from Korea, and zero R. amoena (Table 1).
Morphological data
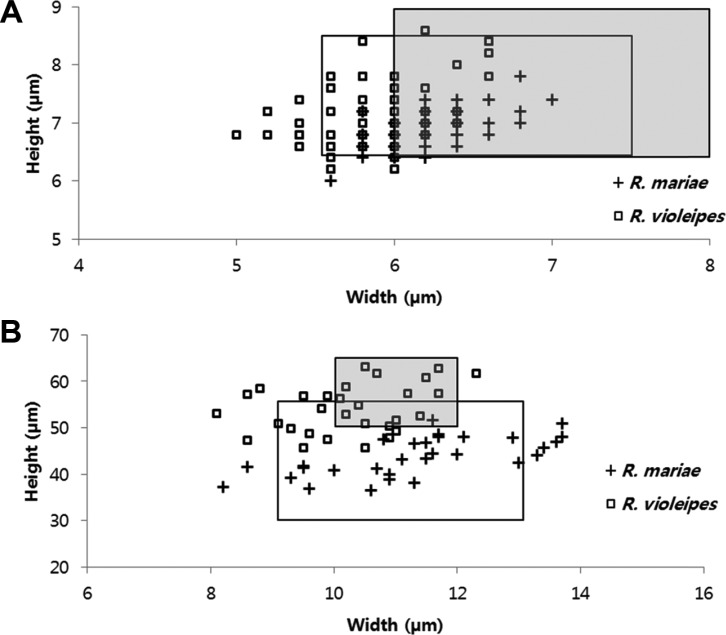
In order to explore morphological characteristics of R. mariae and R. violeipes, we compared sizes of basidiospore and basidia (Figs. 2 and 3). Basidiospores and basidia of Korean R. mariae (RM group) measured 6.0~7.8 × 5.6~7.0 µm and 36.5~51.7 × 8.2~13.7 µm, respectively. These measurements were similar to those reported in previously published results for R. mariae [24], however, Korean samples have a wider range in basidia width (Fig. 3A and 3B). Basidiospores and baisidia of Korean R. violeipes (RV group) measured 6.2~8.6 × 5.0~6.6 µm and 45.6~63.2 × 8.1~12.3 µm, respectively. Measurements of Korean R. violeipes samples were similar to those reported in published records [25], however, basidospores and basidia were generally more narrow (Fig. 3A and 3B). In comparison of the measurements of Korean R. violeipes and Korean R. mariae, the major difference is that the basidia of Korean R. violeipes are slightly longer than those of Korean R. mariae (Fig. 3B).
Fig. 3.
Size variation of basidiospore (A) and basidia (B) of Russula mariae (RM) and R. violeipes (RV) from Korea. Plus (+) marks represent R. mariae from Korea and square (-) marks represent R. violeipes from Korea. White boxes represent previously published data on R. mariae from Bill and Miller [24] and grey boxes represent previously published data on R. violeipes from Romagnesi [25].
Sequence analyses of ITS, LSU, and RPB2
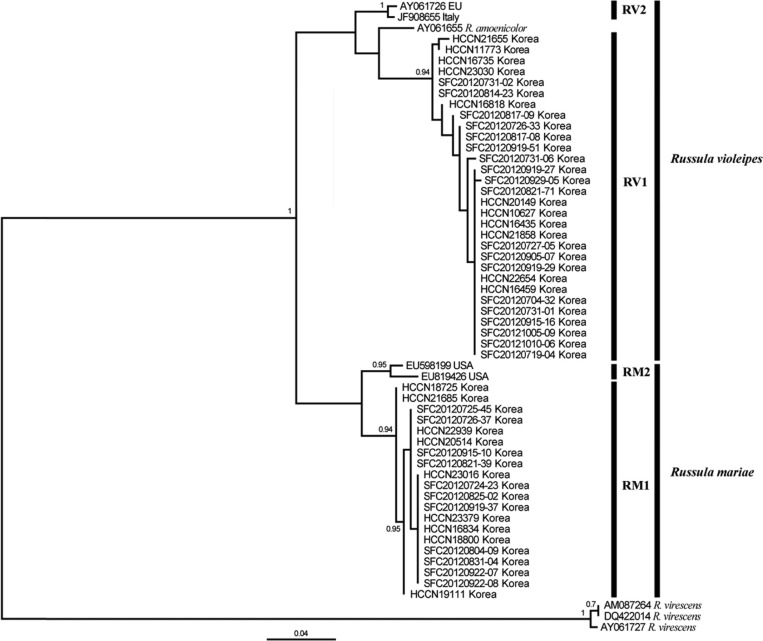
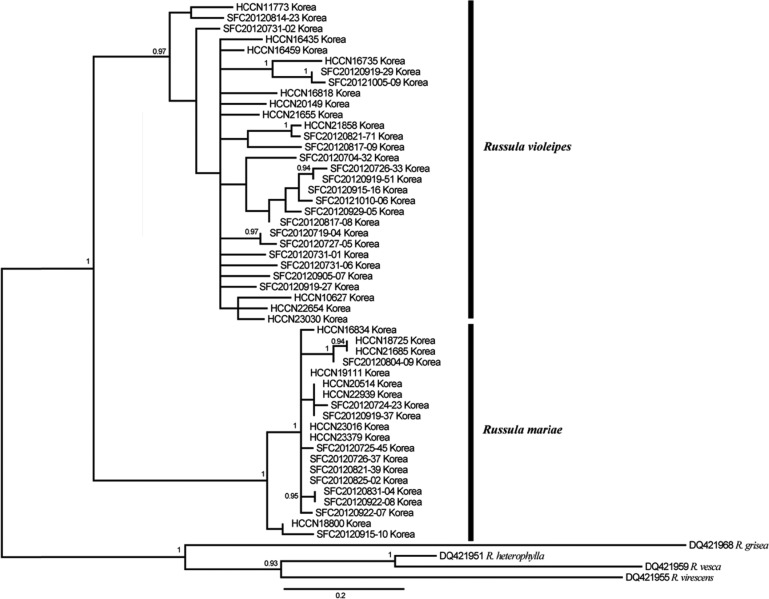
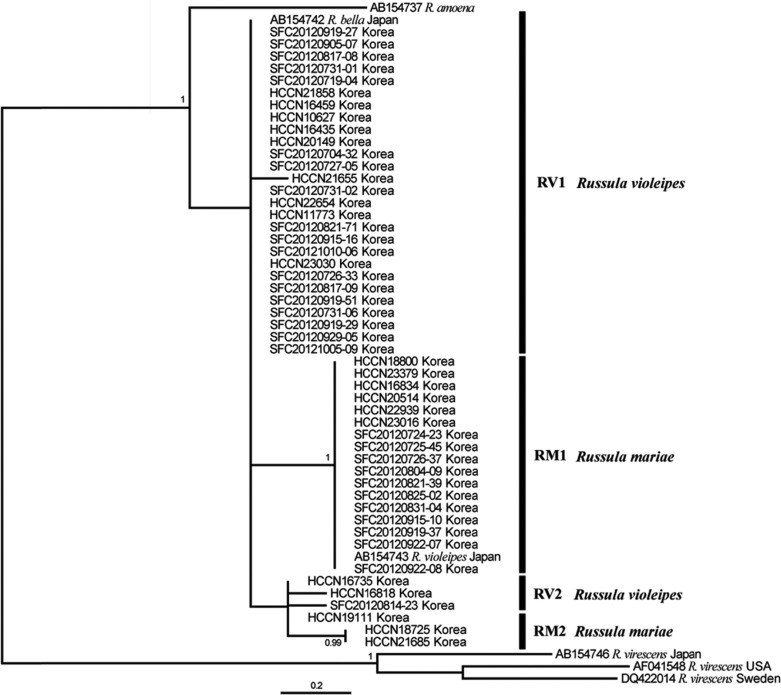
In order to infer the phylogenetic position of R. mariae and R. violeipes, the ITS (630~650 bp), LSU (570 bp), and RPB2 (600 bp) regions were amplified and sequenced for all specimens. In general, the ITS and RPB2 phylogenies were similar and resolved the relationship between R. mariae and R. violeipes (Figs. 4 and 5). In contrast, the LSU phylogeny was not well resolved, with no separation between the two species (Fig. 6). For RPB2, R. violeipes and R. mariae were found to be reciprocally monophyletic (Fig. 5). The relationship between Korean samples and their conspecifics in other countries cannot be evaluated because no sequences were available in Genbank. For ITS, all Korean samples were divided into two monophyletic groups. One of these groups clustered with known sequences of R. mariae from North America, while the other group clustered with known sequences of R. violeipes and R. amoenicolor (Fig. 4). The monophyletic R. mariae group showed geographic variation, with one subgroup (RM1) containing specimens exclusively from Korea and the second subgroup (RM2) including representatives from North America (Fig. 4). The second group contained Korean R. violeipes (RV1) and European R. violeipes (RV2), and was rendered paraphyletic by a single R. amoenicolor from Europe, but with low support (posterior probability = 0.59) (Fig. 4).
Fig. 4.
Bayesian consensus tree (50% majority rule) inferred from sequences of rDNA internal transcribed spacer region for 50 Korean Russula specimens in the subgenus Amoenula. Bayesian posterior probabilities are only shown for nodes with support > 0.9. The scale bar indicates the number of nucleotide substitutions per site. RV, R. violeipes; RM, R. mariae.
Fig. 5.
Bayesian consensus tree (50% majority rule) inferred from sequences of the RNA polymerase II gene (RPB2) for 50 Korean Russula specimens in the subgenus Amoenula. Bayesian posterior probabilities are only shown for nodes with support > 0.9. The scale bar indicates the number of nucleotide substitutions per site.
Fig. 6.
Bayesian consensus tree (50% majority rule) inferred from sequences of the 28S nuclear ribosomal large subunit rRNA gene for 50 Korean Russula specimens in the subgenus Amoenula. Bayesian posterior probabilities are only shown for nodes with support > 0.9. The scale bar indicates the number of nucleotide substitutions per site. RV, R. violeipes; RM, R. mariae.
Intra- and interspecific variation of ITS, LSU, and RPB2
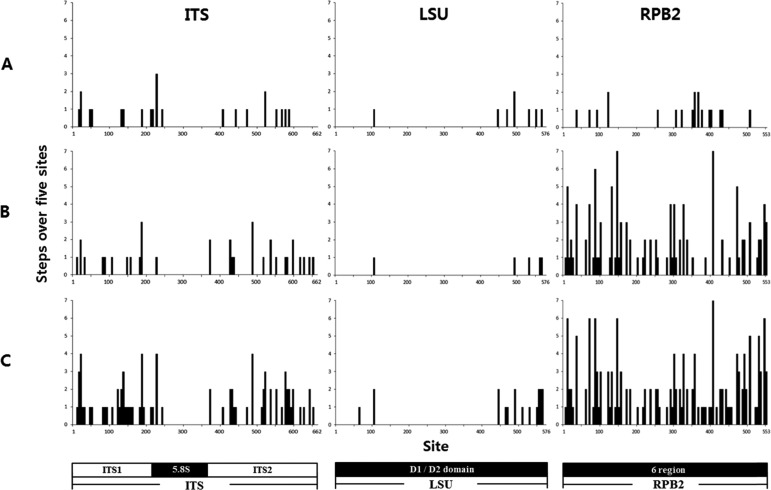
In examination of the distribution of variable sites of each gene, the number of parsimony steps over five base windows is shown in Fig. 7. From the diagram, we can see that sequence variation was highest in RPB2, followed by ITS, then LSU. RPB2 showed a relatively even distribution of variation across the gene, and the high rate of change was driven primarily by high variation in the R. violeipes group (RV group). ITS showed moderate variation across the marker, except in the intervening region of ITS consisting of the conserved 5.8S rRNA gene. LSU exhibited the lowest variation of the three markers; sequence variation for the D2 region was slightly greater than that of the D1 region (Fig. 7).
Fig. 7.
Site variation of the internal transcribed spacer (ITS), 28S nuclear ribosomal large subunit rRNA gene (LSU), and RNA polymerase II gene (RPB2) sequence of R. mariae and R. violeipes. Variation in base substitution numbers among sites across the length of the genes was assessed using a window size of five consecutive bases from R. mariae (A), R. violeipes (B), and all Korean specimens of R. mariae and R. violeipes (C).
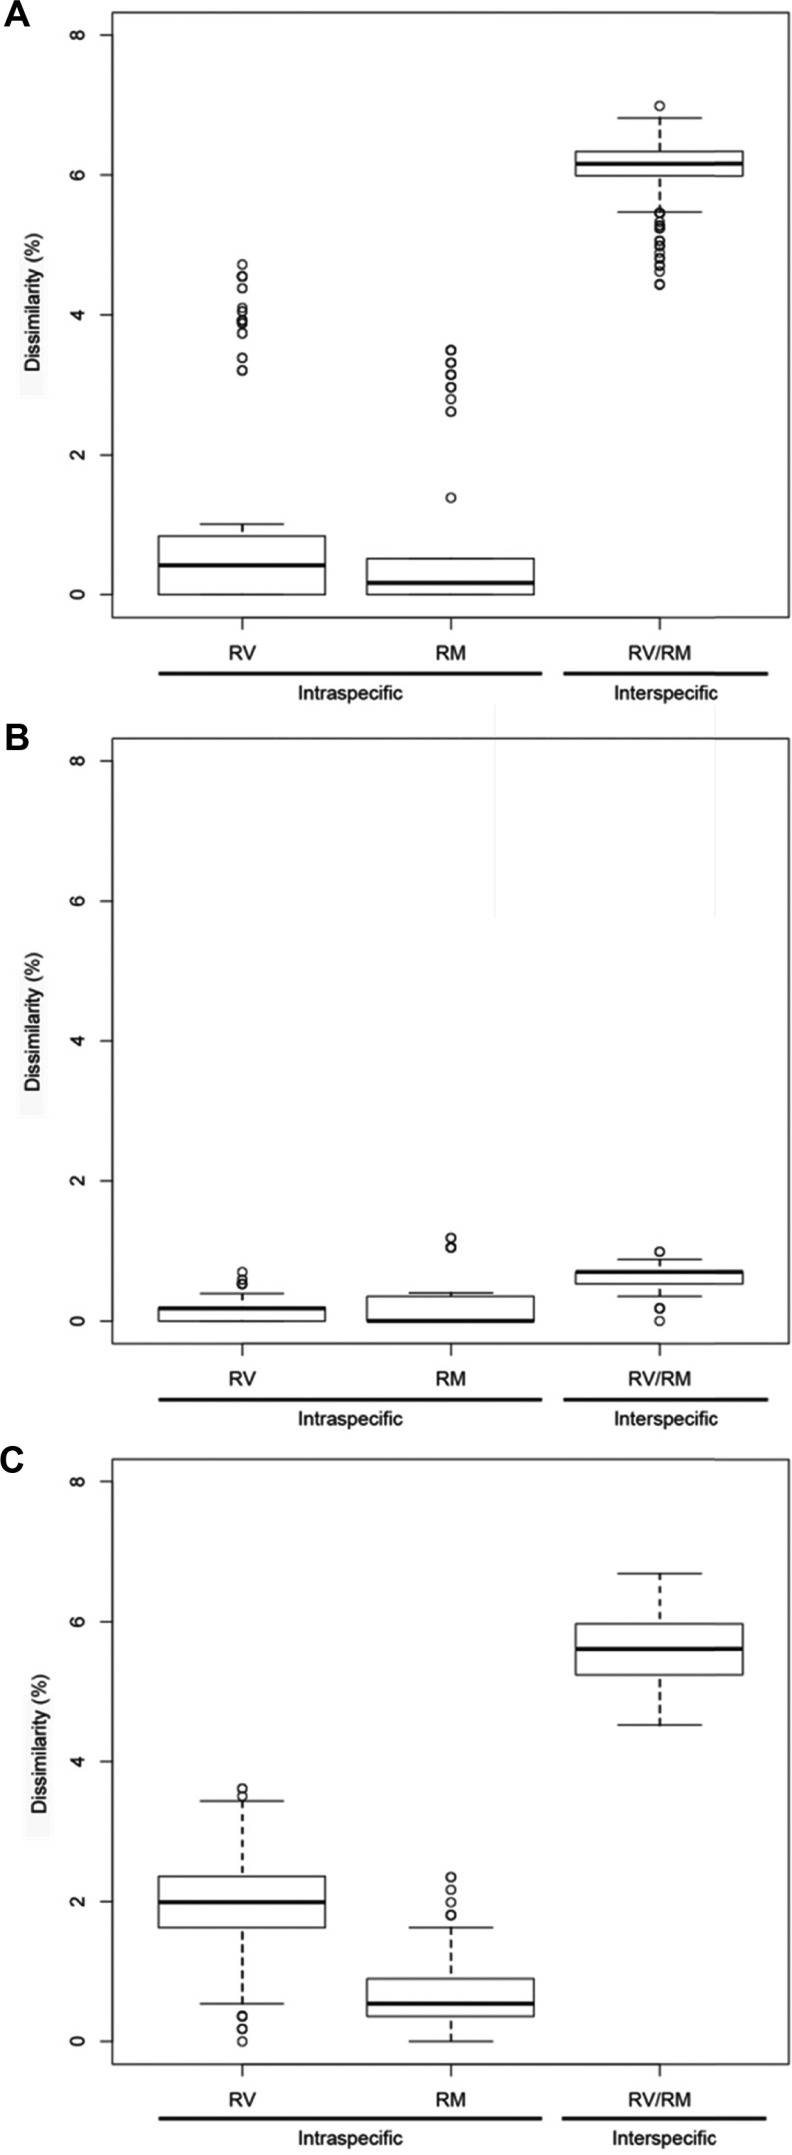
In addition, boxplots were made for comparison of intra- and interspecific dissimilarity and to understand the resolutional power of ITS, LSU, and RPB2 (Fig. 8). Intra- and interspecific variation for both ITS and RPB2 showed a clear pattern of non-overlap, whereas LSU showed a pattern of overlapping of intra- and interspecific variation.
Fig. 8.
Boxplots of intra- and interspecific variation of Russula mariae (RM) and R. violeipes (RV). Pair-wise comparisons are made of % dissimilarity of the barcoding markers (A) internal transcribed spacer, (B) 28S nuclear ribosomal large subunit rRNA gene, and (C) RNA polymerase II gene.
DISCUSSION
In this study, we re-evaluate the status of Russula species of the subgenus Amoenula in Korea using microscopic features and DNA sequence analyses. Russula amoena, R. mariae, and R. violeipes of the subgenus Amoenula have been previously reported from Korea [12]. Due to similar macroscopic characteristics, such as red/pink cap coloration, differentiation of Russula species is difficult without the aid of microscopic or DNA data. Russula mariae and R. violeipes are particularly prone to misidentification because in addition to similar morphology and coloration, micro-morphological features overlap. This strong potential for misidentification should be considered carefully when evaluating previous research on fungal diversity that relies on macro-morphological characteristics for identification [28]. In our careful evaluation of the species identification of several Russula species using microscopic characteristics and DNA data, we found that misidentification was common. Of the specimens used in this study, it was found that 56 specimens out of 62 (90%) were incorrectly identified. Focusing on the subgenus Amoenula, our final dataset was comprised of 20 R. mariae, 30 R. violeipes, and zero R. amoena. Our study raises the possibility that R. amoena is not distributed in Korea. Additional sampling across the Korean peninsula and comparison with R. amoena from Europe using morphological and sequence analyses will be necessary in order to evaluate the status of R. amoena in Korea.
The phylogenetic results of the three molecular markers (RPB2, ITS, and LSU) varied, with RPB2 and ITS recovering two species groups corresponding to R. violeipes and R. mariae, while LSU provided no resolution between the two species. The ITS dataset included samples from outside of Korea and showed that there is phylogeographic structure in both R. mariae and R. violeipes. Russula mariae has distinct groups from Korea (RM1) and North America (RM2) (Fig. 4), while R. violeipes has distinct groups from Korea (RV1) and Europe (RV2). This genetic structure might be related to regional differences as a result of allopatry. Previous studies have shown that geographic separation can result in genetic divergence of mushroom populations [29]. This may also explain the reasons behind genetic differences between these two species in Korea and their conspecifics in Europe and North America.
Russula violeipes, in the ITS phylogeny, is paraphyletic due to a single R. amoenicolor specimen from Europe, but with low support (posterior probability = 0.59). It should be noted that the microscopic measurements of RV1 closely resembled those of previously reported data from Europe (Fig. 3) and presence of globose basal cells in the pileipellis of R. violeipes has been shown to differentiate it from R. amoenicolor, which does not have this trait [24]. We believe that the paraphyly of R. violeipes and R. amoenicolor is erroneous due to the low posterior probability support and distinguishing morphological characteristics, however additional sampling will be necessary in order to clarify this relationship.
The amount and spatial position of variation in the three markers (ITS, LSU, and RPB2) differ between markers and between groups (Fig. 6). For ITS, the ITS1 and ITS2 regions show similar levels of variation in both R. mariae and R. violeipes. LSU shows overall low levels of sequence variation across the marker and across two species, but with more changes in the D2 region. Among the three markers, RPB2 shows the highest level of variation, and this variation is evenly spread across the marker. Of particular interest, the high level of DNA variation is driven by differences in R. violeipes. However, in order to fully understand the driving force behind this sequence variation, conduct of additional studies of R. violeipes and R. mariae at the genomic level will be necessary.
Intra- and interspecific pairwise sequence comparisons among all samples used in this study were performed for each of the three datasets. The magnitude of sequence dissimilarities varied according to locus. In comparison of the sequence variation of the two Russula species, we observed clear sequence dissimilarity between intra- and interspecific variation for both ITS and RPB2, whereas LSU showed overlapping inter and intra specific variation (Fig. 8). ITS and RPB2 of these Russula species conform to the requirements as optimal barcoding markers, being easily amplifiable using a single set of primers, and should provide sufficient resolution for identification of species [30]. ITS and RPB2 exhibited low intraspecific variation and high interspecific variation in our dataset and specimens collected in Korea could be distinguished.
In conclusion, we used microscopic characteristics and DNA sequences in order to find misidentified Russula specimens in herbarium collections. In particular, R. mariae and R. violeipes were previously misidentified as five different species (Table 1) when classification was based solely on macroscopic characteristics. In addition, our study raises the possibility that R. amoena does not exist in Korea, although additional work will be necessary in order to verify this. Identification in the field is normally based on macroscopic traits such as shape and color, however, we show that such characteristics are inadequate for classification and often lead to incorrect identification. LSU proved to be ineffective for use of DNA markers in closely related Russula phylogenetics and barcoding, while both ITS and RPB2 markers allowed for clear discrimination of R. mariae and R. violeipes, as well as distinguishing broad geographic patterns (i.e., Korea vs. Europe/North America) within them. Russula species have important roles in the environment in mutualistic relationships with plants and ITS and RPB2 markers will be powerful tools in elucidating the ecology and evolution of Russula in Korea and worldwide.
ACKNOWLEDGEMENTS
This work was supported by the National Institute of Biological Resources (NIBR No. 2012-02-042).
References
- 1.Buyck B, Thoen D, Watling R. Ectomycorrhizal fungi of the Guinea-Congo region. Proc R Soc Edinb B Biol Sci. 1996;104:313–333. [Google Scholar]
- 2.Gardes M, Dahlberg A. Mycorrhizal diversity in arctic and alpine tundra: an open question. New Phytol. 1996;133:147–157. [Google Scholar]
- 3.Yamashita S, Hijiii N. The role of fungal taxa and developmental stage of mushrooms in determining the composition of the mycophagous insect community in a Japanese forest. Eur J Entomol. 2007;104:225–233. [Google Scholar]
- 4.Hu L, Zeng L. Investigation on wild edible mushroom resources in Wanxian Country, Sichuan Province. Zhongguo Shiyongjun. 1992;11:35–37. [Google Scholar]
- 5.Kirk PM, Cannon PF, Minter DW, Stalpers JA. Dictionary of the fungi. Wallingford: CAB International; 2008. [Google Scholar]
- 6.Sarnari M. Monografia illustrata del genere Russula in Europa. Trento: Associazione Micologica Bresadola; 1998. [Google Scholar]
- 7.Das K, Miller SL, Sharma JR, Sharma P, Bhatt RP. Russula in Himalaya 1: a new species of subgenus Amoenula. Mycotaxon. 2005;94:85–88. [Google Scholar]
- 8.Miller SL, Buyck B. Molecular phylogeny of the genus Russula in Europe with a comparison of modern infrageneric classifications. Mycol Res. 2002;106:259–276. [Google Scholar]
- 9.Shimono Y, Kato M, Takamatsu S. Molecular phylogeny of Russulaceae (Basidiomycetes; Russulales) inferred from the nucleotide sequences of nuclear large subunit rDNA. Mycoscience. 2004;45:303–316. [Google Scholar]
- 10.Schoch CL, Seifert KA, Huhndorf S, Robert V, Spouge JL, Levesque CA, Chen W Fungal Barcoding Consortium; Fungal Barcoding Consortium Author List. Nuclear ribosomal internal transcribed spacer (ITS) region as a universal DNA barcode marker for fungi. Proc Natl Acad Sci U S A. 2012;109:6241–6246. doi: 10.1073/pnas.1117018109. [DOI] [PMC free article] [PubMed] [Google Scholar]
- 11.Matheny PB. Improving phylogenetic inference of mushrooms with RPB1 and RPB2 nucleotide sequences (Inocybe; Agaricales) Mol Phylogenet Evol. 2005;35:1–20. doi: 10.1016/j.ympev.2004.11.014. [DOI] [PubMed] [Google Scholar]
- 12.Lee TS. The full list of recorded mushrooms in Korea. Korean J Mycol. 1990;18:233–259. [Google Scholar]
- 13.National Institue of Biological Resources. Molecular phylogeny of Korean major taxa (NIBR No. 11-1480592-000415-01) Incheon: NIBR; 2012. [Google Scholar]
- 14.Kränzlin F. Fungi of Switzerland. Vol. 6. Russulaceae: Lactarius, Russula. Lucerne: Verlag Mykologia; 2005. [Google Scholar]
- 15.Rogers SO, Bendich AJ. Extraction of total cellular DNA from plants, algae and fungi. In: Gelvin SB, Schilperoort RA, editors. Plant molecular biology manual D1. Dordrecht: Springer; 1994. pp. 1–8. [Google Scholar]
- 16.White TJ, Bruns T, Lee S, Taylor J. Amplification and direct sequencing of fungal ribosomal RNA genes for phylogenetics. In: Innis MA, Gelfand DH, Sninsky JJ, White TJ, editors. PCR protocols: a guide to methods and applications. New York: Academic Press, Inc; 1990. pp. 315–322. [Google Scholar]
- 17.Vilgalys R, Hester M. Rapid genetic identification and mapping of enzymatically amplified ribosomal DNA from several Cryptococcus species. J Bacteriol. 1990;172:4238–4246. doi: 10.1128/jb.172.8.4238-4246.1990. [DOI] [PMC free article] [PubMed] [Google Scholar]
- 18.Chun J. Computer assisted classification and identification of actinomycetes. Newcastle upon Tyne: University of Newcastle; 1995. [Google Scholar]
- 19.Katoh K, Kuma K, Toh H, Miyata T. MAFFT version 5: improvement in accuracy of multiple sequence alignment. Nucleic Acids Res. 2005;33:511–518. doi: 10.1093/nar/gki198. [DOI] [PMC free article] [PubMed] [Google Scholar]
- 20.Darriba D, Taboada GL, Doallo R, Posada D. jModelTest 2: more models, new heuristics and parallel computing. Nat Methods. 2012;9:772. doi: 10.1038/nmeth.2109. [DOI] [PMC free article] [PubMed] [Google Scholar]
- 21.Ronquist F, Teslenko M, van der Mark P, Ayres DL, Darling A, Höhna S, Larget B, Liu L, Suchard MA, Huelsenbeck JP. MrBayes 3.2: efficient Bayesian phylogenetic inference and model choice across a large model space. Syst Biol. 2012;61:539–542. doi: 10.1093/sysbio/sys029. [DOI] [PMC free article] [PubMed] [Google Scholar]
- 22.Rambaut A, Drummond A. Tracer v1.5 Andrew Rambaut. 2007. [cited 2013 Aug 8]. Available from: http://tree.bio.ed.ac.uk/software/tracer/.2009.
- 23.Maddison WP, Maddison DR. MacClade: analysis of phylogeny and character evolution. Sunderland: Sinauer Associates; 2000. [DOI] [PubMed] [Google Scholar]
- 24.Bills GF, Miller OK., Jr Southern Appalachian Russulas. I. Mycologia. 1984;76:975–1002. [Google Scholar]
- 25.Romagnesi H. Les russules d'Europe et d'Afrique du Nord. Paris: Bordas; 1985. [Google Scholar]
- 26.Kimura M. A simple method for estimating evolutionary rates of base substitutions through comparative studies of nucleotide sequences. J Mol Evol. 1980;16:111–120. doi: 10.1007/BF01731581. [DOI] [PubMed] [Google Scholar]
- 27.Tamura K, Peterson D, Peterson N, Stecher G, Nei M, Kumar S. MEGA5: molecular evolutionary genetics analysis using maximum likelihood, evolutionary distance, and maximum parsimony methods. Mol Biol Evol. 2011;28:2731–2739. doi: 10.1093/molbev/msr121. [DOI] [PMC free article] [PubMed] [Google Scholar]
- 28.Jung HS. Fungal flora of Ullung Island (IV): on some agaric fungi. Korean J Mycol. 1993;21:64–72. [Google Scholar]
- 29.Kleine CS, McClean T, Miller SL. Genetic divergence among disjunct populations of three Russula spp. from Africa and Madagascar. Mycologia. 2013;105:80–89. doi: 10.3852/11-067. [DOI] [PubMed] [Google Scholar]
- 30.Casiraghi M, Labra M, Ferri E, Galimberti A, De Mattia F. DNA barcoding: a six-question tour to improve users' awareness about the method. Brief Bioinform. 2010;11:440–453. doi: 10.1093/bib/bbq003. [DOI] [PubMed] [Google Scholar]


