

Abstract
Transplantation of Schwann cells (SCs) is a promising therapeutic strategy for spinal cord repair. SCs introduced into lesions support axon regeneration, but because these axons do not exit the transplant, additional approaches with SCs are needed. Here, we transplanted SCs genetically modified to secrete a bifunctional neurotrophin (D15A) and chondroitinase ABC (ChABC) into a subacute contusion injury in rats. We examined the effects of these modifications on graft volume, SC number, degradation of chondroitin sulfate proteoglycans (CSPGs), astrogliosis, SC myelination of axons, propriospinal and supraspinal axon numbers, locomotor outcome (BBB scoring, CatWalk gait analysis), and mechanical and thermal sensitivity on the hind paws. D15A secreted from transplanted SCs increased graft volume and SC number and myelinated axon number. SCs secreting ChABC significantly decreased CSPGs, led to some egress of SCs from the graft, and increased propriospinal and 5-HT-positive axons in the graft. SCs secreting both D15A and ChABC yielded the best responses: (1) the largest number of SC myelinated axons, (2) more propriospinal axons in the graft and host tissue around and caudal to it, (3) more corticospinal axons closer to the graft and around and caudal to it, (4) more brainstem neurons projecting caudal to the transplant, (5) increased 5-HT-positive axons in the graft and caudal to it, (6) significant improvement in aspects of locomotion, and (7) improvement in mechanical and thermal allodynia. This is the first evidence that the combination of SC transplants engineered to secrete neurotrophin and chondroitinase further improves axonal regeneration and locomotor and sensory function.
Keywords: cell transplantation, chondroitinase, glial scar, Schwann cell, spinal cord injury
Introduction
Repair of spinal cord injury (SCI) in adult mammals is challenging due to multiple factors, including extensive cell loss, axonal disruption, growth inhibitory molecules in the scar, and lack of growth-promoting molecules (Schwab and Bartholdi, 1996; Fawcett and Asher, 1999; Silver and Miller, 2004). Accordingly, treatments to overcome these multiple deficits will require a multifaceted combination strategy (Bunge, 2008; Fortun et al., 2009).
Our previous studies demonstrated that transplantation of Schwann cells (SCs) holds promise for SCI repair (Xu et al., 1997; Takami et al., 2002; Pearse et al., 2004; Fouad et al., 2005; Golden et al., 2007; Pearse et al., 2007; Bunge, 2008; Fortun et al., 2009; Tetzlaff et al., 2011). The transplantation of SCs provides neuroprotection, reduces cyst formation, promotes axonal regrowth and myelination, and modestly improves functional outcome. In vitro systems to harvest and expand human SCs present a unique opportunity for autologous transplantation after human SCI (Levi et al., 1995; Rutkowski et al., 1995; Bunge and Pearse, 2003; Bunge and Wood, 2012).
We previously investigated combining SC transplantation with a bifunctional neurotrophin, D15A, for contusion injury (Golden et al., 2007). D15A activates both TrkB and TrkC receptors and thus mimics the effects of NT-3 and BDNF (Urfer et al., 1994; Cao et al., 2005). Transduced SCs secreting D15A markedly increased SCs and axons in the transplant and myelination of the axons in the transplant (Golden et al., 2007). SCs secreting D15A, however, did not lead to improvement in open field locomotion (on the basis of BBB scoring; Basso et al., 1995), possibly because they did not enable regenerated axons to leave the transplant.
Chondroitin sulfate proteoglycans (CSPGs) are synthesized and deposited in the glial scar after SCI (Lemons et al., 1999; Plant et al., 2001; Morgenstern et al., 2002; Jones et al., 2003; Tang et al., 2003). CSPGs are known to inhibit regeneration of axons and contribute to the limited functional recovery observed after SCI. Degradation of CSPGs with chondroitinase ABC (ChABC) promotes axonal regeneration and functional recovery (Bradbury et al., 2002; Silver and Miller, 2004; Fouad et al., 2005; Barritt et al., 2006; Cafferty et al., 2007; Massey et al., 2008; Bradbury and Carter, 2011). ChABC, an enzyme that cleaves glycosaminoglycan side chains from the CSPGs, is useful for overcoming the inhibitory influence of CSPGs on axon growth in the injured spinal cord (Bradbury et al., 2002).
We predicted, therefore, that combining SC transplantation with neurotrophin and ChABC to increase axons, not only growing into the graft but also exiting the graft, would improve locomotor function after SCI. Accordingly, we transplanted genetically engineered SCs to secrete D15A and ChABC into a rat contusion injury and investigated the graft volume, SC number, degradation of CSPGs, astrogliosis, SC myelination of axons, presence of propriospinal and supraspinal axons, locomotor outcome, and hind paw mechanical and thermal sensitivity. Engineering of SCs to secrete neurotrophin and ChABC significantly promoted axonal regeneration and improved locomotor and sensory outcomes, the combination being more efficacious than either treatment alone.
Materials and Methods
Reagents.
Antibodies used were as follows: mouse anti-neurofilament antibody (RT97; Developmental Studies Hydridoma Bank, Iowa City, IA), rabbit anti-S100 antibody (catalog #119250; Dako), chicken anti-GFP antibody (catalog #P42212; Millipore), rabbit anti-mCherry antibody (catalog #632496; Clontech), mouse anti-CS56 antibody (catalog #C8035; Sigma-Aldrich), mouse anti-2B6 antibody (catalog #270432; Seikagaku), mouse anti-GFAP antibody (catalog #SMI-22R; Covance), and rabbit anti-5-HT antibody (catalog #20080; Immunostar). Secondary antibodies included goat anti-chicken IgG Alexa Fluor 488 antibody (catalog #A-11039), goat anti-rabbit IgG Alexa Fluor 594 antibody (catalog #A-11012), goat anti-mouse IgG Alexa Fluor 405 antibody (catalog #A-31553), goat anti-rabbit IgG Alexa Fluor 405 antibody (catalog #A-31556), goat anti-rabbit IgG Alexa Fluor 660 antibody (catalog #A-21073), and goat anti-mouse IgG Alexa Fluor 660 antibody (catalog #A-21054), all from Invitrogen. Purified ChABC (catalog #100332) was from Seikagaku, chondroitin sulfate (catalog #C4384) and dimethylmethylene blue (DMB; catalog #341088) were from Sigma-Aldrich, and the NT-3 ELISA kit (catalog #G7641) was from Promega.
Schwann cells.
Purified populations of SCs were obtained from the sciatic nerves of adult female Fischer rats (Harlan Laboratories) as described previously (Morrissey et al., 1991). SCs were then purified and expanded as described previously (Meijs et al., 2004). Briefly, after removal of the epineurium, the nerves were cut into 3-mm-long segments that were placed into 60 mm plastic culture dishes and covered with D10 medium (DMEM; Invitrogen) containing 10% fetal bovine serum (Hyclone). The segments were transferred to new dishes weekly and the medium was refreshed biweekly. After 2 weeks, the explants were treated with dispase (Roche) and collagenase (Worthington), dissociated and, after centrifugation (1500 g at 4°C), resuspended in D10 medium with the SC mitogens, pituitary extract (20 μg/ml; Biomedical Technologies), forskolin (2 μm; Sigma-Aldrich), and heregulin (2.5 nm; Genentech). The cells were then plated onto poly-l-lysine-coated culture dishes (Sigma-Aldrich), given fresh medium biweekly, and, when confluent, replated at 1/4 confluent density into new dishes. Early on, the cells were treated with Thy-1 and rabbit complement (MP Biomedicals) to eliminate remaining fibroblasts. The cells were grown to confluency and passaged to new dishes three times (P3) before transplantation. The resulting SC cultures were >95% pure based on S100 immunostaining (Dako; Takami et al., 2002).
Lentiviral vector preparation.
Lentiviral vectors encoding enhanced GFP and mCherry were used to transduce the SCs to enable their tracking in vivo (Golden et al., 2007; Hill et al., 2007; Pearse et al., 2007; Patel et al., 2010). Lentiviral vector preparation was performed as described previously (Follenzi et al., 2000). The genes were subcloned into a lentiviral vector plasmid containing the cytomegalovirus promoter and the Woodchuck posttranscriptional regulatory element.
The lentiviral particles were produced by the Miami Project Viral Vector Core. Cultured HEK 293T cells were used for transfecting the plasmids and viral harvesting. Briefly, 24 h before transfection, HEK 293T cells were plated in T-175 flasks (using 25 ml of high-glucose DMEM plus 10% FBS) so that the cells reached 90% confluency on the day of transfection. For each flask, dilute 12.2 μg of transfer vector, 6.1 μg of pMDL (Gag/Pol), 3.1 μg of pREV, 3.7 μg of vesicular stomatitis virus glycoprotein (pVSVG) were combined in 1 ml of Opti-MEM I Reduced Serum Medium. Lipofectamine 2000 was mixed before use, then diluted to 62.5 μl in 1 ml of Opti-MEM I Reduced Serum Medium and incubated for 5 min. The diluted DNA was combined with diluted Lipofectamine 2000 and incubated for 20 min at room temperature. The complexes were added to the flask and incubated at 37°C in a CO2 incubator overnight. After 40 h in 30 ml of fresh medium, the supernatant was harvested and centrifuged at 500 × g for 5 min at 4°C, followed by filtration using a 0.45-μm-pore PVDF Durapore filter (Millipore). The supernatant was then ultracentrifuged at 21,000 rpm for 2.5 h at 4°C in a SW-28 rotor (Beckman). The virus pellets were resuspened in PBS/1% BSA. The viral titer was determined by p24 ELISA assay (PerkinElmer) for quantifying p24 core protein concentrations. Purified viral vector stocks were stored at −80°C until SC infection.
Human D15A cDNA was generated previously (Urfer et al., 1994). The lentiviral vector encoding D15A was prepared as described previously (Follenzi and Naldini, 2002; Blits et al., 2005; Golden et al., 2007). The gene for Proteus vulgaris chondroitinase ABC expression in mammalian cells was developed by Muir et al. (2010). Lentiviral vectors encoding the ChABC gene were generated by the Verhaagen team (Hendriks et al., 2007; Zhao et al., 2011).
Lentiviral vector transduction of Schwann cells.
These vectors were used to transduce SCs at passage one. SC cultures were transduced by the addition of a predetermined volume of the concentrated lentivirus. SCs (5 × 10⁵/well) at 70% confluency were seeded in 12-well plates with D10 and mitogens and then transduced overnight with varying multiplicities of infection (MOIs; 10, 20, 30, 50, 100, and 2000) of lentiviral vectors. The following day, medium was refreshed and the cultures were incubated for 2 more days. The cell cultures were fixed in 4% paraformaldehyde and stained with Hoechst to allow a comparison of Hoechst-labeled nuclei and GFP- or mCherry-positive cells. The in vitro transduction efficiency lentiviral system was assayed using GFP and mCherry expressions of SCs. An optimal MOI of 30 was designated by highest transduction efficiency (>95% of GFP- or mCherry-positive cells) with no obvious signs of toxicity. The optimal MOI was used for all subsequent in vitro and in vivo studies.
We prepared four different types of transduced SCs: (1) with only GFP (GFP-SCs); (2) with only mCherry (mCherry-SCs), (3) with GFP and D15A (GFP/D15A-SCs), and (4) with mCherry and ChABC (mCherry/ChABC-SCs). GFP and mCherry lentiviral vectors were used to visualize the SCs transduced with D15A or ChABC separately. The transduced cells, harvested and stored in liquid nitrogen, were thawed and expanded as needed.
D15A activity in vitro.
D15A levels in conditioned medium were determined using an NT-3 ELISA capable of recognizing the NT-3 backbone of D15A. SCs were thawed and incubated in growth medium. Conditioned media from GFP- or GFP/D15A-transduced SC or nontransduced SC cultures were collected at 24 h intervals. The amount of neurotrophin was determined according to the manufacturer's protocol (Promega). Neurite outgrowth assays were used to demonstrate D15A bioactivity (Golden et al., 2007). Lumbar dorsal root ganglia (DRG) were removed on embryonic day 15 and placed in 12-well dishes. Then, 600 μl of conditioned medium collected from confluent GFP-SC or GFP/D15A-SC cultures at 24 h intervals or medium supplemented with BDNF (730 ng/ml) and NT-3 (730 ng/ml) were added to the wells for 3 d at 37°C in 5% CO2. Each culture was fixed and immunostained with a mouse monoclonal anti-neurofilament antibody (RT97, 1:5 in TBS–normal goat serum; Developmental Studies Hydridoma Bank).
Chondroitinase ABC activity in vitro.
The enzymatic activity of ChABC in SC-conditioned media was quantified by a DMB (Sigma-Aldrich) assay that measured the sulfated glycosaminoglycan cleaved by ChABC (Farndale et al., 1982; Ettenson et al., 2000; Liu et al., 2012). For the DMB assay, 10 μl of conditioned medium were collected daily from nontransduced SC-, mCherry-, or mCherry/ChABC-transduced SC cultures and incubated with 10 μl of chondroitin sulfate (0.25 mg/ml) for 15 min at 37°C. As described previously (Liu et al., 2012), 180 μl of DMB solution (16 mg of DMB, 2.37 g of NaCl, 3.04 g of glycine, 75 ml of 0.1 m HCl in 1 L of H2O) were added to 20 μl of the reaction sample and the absorbance was recorded at 660 nm. The absorbance of the chondroitin sulfate without the conditioned medium was used as the control. The enzymatic activity was calculated with a linear standard curve generated using purified ChABC (Seikagaku).
To confirm ChABC bioactivity to degrade CSPGs in normal spinal cord tissue, cryostat sections were incubated in PBS, in conditioned medium collected from mCherry/ChABC-transduced SC cultures, or in PBS containing ChABC (300 mU/ml) for 3 h at 37°C (Moon et al., 2002). Immunostaining of the incubated sections for CS-56 (to detect intact CSPGs) and 2B6 (to detect degraded CSPGs) was performed as described in Immunohistochemistry, below.
Animals.
Adult female Fischer rats (total n = 280; 160–180 g weight; Harlan Laboratories) were housed in accordance with National Institutes of Health guidelines and the Guide for the Care and Use of Laboratory Animals. The Institutional Animal Care and Use Committee of the University of Miami approved all animal procedures. Efforts were made to minimize the number of animals used and to decrease animal suffering. Rats were anesthetized (45 mg/kg ketamine, 5 mg/kg xylazine) by intraperitoneal injection. Adequate anesthesia was determined by monitoring the corneal reflex and hindlimb withdrawal to painful stimuli. During surgery, the rats were kept on a heating pad to maintain body temperature at 37 ± 0.5°C. Rats were housed two per cage at a temperature of 24°C with ad libitum access to water and food before and after surgery. Figure 1 summarizes the experimental timeline in this study.
Figure 1.

Summary of the experimental timeline.
Contusion injury.
A laminectomy was performed at thoracic vertebra T8, exposing the dorsal surface of the spinal cord without disrupting the dura mater. Moderate thoracic spinal cord contusion injuries (10 g weight dropped 12.5 mm) were induced using the MASCIS weight-drop device (Gruner, 1992). Animals were excluded immediately when the height or velocity errors exceeded 7% or if the compression distance was not within the range of 1.35–1.75 mm (Barakat et al., 2005; Pearse et al., 2007). After injury, the overlying musculature was sutured and the skin closed using wound clips. The rats recovered in a warmed cage with water and food easily accessible. The rats received postoperative care that included the administration of gentamicin (5 mg/kg, intramuscular; Abbott Laboratories), Buprenex (0.3 mg/kg, subcutaneous; Reckitt Benckiser), and lactated Ringer's solution (Pearse et al., 2007). Bladders were expressed twice a day until spontaneous voiding began.
SC transplantation.
Transduced SCs were harvested from culture by trypsinization, centrifuged, resuspended, and counted. SCs were resuspended in aliquots of DMEM/F12 medium (Live Technologies). The two types of transduced SCs were mixed just before transplantation. Animals were randomly assigned to one of five transplant groups (n = 56 per group): (1) DMEM/F12 medium alone (DMEM/F12 group), (2) mCherry-SCs + GFP-SCs (SC control group), (3) mCherry-SCs + GFP/D15A-SCs (SC-D15A group), (4) GFP-SCs + mCherry/ChABC-SCs (SC-ChABC group), and (5) GFP/D15A-SCs + mCherry/ChABC-SCs (SC-D15A + ChABC group; Table 1). At 7 d after injury, rats were reanesthetized, the injury site was exposed, and a total of 2 × 10⁶ SCs (1 × 10⁶ cells for each type) in 6 μl of DMEM/F12 medium was injected into the contused area (Takami et al., 2002; Pearse et al., 2004). The SC injection was performed over 3 min (2 μl/min) into the injury epicenter at a depth of 1 mm in the midline at T8 using a micromanipulator with a microinjector (World Precision Instruments; Patel et al., 2010). A 10 μl Hamilton syringe with a pulled glass capillary tube [150 μm inner diameter (ID)] was secured in the micromanipulator. The capillary tube was kept in place for an additional 3 min to minimize leakage upon withdrawal (Patel et al., 2010). After injection, the muscle layers were sutured and the skin closed with wound clips. Table 2 summarizes number of animals in each group used for each analysis in this study.
Table 1.
Listing of the experimental groups and the transplanted SCs
| Experimental groupsa | GFP-SCs | GFP/D15A-SCs | mCherry-SCs | mCherry/ChABC-SCs |
|---|---|---|---|---|
| DMEM/F12 | — | — | — | — |
| SC control | + | — | + | — |
| SC-D15A | — | + | + | — |
| SC-ChABC | + | — | — | + |
| SC-D15A + ChABC | — | + | — | + |
aTwo types of transduced SCs (1 × 10⁶ cells for each type; total of 2 × 10⁶) were mixed and transplanted in each experimental group. The number of D15A- or ChABC-transduced SCs transplanted in the SC-D15A and SC-ChABC groups were the same in the combination group.
Table 2.
Number of animals for each experimental analysis at each time pointa
| Experimental group | Immunohistochemistry, (3 wk, 13 wk)b | Myelinated axonsb (13 wk) | NT-3 ELISA in vivo (9 d, 3 wk, 7 wk) | DMB assay in vivo (9 d, 3 wk, 7 wk) | CST tracing (14 wk) | PST tracingc (14 wk) | Retrograde tracingc (14 wk) |
|---|---|---|---|---|---|---|---|
| DMEM/F12 | 6, 6 | 5 | 4, 4, 4 | 3, 3, 3 | 6 | 5 | 7 |
| SC control | 6, 6 | 5 | 4, 4, 4 | 3, 3, 3 | 6 | 5 | 7 |
| SC-D15A | 6, 6 | 5 | 4, 4, 4 | 3, 3, 3 | 6 | 5 | 7 |
| SC-ChABC | 6, 6 | 5 | 4, 4, 4 | 3, 3, 3 | 6 | 5 | 7 |
| SC-D15A + ChABC | 6, 6 | 5 | 4, 4, 4 | 3, 3, 3 | 6 | 5 | 7 |
aNumbers in parentheses indicate time points of analyses after injury.
bSeven animals of those observed until 12 weeks were used for BBB scoring.
cSeven animals were used for analyses of Catwalk and allodynia.
Tracing.
Three tracing experiments were performed, each one in a separate cohort of animals. For corticospinal tract (CST) anterograde tracing at 11 weeks after contusion, biotinylated dextran amine (BDA; 10,000 MW, 10% in PBS, 0.5 μl/site; Invitrogen) was stereotactically injected into 6 sites in the sensorimotor cortex (0.7, 1.4, 2.5 mm posterior to the bregma, ±2.3 mm lateral to the midline, depth 1.5 mm; Hill et al., 2001). The injections, made with a glass tube (50 μm ID) attached to a 10 μl Hamilton syringe held in the micromanipulator, were performed over 5 min. For propriospinal tract (PST) anterograde tracing, at 13 weeks after injury, a laminectomy was performed at T6. BDA (0.15 μl/site) was stereotactically injected into 4 sites bilaterally (7.0 and 5.5 mm rostral to the rostral edge of the injury, ±0.3 mm lateral to the midline, 1.5 mm beneath the cord surface). The injections with a 1 μl syringe and glass tube (150 μm ID) were performed over 3 min in a micromanipulator. For retrograde neuronal tracing, animals at 13 weeks after injury received a laminectomy at T10. A total of 0.6 μl of 2% fast blue (FB, 0.3 μl/site; Sigma-Aldrich) was injected into two sites in the spinal cord bilaterally at 7 mm caudal to the caudal edge of the injury (Takami et al., 2002; Pearse et al., 2004). Every injection was performed over a 3 min period and the injection needle was kept in place for an additional 3 min to minimize leakage upon withdrawal (Xu et al., 1999; Chau et al., 2004).
Immunohistochemistry.
At 2 or 12 weeks after transplantation, animals were transcardially perfused with normal saline, followed by 4% paraformaldehyde in 0.1 m PBS at pH 7.4 (Takami et al., 2002). The T7–9 spinal cord segments centered at the injury site were postfixed in the same fixative overnight at 4°C, cryoprotected in 30% sucrose in PBS for 48 h at 4°C, and embedded in gelatin (Oudega et al., 1994). Serial sagittal cryostat sections (20 μm thick) were mounted on slides. Sections were rinsed 3× with TBS and incubated in a blocking solution of 5% NGS with 0.5% Triton X-100 for 1 h at room temperature. The sections were incubated in antibodies against chicken anti-GFP (1:500), rabbit anti-mCherry (1:500), mouse anti-CS56 (1:500), mouse anti-2B6 (1:200), mouse anti-GFAP (1:500), or rabbit anti-5-HT (1:2000) diluted in TBS with 5% NGS and 0.5% Triton X-100 overnight. Sections were rinsed 3× with TBS and incubated with secondary antibodies (all 1:200; Invitrogen), goat anti-chicken IgG Alexa Fluor 488, goat anti-rabbit IgG Alexa Fluor 594, goat anti-mouse IgG Alexa Fluor 405, goat anti-rabbit IgG Alexa Fluor 405, goat anti-rabbit IgG Alexa Fluor 660, or goat anti-mouse IgG Alexa Fluor 660, with 1% NGS and 100 μm Hoechst dye (Sigma-Aldrich) for 1 h at room temperature. Sections were rinsed 3× with TBS and coverslipped with Vectashield (Vector Laboratories).
Graft volume and SC number.
SC graft volume was analyzed in the serial sagittal sections that were immunostained for GFP and mCherry using unbiased computer-assisted microscopy and StereoInvestigator 10 software (MBF Bioscience; Golden et al., 2007; Patel et al., 2010). The SC graft in each section (20 μm thickness, 200 μm intervals) was delineated at 20× using GFP and mCherry fluorescence and immunolabeling to determine the SC graft area. This area was automatically calculated and the graft volume determined using the equation: V = ∑ [transplant area × section thickness × 10 (number of sections in each sampling interval)] (Biernaskie et al., 2007). The graft area in each section was measured blindly. Then two serial sagittal sections that contained the lesion site with the largest graft area were blindly selected for other analyses.
To compare the numbers of transplanted labeled SCs in the experimental groups, the serial sections (20 μm thickness, 200 μm intervals) were analyzed using StereoInvestigator software (Patel et al., 2010). SC transplants were outlined at 4× and then SCs were counted under a 63× oil objective. Then the optical fractionator sampling design (counting frame area, 50 × 50 μm; sampling grid size, 250 × 250 μm) was used. In each sampling site, both GFP- and mCherry-labeled SCs were marked and recorded using a dissector probe, only counting the labeled cell bodies that contained a nucleus. SC number within the transplant in the section was automatically calculated by StereoInvestigator software. Two serial sagittal sections per rat around the midline containing the largest graft were chosen and then the number of SCs in the two sections were summed and compared among the groups.
D15A activity in vivo.
At 2 d or 2 or 6 weeks after transplantation, spinal cord segments (5 mm length) centered at the injury/graft sites were removed, quickly frozen, and stored at −80°C. Tissue was weighed and homogenized by placing it in 10× weight/volume lysis buffer (137 mm NaCl, 20 mm Tris, 1% NP-40; Calbiochem), 10% glycerol, 1 mm phenylmethylsulfonyl fluoride, 0.5 mm sodium vanadate, 1 μg/ml leupeptin, and 10 μg/ml aprotinin, pH 8.0. Samples were centrifuged at 12,000 rpm for 5 min and the supernatants harvested and stored at −80°C. The amount of neurotrophin in the supernatants was determined using an ELISA recognizing NT-3 according to the manufacturer's protocol (Ying et al., 2003; Golden et al., 2007). Measurements were normalized to total protein, as determined by a standardized Bradford protein assay. NT-3 was expressed as the total amount in the sample per milligram of total protein.
Chondroitinase ABC activity in vivo.
To analyze cleavage of CSPGs by ChABC in the transplanted spinal cord, immunointensity of CS56 and 2B6 antibody staining was quantified in the two serial sagittal sections around the midline containing the largest grafts (Karimi-Abdolrezaee et al., 2010). Quantification of immunointensity of GFAP staining was also performed to analyze astrogliosis. The entire sagittal section was imaged at 10× using a confocal microscope with tiling and stitching software (Fluoview, Olympus America). For imaging, the appropriate confocal setting in the first microscopy session that would avoid signal saturation was determined and the same setting was used thereafter. Using ImageJ software, the obtained images were converted into gray scale and the 5 mm length of spinal cord containing lesion and perilesion areas was traced in each section. Furthermore, automatic thresholding for each image was performed using the software to determine the threshold for a specific signal (Karimi-Abdolrezaee et al., 2010). The default threshold setting was used and the thresholding values were maintained at constant levels for all analyses. After setting the threshold, the integrated immunodensity above the threshold was automatically calculated. Then, the integrated density was divided by the sample area to calculate the mean density per unit area. This calculation was performed to compensate for the different sizes of the region of interest in the spinal cord. The mean values for each animal were then compared.
To analyze enzymatic activity of ChABC in the transplanted spinal cord, a DMB assay was performed using the supernatants from the homogenized tissue (see Chondroitinase ABC activity in vitro, above). 10 μl of supernatant were incubated with 10 μl of chondroitin sulfate (0.25 mg/ml) for 15 min at 37°C using an absorbance of 660 nm. Measurements, calculated with a linear standard curve, were normalized to total protein determined by a standardized Bradford protein assay.
SC migration.
The migration of GFP- and mCherry-positive SCs into the host spinal cord was quantified. First, the sections that contained transplanted SCs were immunostained for GFAP to define the border between the host spinal cord tissue (GFAP-positive) and the lesion site/implant (GFAP-negative). After tracing these borders, the GFP- and mCherry-positive SCs in the host spinal cord were automatically counted using the particle analysis tool of ImageJ (Petryniak et al., 2007; Drury et al., 2011). The counts were performed on the two serial sagittal sections around the midline containing the largest transplants and compared among the groups.
SC-myelinated axon counts.
A 1 mm transverse slice from the graft/injury center was removed after perfusion and prepared for electron microscopy (Xu et al., 1995). Then, 1 μm plastic transverse sections were stained with toluidine blue, followed by 4% paraphenylenediamine to visualize myelin (Murray et al., 2001). SC-myelinated axons were counted at 63× under oil; the total number was obtained with StereoInvestigator software (MBF Bioscience; Takami et al., 2002; Pearse et al., 2004; Golden et al., 2007). Using the optical fractionator sampling design (counting frame area, 50 × 50 μm; grid size, 150 × 150 μm), the graft epicenter was systematically sampled. These sections allow central (oligodendrocyte) myelin to be distinguished morphologically from peripheral (SC) myelin (Bunge et al., 1994; Pearse et al., 2004). The analysis was performed by the examiners blinded to the animal groups.
Quantitation of traced axons and brainstem neurons.
Fourteen weeks after injury, the rats were transcardially perfused and the brains and spinal cords containing the injury site were extirpated and embedded in gelatin. Serial 40-μm-thick transverse sections of the brainstem and sagittal sections of the spinal cord were prepared.
For quantitation of CST anterograde tracing, BDA-labeled axons were examined in every fifth sagittal section (40 μm thickness, 200 μm intervals). The labeled axons were visualized with fluorescein-conjugated streptavidin (Invitrogen; Pearse et al., 2004) and the sections coverslipped with Citifluor (UKC Chemical Laboratory). Numbers of BDA-labeled axons were determined by counting all labeled axons crossing imaginary lines placed perpendicular to the rostral-caudal axis of the spinal cord at 500 μm rostral and 500 μm caudal to the edges of the graft (delineated by GFP- and mCherry-labeled SCs) and through the center of the graft (Pearse et al., 2004). BDA-labeled axons in host tissue outside the graft epicenter were counted separately. The numbers in each section were summed per rat and then multiplied by 5 to obtain the final number.
For quantitation of PST anterograde tracing, BDA-labeled axons were counted using the sagittal sections and visualized as above. The number of BDA-labeled propriospinal axons was determined at the center of the graft and at 500 μm caudal to the caudal edge of the graft (Chau et al., 2004). We selected the two serial sagittal sections (40 μm thickness, 200 μm intervals) around the midline that contained the largest implant per rat and the numbers of axons in the two sections were summed and compared.
To assess numbers of neurons labeled by retrograde tracing, every tenth section (40 μm thickness, 400 μm intervals) of the embedded brainstems was identified according to Paxinos and Watson (1998). The number of FB-labeled neurons was quantified in the reticular formation, the raphe nuclei, and the entire brainstem (Takami et al., 2002; Pearse et al., 2004; Lo et al., 2009). Only neurons containing nuclei were counted (Iannotti et al., 2003; Carter et al., 2011). These numbers were summed per rat and multiplied by 10 to obtain the total number of labeled neurons for each region.
Quantitation of 5-HT-immunolabeled axons.
The number of 5-HT-immunolabeled axons was determined by counting all labeled axons crossing imaginary lines placed perpendicular to the rostral-caudal axis of the spinal cord at the center of the graft and at 500 μm caudal to the caudal edge of the graft (Pearse et al., 2004). For comparing the numbers of axons among the five groups, the two serial sagittal sections around the midline that contained the largest graft per rat were selected; the numbers of axons in these sections were summed and compared.
BBB open-field testing and Catwalk analysis.
All locomotor assessments were performed by at least two examiners blinded to the group allocation. BBB scoring (Basso et al., 1995) was performed weekly from 1 to 13 weeks after injury. In addition, a BBB subscore was obtained to provide a separate assessment of hindlimb and tail positioning (Basso, 2004). All animals in the present study scored 21 for the BBB score and 13 for the BBB subscore during baseline assessment. Catwalk gait analysis evaluates both static and dynamic locomotor parameters, such as stride length, base of support, interlimb coordination, and swing/stance phases (Hamers et al., 2001; Koopmans et al., 2005). The objective analyses using Catwalk can overcome the disadvantage of a more subjective assessment of coordination by the BBB locomotor rating scale (Hamers et al., 2001; Deumens et al., 2007). At 1 week before injury, the animals were trained to cross the walkway a minimum of 3× daily for Catwalk analysis. Catwalk data were obtained before injury and at 5, 9, and 13 weeks after injury; a minimum of three uninterrupted crossings/animal was required. Stride length, base of support, and interlimb coordination were analyzed by making use of the regularity index and frequency of regular steps (% Ab step pattern; Cheng et al., 1997; Lankhorst et al., 2001; Joosten et al., 2004).
Assessment of mechanical and thermal allodynia.
Assessment of mechanical and thermal allodynia was done in a blinded manner before injury and at 5, 9, and 13 weeks after injury. For mechanical allodynia testing, rats were placed in elevated Plexiglas chambers with a wire mesh floor and allowed 30 min to acclimatize. Cutaneous sensitivity to innocuous mechanical stimulation of both hindpaws was evaluated using the up-down method with eight specific calibrated von Frey filaments (Chaplan et al., 1994). A von Frey filament was pressed against the plantar skin such that it slightly bowed. If no hindpaw withdrawal was elicited, then the next higher force filament was used. A hindpaw withdrawal indicated the use of a filament with a lesser force. Both hindpaws were tested ∼5 min apart. The series of responses to the filaments was converted into a 50% withdrawal threshold measured in grams (Chaplan et al., 1994); the highest withdrawal threshold was 15 g and the lowest was 0.25 g. To be included in the study, a withdrawal threshold of 4 g or less was required (Hama and Sagen, 2011).
For thermal allodynia testing, a rat was placed in a Plexiglas enclosure that rested on an elevated glass floor. A commercially available infrared plantar test device (Ugo Basile) was used to assess sensitivity of the plantar hindpaws to a brief noxious heat stimulus (Hargreaves et al., 1988). After acclimatization for 30 min, an infrared emitter under the glass floor was positioned directly beneath the midplantar hindpaw. The length of time between the onset of the infrared stimulus and the paw withdrawal is termed “withdrawal latency” (measured in seconds). The device shuts off the infrared stimulus automatically and records the withdrawal latency when an animal withdraws the hindpaw from the stimulus. The average of three trials/paw was used to report the final withdrawal latency. Testing of the same paw was separated by at least 5 min. To prevent tissue damage, a cutoff of 20 s was used (Hama et al., 2010).
Statistical analysis.
All statistical analyses were performed using the GraphPad Prism 5.0a software program. All data are presented as means ± SEM. For comparisons among SCs in vitro, statistical differences were established using one-way ANOVA followed by a Tukey's post hoc test. For immunohistochemical analyses, NT-3 ELISA in vivo, DMB assay in vivo, and behavioral analyses, significant differences between the treatment groups were assessed using the nonparametric Mann–Whitney U test or the parametric Student's t test. Differences of p < 0.05 were considered to be statistically significant.
Results
D15A-transduced SCs secrete active neurotrophin in vitro
The four groups of transduced SCs appeared normal and showed high expression of GFP and mCherry (Fig. 2A–D). When DRG were incubated in conditioned medium from D15A/GFP-SC cultures (Fig. 2F), neurite outgrowth was robust compared with GFP-SC-conditioned medium (Fig. 2E). D10 medium supplemented with BDNF and NT-3 also increased DRG neurite outgrowth (Fig. 2G). D15A levels in conditioned medium were determined using an NT-3 ELISA capable of recognizing the NT-3 backbone of D15A. GFP/D15A-SC-conditioned medium contained significantly higher levels of NT-3 (55.0 ± 1.0 ng/ml/24 h, p < 0.01) than media from nontransduced SC or GFP-SC controls (which did not contain detectable levels) at 3 d after transduction (Fig. 2H).
Figure 2.
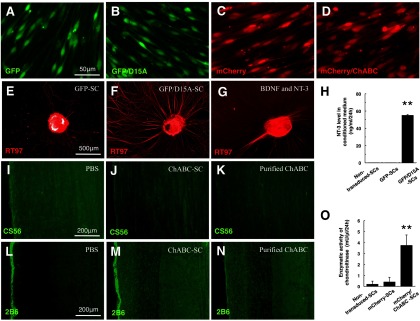
Transduced SCs secrete bioactive D15A and ChABC in vitro. A–D, SCs transduced to express GFP, GFP/D15A, mCherry, and mCherry/ChABC showed good expression of GFP or mCherry and morphological differences were not observed. E–G, Embryonic DRG incubated in conditioned medium from a D15A/GFP-SC culture (F) and in medium containing added BDNF and NT-3 (G) showed robust neurite outgrowth compared with GFP-SC conditioned medium (E). H, NT-3 ELISA revealed that NT-3 levels in conditioned medium from GFP/D15A-SC cultures were significantly higher than from nontransduced SC and GFP-SC cultures. I–K, After CS56 staining, immunoreactivity in the spinal cord sections incubated with conditioned medium from a ChABC-transduced SC culture (J) and purified ChABC (K) was decreased compared with PBS (I). L–N, Conversely, after 2B6 staining, immunoreactivity in the sections incubated with the conditioned medium (M) and purified ChABC (N) was increased compared with PBS (L). O, DMB assay demonstrated enzymatic activity of ChABC in conditioned medium from mCherry/ChABC-SC cultures. Data are presented as mean ± SEM; n = 3 per each SC group. **p < 0.01.
ChABC-transduced SCs secrete active chondroitinase in vitro
After immunostaining for CS56, immunoreactivity in normal spinal cord sections incubated with conditioned medium from ChABC-transduced SC cultures (Fig. 2J) and with purified ChABC (Fig. 2K) was decreased compared with the sections incubated with PBS (Fig. 2I). In contrast, 2B6 immunoreactivity in sections incubated with conditioned medium from ChABC-transduced SCcultures (Fig. 2M) and purified ChABC (Fig. 2N) was increased compared with sections incubated with PBS (Fig. 2L), demonstrating that the enzyme had been active. The DMB assay showed that enzymatic activity in conditioned medium from mCherry/ChABC-SC cultures was significantly higher (3.7 ± 0.6 mU/μl/24 h) than from nontransduced SC cultures (0.2 ± 0.3 mU/μl/24 h, p < 0.01) and mCherry-SC cultures (0.4 ± 0.2 mU/μl/24 h, p < 0.01) (Fig. 2O).
D15A-transduced SCs increase graft volume and SC number
At 12 weeks after transplantation (Fig. 3A–F), the graft volumes were significantly larger in the SC-D15A (1.6 ± 0.1 mm3, p < 0.01) and SC-D15A + ChABC groups (2.4 ± 0.2 mm3, p < 0.01) compared with the SC control group (0.7 ± 0.1 mm3). In addition, the SC-D15A + ChABC group showed a significantly larger volume than did the SC-D15A (p < 0.05) and SC-ChABC (0.8 ± 0.2 mm3, p < 0.01) groups.
Figure 3.

D15A increases graft volume and SC number in the injured spinal cord. A–E, At 12 weeks after transplantation, GFP-labeled (green) and mCherry-labeled (red) SCs had mixed well and were present in all transplanted groups. The groups with D15A (C and E vs B and D) showed larger SC grafts. F, Quantitation of the graft volume. G, Comparison of total numbers of labeled SCs. H, NT-3 ELISA of transplanted spinal cord tissue samples. Data are presented as mean ± SEM; n = 5 per group in F and G; n = 4 per group in H. *p < 0.05, **p < 0.01 compared with SC control group. #p < 0.05, ##p < 0.01 compared with SC-D15A or SC-ChABC group.
In comparing the total number of GFP- and mCherry-labeled SCs in two sections from the center of the graft (Fig. 3G), the SC-D15A (18,665 ± 1928, p < 0.01) and SC-D15A + ChABC groups (17,265 ± 1455, p < 0.05) showed significantly higher numbers of SCs within the lesion site compared with the SC control group (9900 ± 1001). The SC-D15A + ChABC group also showed significantly higher numbers than the SC-ChABC group (8536 ± 2196, p < 0.05). For GFP-labeled SCs, the SC-D15A + ChABC group (7485 ± 2813) showed a higher number than the SC control group (4395 ± 754, p < 0.05); mCherry-labeled SCs were higher in the SC-D15A group (12015 ± 858, p < 0.01) than in SC controls (5505 ± 876). There were no statistically significant differences between the numbers of GFP-labeled and mCherry-labeled SCs in each group. Transplanted SC number measurements were obtained in a blinded fashion from two serial sagittal sections around the midline of the largest graft per rat.
The NT-3 ELISA of the transplanted spinal cord showed the levels of NT-3 to be significantly higher in the SC-D15A (1043 ± 72 pg/mg total protein, p < 0.05) and SC-D15A + ChABC groups (1199 ± 70 pg/mg total protein, p < 0.05) compared with SC control grafts (182 ± 29 pg/mg total protein) at 2 d after transplantation (Fig. 3H), diminishing by 2 weeks. At this time, the levels in the SC-D15A (116 ± 16 pg/mg total protein, p < 0.05) and SC-D15A + ChABC (123 ± 16 pg/mg total protein, p < 0.05) groups remained significantly higher than in the SC control group (67 ± 5 pg/mg total protein).
ChABC is active inside and outside the graft
After immunostaining for CS56 in spinal cord sections at 2 weeks after transplantation, the SC control and SC-D15A groups and the DMEM/F12 group showed immunoreactivity around the graft/lesion sites (Fig. 4A,C,E). In contrast, the SC-ChABC and SC-D15A + ChABC groups did not exhibit this immunoreactivity (Fig. 4G,I). At 12 weeks, some immunoreactivity was seen around the lesion (Fig. 5A); the SC control and SC-D15A groups showed CS56 immunoreactivity both inside and outside the graft, especially in the dorsal spinal cord (Fig. 5C,E). In contrast, the SC-ChABC and SC-D15A + ChABC groups did not show this immunoreactivity (Fig. 5G,I). The quantification of CS56 immunointensity confirmed these observations at 2 (p < 0.05) and 12 weeks (p < 0.01; Fig. 5K).
Figure 4.

SCs secreting ChABC reduce immunoreactivity for CSPGs in injured spinal cords at 2 weeks after transplantation. After staining for CS56, the groups without ChABC showed higher immunoreactivity around the lesion sites (A, C, E, arrows). In contrast, the groups with ChABC did not exhibit such immunoreactivity (G, I). After 2B6 staining, higher immunoreactivity was observed both inside and around the transplant in the groups with ChABC (arrowheads in H and J vs B, D, F).
Figure 5.

ChABC reduced CSPG immunoreactivity in injured spinal cords at 12 weeks after transplantation. In staining for CS56 at 12 weeks after transplantation (A, C, E, G, I), the groups without ChABC showed immunoreactivity both inside and around the transplant (C, E, arrows). In contrast, the groups with ChABC did not show heightened immunoreactivity (G, I), confirmed by quantitation of immunodensity (K). 2B6 staining at 12 weeks revealed higher immunoreactivity both inside and around the graft in the groups with ChABC (arrowheads in H and J vs B, D, F), as confirmed by immunodensity measurements (L). The enzymatic activity as assessed by the DMB assay is graphed in M. Data are presented as mean ± SEM; n = 6 per group in K and L; n = 3 per group in M. *p < 0.05, **p < 0.01 compared with SC control group. #p < 0.05, ##p < 0.01 compared with SC-D15A or SC-ChABC group.
Upon immunostaining for 2B6 at 2 and 12 weeks, the SC-ChABC and SC-D15A + ChABC groups showed 2B6 immunoreactivity both inside and around the graft (Figs. 4H,J, 5H,J), whereas the other groups did not (Figs. 4A,B,D,F, 5A,B,D,F). The quantification of 2B6 immunointensity confirmed the significant increase in the SC-ChABC and SC-D15A + ChABC groups compared with the SC control group at 2 (p < 0.01) and 12 weeks (p < 0.01; Fig. 5L).
The DMB assay of the transplanted spinal cord revealed that the enzymatic activity of ChABC was significantly higher in the SC-ChABC (4.8 ± 0.7 mU/μg total protein, p < 0.05) and SC-D15A + ChABC (5.6 ± 0.9 mU/μg total protein, p < 0.05) groups than in the SC control group (0.5 ± 0.4 mU/μg total protein) at 2 d after transplantation (Fig. 5M). Such increased enzymatic activity was observed until 2 weeks but disappeared by 6 weeks.
ChABC leads to irregular graft-host borders and promotes SC migration
In inmmunostaining for GFAP after transplantation, there was no striking difference in immunoreactivity inside and around the graft among the treatment groups (Figs. 3A–E, 6A–E). The quantification of GFAP immunointensity revealed no statistical differences among the groups (Fig. 6F). At the caudal edge of the graft, SCs were less confined to the graft and more astrocyte processes were observed to extend into the graft in groups with ChABC (Fig. 6D,E) than in those without (Fig. 6B,C). The numbers of transplanted SCs that migrated into the surrounding host spinal cord tissue or adjacent were significantly higher in the groups with ChABC compared with the other groups (Fig. 6G).
Figure 6.

ChABC leads to irregular graft-host borders. At higher magnification of the caudal edge of the graft, more SCs entered the host spinal cord and more astrocyte processes appeared to extend into the graft in groups with ChABC (D, E) compared with other groups (B, C). In quantifying GFAP immunointensity, there was no significant difference between the groups including the DMEM/F12 group (A, F). The number of SCs that migrated into the host spinal cord was significantly higher in the groups with ChABC (G). Data are presented as mean ± SEM; n = 5 per group. *p < 0.05, **p < 0.01 compared with SC control group. #p < 0.05 compared with SC-D15A or SC-ChABC group.
D15A increases SC-myelinated axons in the transplant
Representative images after toluidine blue staining show more dense and larger SC transplants in the SC-D15A and SC-D15A + ChABC groups (Fig. 7C,F,H,J) than in the other groups (Fig. 7B,E,G,I), which was at least in part due to there being more SC-myelinated axons in the transplant. The numbers of SC-myelinated axons were significantly higher in the SC-D15A and SC-D15A + ChABC groups than in the SC control group (p < 0.05 and p < 0.01, respectively; Fig. 7K). In addition, the SC-D15A + ChABC transplants contained a significantly higher number than the SC-ChABC groups (p < 0.05).
Figure 7.

SC myelination in the transplant is promoted by D15A. In toluidine-blue-stained, semithin sections of the transplanted spinal cord, groups with D15A showed larger and denser SC transplants (C, H) compared with the other groups (B, G); the grafts are apparent compared to the DMEM/F12 injected spinal cord (A). At higher magnifications, the groups with D15A showed an increased number of SC-myelinated axons in the transplant (F, J) compared with the other groups (E, I), as confirmed by quantitation (K). SC myelin may appear next to the SC nucleus; enabling distinguishing SC from oligodendrocyte myelin that was spared around the cord periphery. Data are presented as mean ± SEM; n = 5 per group. *p < 0.05, **p < 0.01 compared with the SC control group. #p < 0.05 compared with the SC-ChABC group.
There is a higher number of propriospinal axons in the transplant and host tissue with ChABC
The presence of propriospinal axons inside and around the transplant was evaluated using anterograde axonal tracing. In the SC control group (Fig. 8A–E), BDA-labeled axons in the rostral spinal cord were observed only occasionally to grow into the graft (Fig. 8A,B,C), into host tissue at the epicenter (Fig. 8D), or into the caudal spinal cord (Fig. 8E). However, the SC-D15A + ChABC group (Fig. 8F–J) exhibited many BDA-labeled axons in the transplant (Fig. 8G,H). This combination group showed more BDA-labeled axons within surrounding, spared host tissue at the epicenter (Fig. 8I) and in the caudal spinal cord (Fig. 8J) compared with the SC control group.
Figure 8.

ChABC leads to more propriospinal axons in the graft and host tissue. In the SC control group, an occasional BDA-labeled propriospinal axon was observed in the graft (A–D), but most did not appear to enter the graft (B). BDA-labeled fibers were rarely observed in host tissue at the epicenter (D, K) and in the caudal spinal cord (E, L). In the SC-D15A + ChABC group, many fibers grew into the graft (F–H). Labeled fibers also were observed in host tissue at the epicenter (I, K) and in the caudal spinal cord (J, L). The SC-D15A groups showed a significant increase in propriospinal axons only in the graft (K). A significant increase in axons in the SC-ChABC and SC-D15A + ChABC groups also was seen in the caudal spinal cord (L). Data are presented as mean ± SEM; n = 5 per group. *p < 0.05, **p < 0.01 compared with SC control group. #p < 0.05, ##p < 0.01 compared with the SC-D15A or SC-ChABC group.
In counting the BDA-labeled propriospinal axons in the transplant (Fig. 8K), the numbers of axons were significantly higher in the SC-D15A, SC-ChABC, and SC-D15A + ChABC groups than in the SC control group (p < 0.05, p < 0.05, and p < 0.01, respectively). The SC-D15A + ChABC group showed a significantly higher number of BDA-labeled axons in the surrounding host tissue at the epicenter than did the SC-D15A group (p < 0.01) and the SC control group (p < 0.05). At 500 μm caudal to the graft (Fig. 8L), the numbers of axons were significantly higher in the SC-ChABC and SC-D15A + ChABC groups than in the SC control group (p < 0.05 and p < 0.01, respectively)
There are more CST axons in the caudal spinal cord with D15A and ChABC
In the SC control and SC-D15A groups, BDA-labeled CST axons in the rostral spinal cord were not present close to the graft (Fig. 9A,B,J) and were rarely observed in the surrounding host tissue at the epicenter and the caudal spinal cord (Fig. 9C,D,I). In contrast, CST axons were closer to the graft in the SC-ChABC and SC-D15A + ChABC groups, although not in the graft (Fig. 9E,F,I). In the SC-D15A + ChABC group, BDA-labeled fibers were observed in surrounding host tissue at the epicenter and in the caudal spinal cord (Fig. 9G,H). The BDA-labeled fibers reached at least 500 μm beyond the caudal edge of the transplant. These tracing results were confirmed by axon counts (Fig. 9I,J).
Figure 9.

Combined D15A and ChABC leads to more CST axons in the caudal spinal cord. In the SC control group, BDA-labeled CST axons were not present close to the SC graft (A, B) and were rarely observed in host tissue (C, D). In the SC-D15A + ChABC group, labeled CST axons were present closer to the transplant rostrally (E, F) and were observed in host tissue at the epicenter (G, arrows) and in the caudal spinal cord (H, arrows). Axonal counts at the epicenter were significantly increased in the SC-ChABC and SC-D15A + ChABC groups compared with the SC control group (I). The number of CST axons in the caudal spinal cord was significantly increased in only the SC-D15A + ChABC group (J). Data are presented as mean ± SEM; n = 6 per group. *p < 0.05, **p < 0.01 compared with the SC control group. #p < 0.05, ##p < 0.01 compared with SC-D15A group.
Combination of D15A and ChABC leads to more labeled projection neurons in the brainstem after retrograde tracing
Labeling of supraspinal projection neurons in the brainstem was evaluated by placing the retrograde tracer (fast blue) caudal to the transplant, the numbers of fast-blue-labeled neuronal somata in the brainstem thereby reflecting the number of axons reaching the caudal spinal cord to take up the tracer. Figure 10 shows representative pictures of fast blue-labeled neurons in the raphe nuclei after tracing. In the SC-D15A + ChABC group (Fig. 10E), there were more labeled neurons compared with the SC control group (Fig. 10B). The SC-D15A + ChABC group showed a significantly higher number in the raphe nuclei compared with the SC control, SC-D15A, and SC-ChABC groups (p < 0.01, p < 0.05, and p < 0.01, respectively, Fig. 10G). In the reticular formation, the number of fast blue-labeled neurons in the SC-D15A + ChABC group was significantly higher than in the other groups (p < 0.01) and the number of neurons in the SC-D15A group was significantly higher than in the SC control group (p < 0.05).
Figure 10.

The combination of D15A and ChABC leads to more fast blue-labeled neurons in the brainstem after retrograde tracing. A–F, Representative pictures of fast blue-labeled neurons in the raphe nuclei show increased numbers in the SC-D15A group (C) compared with the SC control group (B); the SC-D15A + ChABC group shows a further significant increase (E; at higher magnification, F). G, In the reticular formation, the SC-D15A and SC-D15A + ChABC groups showed a significantly higher number of labeled neurons than in the SC control group. In addition, the number of labeled neurons in the SC-D15A + ChABC group was significantly higher than that in the SC-D15A and SC-ChABC groups. Data are presented as mean ± SEM; n = 7 per group. *p < 0.05, **p < 0.01 compared with SC control group. #p < 0.05, ##p < 0.01 compared with the SC-D15A or SC-ChABC group.
There is a higher number of 5-HT axons in SC grafts and the caudal spinal cord with combined D15A and ChABC
In representative images of 5-HT fiber immunostaining (Fig. 11A–F), these axons were rarely observed in the transplant, surrounding host tissue at the epicenter, or caudal spinal cord in the SC control group (Fig. 11A–C). In contrast, the SC-D15A + ChABC group showed more 5-HT-labeled fibers in all of these locations (Fig. 11D–F). Counts of 5-HT-labeled axons revealed that their total number in the graft was significantly higher in the SC-ChABC and SC-D15A + ChABC groups than in the SC control group (p < 0.05; Fig. 11G). The numbers of 5-HT axons in the SC-D15A + ChABC group were significantly higher in the caudal spinal cord (p < 0.01; Fig. 11H).
Figure 11.

Combined D15A and ChABC leads to more 5-HT-labeled axons in grafts and the caudal spinal cord. A–H, 5-HT-labeled axons were rarely observed in the SC graft (A), host tissue at the epicenter (B), or caudal spinal cord (C) in the SC control group. In contrast, the SC-D15A + ChABC group showed more 5-HT-labeled fibers in the graft (D) and the caudal spinal cord (F), as confirmed by counting (G, H). 5-HT axons also were more numerous in the transplant and in the SC-ChABC group compared with the SC control group. Data are presented as mean ± SEM; n = 7 per group. *p < 0.05, **p < 0.01 compared with SC control group. #p < 0.05, ##p < 0.01 compared with the SC-D15A or SC-ChABC group.
Combination of D15A and ChABC improves locomotor function and reduces allodynia in the hindlimbs
BBB scores and subscores were measured for 13 weeks (Fig. 12A,B). After contusion injury, all animals exhibited gross locomotor impairment, showing only joint movement for the first few days and no weight-supported stepping for the first week (BBB score <10) and partial improvement over the 13 weeks after injury. After 9 weeks, most animals displayed frequent plantar stepping without forelimb/hindlimb coordination, which appeared to plateau. Animals in the SC-D15A + ChABC group showed additional improvement at 13 weeks; 3 of 7 animals in this group exhibited consistent stepping with occasional forelimb/hindlimb coordination (BBB score ≥12), whereas no animals in the other groups reached this functional level except one animal in the SC-D15A group. At 13 weeks, the SC-D15A + ChABC group showed a higher BBB score than the SC control group (p < 0.05; Fig. 12A), although more time points would be needed to verify a persistent, gross locomotor improvement. In the BBB subscore, to further examine specific locomotor components such as paw position, toe clearance, trunk control, and tail position, the animals in the SC-D15A + ChABC group showed a significantly higher score than the SC control group at 5, 8, 11, 12, and 13 weeks (p < 0.05; Fig. 12B).
Figure 12.

Combination of D15A and ChABC improves locomotor function and reduces allodynia in the hindlimbs. A, Locomotor function assessed by BBB scoring for 13 weeks after injury. The SC-D15A + ChABC group showed a small locomotor improvement compared with the SC control group at 13 weeks. B, In the subscore, the SC-D15A + ChABC group showed a significantly better score than the control group at 5, 8, 11, 12, and 13 weeks. C–F, Catwalk data for 13 weeks after injury. G, H, Graphs showing significant improvements in mechanical and thermal sensitivity in animals receiving the combination treatment. Data are presented as mean ± SEM; n = 7 per group. **p < 0.01compared with the SC control group. ##p < 0.01 compared with SC-D15A group. †† p < 0.01 compared with SC-ChABC group.
CatWalk analysis allows the determination of the regularity index, a fractional measure for interlimb coordination (Lankhorst et al., 2001). It relates the proportion of regular step patterns to the number of steps taken. In completely coordinated rats, it is therefore 100%. At 5 weeks after SCI, the regularity index decreased to 70–85% in all groups (Fig. 12C). From 9 weeks, the SC-D15A + ChABC group showed a significantly higher percentage (better coordination) compared with all other groups (p < 0.05; Fig. 12C). The regular step patterns were categorized as described previously (Cheng et al., 1997). The most commonly observed regular step pattern in rats is the Ab pattern (order of steps: left forelimb → right hindlimb → right forelimb → left hindlimb; Hamers et al., 2006). In our animals, the major regular step pattern before injury was the Ab pattern (>95%; Fig. 12D). The percentage of Ab pattern had decreased at 5 weeks after SCI in all groups and then gradually increased until 13 weeks. From 9 weeks, the SC-D15A + ChABC group showed a significantly higher percentage of Ab pattern (improved coordination) than the SC control group (p < 0.05). Stride length and base of support were analyzed as static locomotor parameters for the hindlimbs. From 5 weeks, the SC-D15A + ChABC group showed significantly longer stride length compared with the SC control group (p < 0.05; Fig. 12E). There was no significant difference in the base of support among the groups (Fig. 12F).
Mechanical and thermal allodynia using the von Frey and Hargreaves methods, respectively, were examined. Withdrawal thresholds to mechanical stimuli were decreased in all groups after SCI and then gradually increased until 13 weeks (Fig. 12G). Animals in the SC-D15A + ChABC group demonstrated significantly higher withdrawal thresholds at 5, 9, and 13 weeks, returning to values similar to baseline, than those in the SC control and SC-D15A groups (p < 0.01). The withdrawal thresholds in the SC-ChABC group were also significantly higher and closer to baseline values compared with those in the SC control group at 5 and 9 weeks (p < 0.01). The withdrawal latencies to a heat stimulus were decreased in all groups, but animals in the SC-D15A + ChABC group exhibited significantly higher withdrawal latencies than those in all other groups at 5, 9, and 13 weeks (p < 0.01; Fig. 12H), with values being similar to those obtained at baseline.
Discussion
We demonstrate here for the first time that the combination of genetically modified, transplanted SCs secreting D15A and ChABC promotes axonal regeneration and improves function after SCI, the combination being more efficacious than either treatment alone. D15A-secreting SCs led to larger implants with more SC-myelinated axons than did control SC grafts, confirming earlier results (Golden et al., 2007). The ChABC-transduced SCs secreted biologically active enzyme after transplantation and significantly decreased CSPGs both within the graft and in the surrounding spinal cord. With SC-ChABC transplantation, the border of the implant was more irregular due to SCs emerging from the transplant. These SCs secreting ChABC led to more propriospinal and 5-HT-positive axons in the graft, more 5HT-positive and CST axons in spared host tissue around the lesion epicenter, and more propriospinal axons in tissue caudal to the graft compared with control SCs. Compared with SC-ChABC transplants, SC-ChABC + SC-D15A transplantation led to significantly more propriospinal and 5-HT-positive axons in the graft and more 5-HT-positive axons in tissue caudal to the graft. The numbers of propriospinal axons in spared host tissue at the epicenter and CST axons caudal to the lesion/graft were significantly higher only in the combination group. Furthermore, retrograde tracing revealed the presence of more labeled neurons in the raphe nuclei and reticular formation with axons projecting caudal to the lesion/graft than after SC-ChABC or SC-D15A transplantation. Finally, the combination strategy led to an improvement in locomotor function and lessened mechanical and thermal allodynia on the hindpaws compared with control groups. In sum, the highest numbers of axons were observed within the graft and in spared tissue around the graft, including caudal to the graft with the combination of SCs, D15A, and ChABC; this was the only approach that improved locomotion and sensation. These results suggest that the transplantation of genetically modified SCs to secrete neurotrophin and ChABC has significant therapeutic potential for treating SCI.
The permissivity of the interfaces between SC grafts and the contiguous spinal cord tissue is key to the success of this transplantation strategy. Both rostral and caudal interfaces need to allow ingrowth and exit of regenerating axons to cross the area of injury and enter the cord. Often, an interface appears as a sharp boundary containing GFAP antibody staining and CSPGs that are inhibitory to axonal growth. ChABC is used to diminish CSPGs to improve such growth (Bradbury and Carter, 2011). Here, the reduction of CSPGs around the SC graft with ChABC most likely enabled more axons to cross the interfaces with SCs, leaving the graft and astrocytes extending into the graft to form a more irregular host-graft interface. Such irregular borders are more permissive for axons to cross from astrocyte to SC territory (Afshari et al., 2010; Williams and Bunge, 2012). Williams et al. (2013) found a correlation between the numbers of elongated astrocyte processes and brainstem axons entering the SC graft and an improvement in hindlimb movement scores.
It has long been questioned whether, if SCs left a graft to migrate into the neighboring spinal cord, then exit of regenerated axons across the “off-ramp” would be improved. Recent studies have shown this to be true. Papastefanaki et al. (2007) improved SC migration by adding polysialic acid (PSA) to the neural cell adhesion molecule NCAM on the transplanted SC surface by introducing, by viral vector, the enzyme sialytransferase X. With the ensuing migration of SCs from the transplant after compression injury, functional recovery was improved, along with more axonal growth and enhanced myelination. A more recent study by Ghosh et al. (2012), in which PSA-SCs again were highly migratory, extended this investigation by using a clinically relevant contusion injury. PSA-overexpressing SCs supported regeneration of both CST and serotonergic fibers across the transplant and beyond its caudal edge,and improved locomotor outcome. In our results, SCs were less confined to the transplant in groups with ChABC. This finding suggested that ChABC enabled SCs to emerge from the transplant site, thereby improving the extension of descending axons into the host tissue.
Modifying CSPGs in the scar with ChABC treatment could increase the availability of endogenous neurotrophic or other protective factors in the injured spinal cord to promote neuroprotection (Crespo et al., 2007). In our study, CST axons were observed closer to the rostral aspect of the transplant with ChABC, suggestive of lessened die back (or increased sprouting) of the axons. It is likely that the CST axons observed caudal to the graft had been spared because only rarely have CST fibers extended into a SC milieu (Cheng et al., 1996). Because the more clinically relevant contusion injury instead of transection was chosen for our study, it was not possible to distinguish spared/sprouted from regenerated axons. It is likely that axons well within the graft had regenerated in the “new tissue,” one of the criteria defined by Steward et al. (2003) to distinguish between truly regenerated and spared/sprouted axons. In our results, axons in the tissue around the SC graft were likely to have been spared, suggesting that the ChABC treatment was also, at least in part, neuroprotective. It also has been reported that ChABC present at the injury site can rescue axotomized supraspinal projection neurons from atrophy, as do neurotrophic factors at the injury site (Carter et al., 2008). In our results, the combination of ChABC and D15A induced significantly more fast blue-labeled brainstem neurons than only D15A. These findings could suggest that a neuroprotective effect of ChABC led to the higher number of brainstem neurons, although the presence of ChABC could have caused increased permissivity of the interfaces for regenerating axons.
Recent studies have shown that CSPGs interact with the transmembrane receptor protein tyrosine phosphatase σ in axons and inhibit their growth in the injured spinal cord (Shen et al., 2009; Fry et al., 2010), an interaction abolished by ChABC treatment (Shen et al., 2009). ChABC is known to induce CST sprouting (Barritt et al., 2006; Houle et al., 2006). A previous study showed that ChABC administration enhanced regeneration of transected propriospinal axons after SCI and, importantly, allowed them to grow across the caudal SC/spinal cord interface (Chau et al., 2004). In this case, modification of the scar led to further axonal regrowth in the spinal cord beyond the SC bridge. Our results suggested that ChABC promoted regrowth of 5-HT-positive and propriospinal axons in the SC graft, although, again, improved interface permissivity could have been a factor. In sum, the overall outcomes that we have documented here may have resulted from a combination of axonal regeneration, sprouting, and neuroprotection (including reduced die back), all of which have been implicated in repair after provision of ChABC (Bradbury and Carter, 2011). Analysis to compare neuroprotection of the spared white matter among the experimental groups was found not to be feasible because the graft/white matter interfaces were not distinct enough in the ChABC-treated animals.
Although the combination strategy improved function, additional factors may have precluded greater improvement. ChABC treatment will not reduce other inhibitory ligands such as semaphorins, ephrins, NoGo, OMpg, and MAG. In addition, the higher concentration of neurotrophin in the implant than in the surrounding host tissue may prevent axons from leaving the transplant. A study of ascending axons revealed that they left an NT-3-containing transplant only when NT-3 was present rostral to the transplant and only if the gradient of NT-3 was continuous with the transplant; any break in the NT-3 gradient from the transplant resulted in failure of axons to extend into the host tissue (Taylor et al., 2006). Therefore, a trail of neurotrophin was needed for regrowing axons to extend into the cord from the transplant. It should be noted that Taylor et al. (2006) achieved exit of axons from the transplant without the additional treatment of ChABC. We submit that neurotrophin gradients and modification of the graft/spinal cord interfaces will be among the essential components of a successful SC combination therapy.
The combination strategy significantly improved locomotor function and mechanical and thermal allodynia on the hindpaws. The combination treatment group demonstrated more obvious locomotor improvement in Catwalk parameters than in the BBB score. Previous studies have suggested that BBB scoring may be somewhat subjective, so it would be difficult to achieve a reliable assessment of interlimb coordination (Basso, 2004; Hamers et al., 2006), whereas the Catwalk may allow a more objective analysis of this coordination (Hamers et al., 2001; Deumens et al., 2007). The advantage of the Catwalk analysis in our studies was clarification of the significant locomotor improvement in the combination treatment group.
Previous reports showed that specific parameters in locomotor assessment were affected by mechanical allodynia in the limb (Vrinten and Hamers, 2003; Gabriel et al., 2007). The pain-induced gait change reflects, at least in part, the results in the BBB scoring and in the Catwalk. It was also suggested that paw withdrawal responses to mechanical stimulation were influenced by not only allodynia, but also by recovery of motor function in the hindlimb (Detloff et al., 2010). Therefore, our behavioral data would result from reciprocal influences of the locomotor and sensory conditions in the hindlimb.
Conclusion
The goal of this experimentation was to improve function after contusion injury by increasing axons in the SC graft and modifying the caudal interface to enable exit of axons from the graft with a combination of transplanted SCs with the provision of neurotrophin and ChABC. This combination of ChABC and D15A led to the following: (1) increased numbers of SCs and SC-myelinated axons in the graft; (2) increased propriospinal axons in the graft and surrounding host tissue; (3) more CST axons closer to the transplant and around it, including caudally; (4) more axons from supraspinal projection neurons in the brainstem present caudal to the transplant; (5) increased serotonergic fibers in the transplant and caudal to it; (6) improvement in aspects of locomotion; and (7) lessened mechanical and thermal hindpaw allodynia. The combination was more efficacious than SCs plus D15A or ChABC. This study is the first to demonstrate a successful SC-based combinatorial strategy with ChABC and neurotrophin for the treatment of SCI. These findings point to the clinical application of genetically modified, autologous SC transplantation for spinal-cord-injured persons.
Footnotes
This work was supported by the National Institutes of Health (Grant 09923 to M.B.B. and Grant 056281 to D.D.P.), the Miami Project to Cure Paralysis and the Buoniconti Fund (to M.B.B.), and the Uehara Memorial Foundation (Research Fellowship Grant 2010 to H.K.). We thank Dr. Dalton Dietrich for arranging H.K.'s visit at the Miami Project, the Animal Core of the Miami Project for help with animal care, the Viral Vector Core for expanding virus, the Imaging Core for help with confocal microscopy, and Acorda Therapeutics for suggesting the DMB assay.
The authors declare no competing financial interests.
References
- Afshari FT, Kwok JC, White L, Fawcett JW. Schwann cell migration is integrin-dependent and inhibited by astrocyte-produced aggrecan. Glia. 2010;58:857–869. doi: 10.1002/glia.20970. [DOI] [PubMed] [Google Scholar]
- Barakat DJ, Gaglani SM, Neravetla SR, Sanchez AR, Andrade CM, Pressman Y, Puzis R, Garg MS, Bunge MB, Pearse DD. Survival, integration, and axon growth support of glia transplanted into the chronically contused spinal cord. Cell Transplant. 2005;14:225–240. doi: 10.3727/000000005783983106. [DOI] [PubMed] [Google Scholar]
- Barritt AW, Davies M, Marchand F, Hartley R, Grist J, Yip P, McMahon SB, Bradbury EJ. Chondroitinase ABC promotes sprouting of intact and injured spinal systems after spinal cord injury. J Neurosci. 2006;26:10856–10867. doi: 10.1523/JNEUROSCI.2980-06.2006. [DOI] [PMC free article] [PubMed] [Google Scholar]
- Basso DM. Behavioral testing after spinal cord injury: congruities, complexities, and controversies. J Neurotrauma. 2004;21:395–404. doi: 10.1089/089771504323004548. [DOI] [PubMed] [Google Scholar]
- Basso DM, Beattie MS, Bresnahan JC. A sensitive and reliable locomotor rating scale for open field testing in rats. J Neurotrauma. 1995;12:1–21. doi: 10.1089/neu.1995.12.1. [DOI] [PubMed] [Google Scholar]
- Biernaskie J, Sparling JS, Liu J, Shannon CP, Plemel JR, Xie Y, Miller FD, Tetzlaff W. Skin-derived precursors generate myelinating Schwann cells that promote remyelination and functional recovery after contusion spinal cord injury. J Neurosci. 2007;27:9545–9559. doi: 10.1523/JNEUROSCI.1930-07.2007. [DOI] [PMC free article] [PubMed] [Google Scholar]
- Blits B, Kitay BM, Farahvar A, Caperton CV, Dietrich WD, Bunge MB. Lentiviral vector-mediated transduction of neural progenitor cells before implantation into injured spinal cord and brain to detect their migration, deliver neurotrophic factors and repair tissue. Restor Neurol Neurosci. 2005;23:313–324. [PubMed] [Google Scholar]
- Bradbury EJ, Carter LM. Manipulating the glial scar: chondroitinase ABC as a therapy for spinal cord injury. Brain Res Bull. 2011;84:306–316. doi: 10.1016/j.brainresbull.2010.06.015. [DOI] [PubMed] [Google Scholar]
- Bradbury EJ, Moon LD, Popat RJ, King VR, Bennett GS, Patel PN, Fawcett JW, McMahon SB. Chondroitinase ABC promotes functional recovery after spinal cord injury. Nature. 2002;416:636–640. doi: 10.1038/416636a. [DOI] [PubMed] [Google Scholar]
- Bunge MB. Novel combination strategies to repair the injured mammalian spinal cord. J Spinal Cord Med. 2008;31:262–269. doi: 10.1080/10790268.2008.11760720. [DOI] [PMC free article] [PubMed] [Google Scholar]
- Bunge MB, Pearse DD. Transplantation strategies to promote repair of the injured spinal cord. J Rehabil Res Dev. 2003;40:55–62. doi: 10.1682/JRRD.2003.08.0055. [DOI] [PubMed] [Google Scholar]
- Bunge MB, Wood PM. Realizing the maximum potential of Schwann cells to promote recovery from spinal cord injury. Handb Clin Neurol. 2012;109:523–540. doi: 10.1016/B978-0-444-52137-8.00032-2. [DOI] [PubMed] [Google Scholar]
- Bunge MB, Holets VR, Bates ML, Clarke TS, Watson BD. Characterization of photochemically induced spinal cord injury in the rat by light and electron microscopy. Exp Neurol. 1994;127:76–93. doi: 10.1006/exnr.1994.1082. [DOI] [PubMed] [Google Scholar]
- Cafferty WB, Yang SH, Duffy PJ, Li S, Strittmatter SM. Functional axonal regeneration through astrocytic scar genetically modified to digest chondroitin sulfate proteoglycans. J Neurosci. 2007;27:2176–2185. doi: 10.1523/JNEUROSCI.5176-06.2007. [DOI] [PMC free article] [PubMed] [Google Scholar]
- Cao Q, Xu XM, Devries WH, Enzmann GU, Ping P, Tsoulfas P, Wood PM, Bunge MB, Whittemore SR. Functional recovery in traumatic spinal cord injury after transplantation of multineurotrophin-expressing glial-restricted precursor cells. J Neurosci. 2005;25:6947–6957. doi: 10.1523/JNEUROSCI.1065-05.2005. [DOI] [PMC free article] [PubMed] [Google Scholar]
- Carter LM, Starkey ML, Akrimi SF, Davies M, McMahon SB, Bradbury EJ. The yellow fluorescent protein (YFP-H) mouse reveals neuroprotection as a novel mechanism underlying chondroitinase ABC-mediated repair after spinal cord injury. J Neurosci. 2008;28:14107–14120. doi: 10.1523/JNEUROSCI.2217-08.2008. [DOI] [PMC free article] [PubMed] [Google Scholar]
- Carter LM, McMahon SB, Bradbury EJ. Delayed treatment with chondroitinase ABC reverses chronic atrophy of rubrospinal neurons following spinal cord injury. Exp Neurol. 2011;228:149–156. doi: 10.1016/j.expneurol.2010.12.023. [DOI] [PubMed] [Google Scholar]
- Chaplan SR, Bach FW, Pogrel JW, Chung JM, Yaksh TL. Quantitative assessment of tactile allodynia in the rat paw. J Neurosci Methods. 1994;53:55–63. doi: 10.1016/0165-0270(94)90144-9. [DOI] [PubMed] [Google Scholar]
- Chau CH, Shum DK, Li H, Pei J, Lui YY, Wirthlin L, Chan YS, Xu XM. Chondroitinase ABC enhances axonal regrowth through Schwann cell-seeded guidance channels after spinal cord injury. FASEB J. 2004;18:194–196. doi: 10.1096/fj.03-0196fje. [DOI] [PubMed] [Google Scholar]
- Cheng H, Cao Y, Olson L. Spinal cord repair in adult paraplegic rats: partial restoration of hind limb function. Science. 1996;273:510–513. doi: 10.1126/science.273.5274.510. [DOI] [PubMed] [Google Scholar]
- Cheng H, Almström S, Giménez-Llort L, Chang R, Ove Ogren S, Hoffer B, Olson L. Gait analysis of adult paraplegic rats after spinal cord repair. Exp Neurol. 1997;148:544–557. doi: 10.1006/exnr.1997.6708. [DOI] [PubMed] [Google Scholar]
- Crespo D, Asher RA, Lin R, Rhodes KE, Fawcett JW. How does chondroitinase promote functional recovery in the damaged CNS? Exp Neurol. 2007;206:159–171. doi: 10.1016/j.expneurol.2007.05.001. [DOI] [PubMed] [Google Scholar]
- Detloff MR, Clark LM, Hutchinson KJ, Kloos AD, Fisher LC, Basso DM. Validity of acute and chronic tactile sensory testing after spinal cord injury in rats. Exp Neurol. 2010;225:366–376. doi: 10.1016/j.expneurol.2010.07.009. [DOI] [PMC free article] [PubMed] [Google Scholar]
- Deumens R, Jaken RJ, Marcus MA, Joosten EA. The CatWalk gait analysis in assessment of both dynamic and static gait changes after adult rat sciatic nerve resection. J Neurosci Methods. 2007;164:120–130. doi: 10.1016/j.jneumeth.2007.04.009. [DOI] [PubMed] [Google Scholar]
- Drury JA, Nik H, van Oppenraaij RH, Tang AW, Turner MA, Quenby S. Endometrial cell counts in recurrent miscarriage: a comparison of counting methods. Histopathology. 2011;59:1156–1162. doi: 10.1111/j.1365-2559.2011.04046.x. [DOI] [PubMed] [Google Scholar]
- Ettenson DS, Koo EW, Januzzi JL, Edelman ER. Endothelial heparan sulfate is necessary but not sufficient for control of vascular smooth muscle cell growth. J Cell Physiol. 2000;184:93–100. doi: 10.1002/(SICI)1097-4652(200007)184:1<93::AID-JCP10>3.0.CO;2-H. [DOI] [PubMed] [Google Scholar]
- Farndale RW, Sayers CA, Barrett AJ. A direct spectrophotometric microassay for sulfated glycosaminoglycans in cartilage cultures. Connect Tissue Res. 1982;9:247–248. doi: 10.3109/03008208209160269. [DOI] [PubMed] [Google Scholar]
- Fawcett JW, Asher RA. The glial scar and central nervous system repair. Brain Res Bull. 1999;49:377–391. doi: 10.1016/S0361-9230(99)00072-6. [DOI] [PubMed] [Google Scholar]
- Follenzi A, Naldini L. Generation of HIV-1 derived lentiviral vectors. Methods Enzymol. 2002;346:454–465. doi: 10.1016/s0076-6879(02)46071-5. [DOI] [PubMed] [Google Scholar]
- Follenzi A, Ailles LE, Bakovic S, Geuna M, Naldini L. Gene transfer by lentiviral vectors is limited by nuclear translocation and rescued by HIV-1 pol sequences. Nat Genet. 2000;25:217–222. doi: 10.1038/76095. [DOI] [PubMed] [Google Scholar]
- Fortun J, Hill CE, Bunge MB. Combinatorial strategies with Schwann cell transplantation to improve repair of the injured spinal cord. Neurosci Lett. 2009;456:124–132. doi: 10.1016/j.neulet.2008.08.092. [DOI] [PMC free article] [PubMed] [Google Scholar]
- Fouad K, Schnell L, Bunge MB, Schwab ME, Liebscher T, Pearse DD. Combining Schwann cell bridges and olfactory-ensheathing glia grafts with chondroitinase promotes locomotor recovery after complete transection of the spinal cord. J Neurosci. 2005;25:1169–1178. doi: 10.1523/JNEUROSCI.3562-04.2005. [DOI] [PMC free article] [PubMed] [Google Scholar]
- Fry EJ, Chagnon MJ, López-Vales R, Tremblay ML, David S. Corticospinal tract regeneration after spinal cord injury in receptor protein tyrosine phosphatase sigma deficient mice. Glia. 2010;58:423–433. doi: 10.1002/glia.20934. [DOI] [PubMed] [Google Scholar]
- Gabriel AF, Marcus MA, Honig WM, Walenkamp GH, Joosten EA. The CatWalk method: a detailed analysis of behavioral changes after acute inflammatory pain in the rat. J Neurosci Methods. 2007;163:9–16. doi: 10.1016/j.jneumeth.2007.02.003. [DOI] [PubMed] [Google Scholar]
- Ghosh M, Tuesta LM, Puentes R, Patel S, Melendez K, El Maarouf A, Rutishauser U, Pearse DD. Extensive cell migration, axon regeneration, and improved function with polysialic acid-modified Schwann cells after spinal cord injury. Glia. 2012;60:979–992. doi: 10.1002/glia.22330. [DOI] [PMC free article] [PubMed] [Google Scholar]
- Golden KL, Pearse DD, Blits B, Garg MS, Oudega M, Wood PM, Bunge MB. Transduced Schwann cells promote axon growth and myelination after spinal cord injury. Exp Neurol. 2007;207:203–217. doi: 10.1016/j.expneurol.2007.06.023. [DOI] [PMC free article] [PubMed] [Google Scholar]
- Gruner JA. A monitored contusion model of spinal cord injury in the rat. J Neurotrauma. 1992;9:123–126. doi: 10.1089/neu.1992.9.123. discussion 126–128. [DOI] [PubMed] [Google Scholar]
- Hama A, Sagen J. Antinociceptive effect of riluzole in rats with neuropathic spinal cord injury pain. J Neurotrauma. 2011;28:127–134. doi: 10.1089/neu.2010.1539. [DOI] [PubMed] [Google Scholar]
- Hama AT, Plum AW, Sagen J. Antinociceptive effect of ambroxol in rats with neuropathic spinal cord injury pain. Pharmacol Biochem Behav. 2010;97:249–255. doi: 10.1016/j.pbb.2010.08.006. [DOI] [PMC free article] [PubMed] [Google Scholar]
- Hamers FP, Lankhorst AJ, van Laar TJ, Veldhuis WB, Gispen WH. Automated quantitative gait analysis during overground locomotion in the rat: its application to spinal cord contusion and transection injuries. J Neurotrauma. 2001;18:187–201. doi: 10.1089/08977150150502613. [DOI] [PubMed] [Google Scholar]
- Hamers FP, Koopmans GC, Joosten EA. CatWalk-assisted gait analysis in the assessment of spinal cord injury. J Neurotrauma. 2006;23:537–548. doi: 10.1089/neu.2006.23.537. [DOI] [PubMed] [Google Scholar]
- Hargreaves K, Dubner R, Brown F, Flores C, Joris J. A new and sensitive method for measuring thermal nociception in cutaneous hyperalgesia. Pain. 1988;32:77–88. doi: 10.1016/0304-3959(88)90026-7. [DOI] [PubMed] [Google Scholar]
- Hendriks WT, Eggers R, Verhaagen J, Boer GJ. Gene transfer to the spinal cord neural scar with lentiviral vectors: predominant transgene expression in astrocytes but not in meningeal cells. J Neurosci Res. 2007;85:3041–3052. doi: 10.1002/jnr.21432. [DOI] [PubMed] [Google Scholar]
- Hill CE, Beattie MS, Bresnahan JC. Degeneration and sprouting of identified descending supraspinal axons after contusive spinal cord injury in the rat. Exp Neurol. 2001;171:153–169. doi: 10.1006/exnr.2001.7734. [DOI] [PubMed] [Google Scholar]
- Hill CE, Hurtado A, Blits B, Bahr BA, Wood PM, Bartlett Bunge M, Oudega M. Early necrosis and apoptosis of Schwann cells transplanted into the injured rat spinal cord. Eur J Neurosci. 2007;26:1433–1445. doi: 10.1111/j.1460-9568.2007.05771.x. [DOI] [PubMed] [Google Scholar]
- Houle JD, Tom VJ, Mayes D, Wagoner G, Phillips N, Silver J. Combining an autologous peripheral nervous system “bridge” and matrix modification by chondroitinase allows robust, functional regeneration beyond a hemisection lesion of the adult rat spinal cord. J Neurosci. 2006;26:7405–7415. doi: 10.1523/JNEUROSCI.1166-06.2006. [DOI] [PMC free article] [PubMed] [Google Scholar]
- Iannotti C, Li H, Yan P, Lu X, Wirthlin L, Xu XM. Glial cell line-derived neurotrophic factor-enriched bridging transplants promote propriospinal axonal regeneration and enhance myelination after spinal cord injury. Exp Neurol. 2003;183:379–393. doi: 10.1016/S0014-4886(03)00188-2. [DOI] [PubMed] [Google Scholar]
- Jones LL, Margolis RU, Tuszynski MH. The chondroitin sulfate proteoglycans neurocan, brevican, phosphacan, and versican are differentially regulated following spinal cord injury. Exp Neurol. 2003;182:399–411. doi: 10.1016/S0014-4886(03)00087-6. [DOI] [PubMed] [Google Scholar]
- Joosten EA, Veldhuis WB, Hamers FP. Collagen containing neonatal astrocytes stimulates regrowth of injured fibers and promotes modest locomotor recovery after spinal cord injury. J Neurosci Res. 2004;77:127–142. doi: 10.1002/jnr.20088. [DOI] [PubMed] [Google Scholar]
- Karimi-Abdolrezaee S, Eftekharpour E, Wang J, Schut D, Fehlings MG. Synergistic effects of transplanted adult neural stem/progenitor cells, chondroitinase, and growth factors promote functional repair and plasticity of the chronically injured spinal cord. J Neurosci. 2010;30:1657–1676. doi: 10.1523/JNEUROSCI.3111-09.2010. [DOI] [PMC free article] [PubMed] [Google Scholar]
- Koopmans GC, Deumens R, Honig WM, Hamers FP, Steinbusch HW, Joosten EA. The assessment of locomotor function in spinal cord injured rats: the importance of objective analysis of coordination. J Neurotrauma. 2005;22:214–225. doi: 10.1089/neu.2005.22.214. [DOI] [PubMed] [Google Scholar]
- Lankhorst AJ, ter Laak MP, van Laar TJ, van Meeteren NL, de Groot JC, Schrama LH, Hamers FP, Gispen WH. Effects of enriched housing on functional recovery after spinal cord contusive injury in the adult rat. J Neurotrauma. 2001;18:203–215. doi: 10.1089/08977150150502622. [DOI] [PubMed] [Google Scholar]
- Lemons ML, Howland DR, Anderson DK. Chondroitin sulfate proteoglycan immunoreactivity increases following spinal cord injury and transplantation. Exp Neurol. 1999;160:51–65. doi: 10.1006/exnr.1999.7184. [DOI] [PubMed] [Google Scholar]
- Levi AD, Bunge RP, Lofgren JA, Meima L, Hefti F, Nikolics K, Sliwkowski MX. The influence of heregulins on human Schwann cell proliferation. J Neurosci. 1995;15:1329–1340. doi: 10.1523/JNEUROSCI.15-02-01329.1995. [DOI] [PMC free article] [PubMed] [Google Scholar]
- Liu T, Xu J, Chan BP, Chew SY. Sustained release of neurotrophin-3 and chondroitinase ABC from electrospun collagen nanofiber scaffold for spinal cord injury repair. J Biomed Mater Res A. 2012;100:236–242. doi: 10.1002/jbm.a.33271. [DOI] [PubMed] [Google Scholar]
- Lo TP, Jr, Cho KS, Garg MS, Lynch MP, Marcillo AE, Koivisto DL, Stagg M, Abril RM, Patel S, Dietrich WD, Pearse DD. Systemic hypothermia improves histological and functional outcome after cervical spinal cord contusion in rats. J Comp Neurol. 2009;514:433–448. doi: 10.1002/cne.22014. [DOI] [PubMed] [Google Scholar]
- Massey JM, Amps J, Viapiano MS, Matthews RT, Wagoner MR, Whitaker CM, Alilain W, Yonkof AL, Khalyfa A, Cooper NG, Silver J, Onifer SM. Increased chondroitin sulfate proteoglycan expression in denervated brainstem targets following spinal cord injury creates a barrier to axonal regeneration overcome by chondroitinase ABC and neurotrophin-3. Exp Neurol. 2008;209:426–445. doi: 10.1016/j.expneurol.2007.03.029. [DOI] [PMC free article] [PubMed] [Google Scholar]
- Meijs MF, Timmers L, Pearse DD, Tresco PA, Bates ML, Joosten EA, Bunge MB, Oudega M. Basic fibroblast growth factor promotes neuronal survival but not behavioral recovery in the transected and Schwann cell implanted rat thoracic spinal cord. J Neurotrauma. 2004;21:1415–1430. doi: 10.1089/neu.2004.21.1415. [DOI] [PubMed] [Google Scholar]
- Moon LD, Asher RA, Rhodes KE, Fawcett JW. Relationship between sprouting axons, proteoglycans and glial cells following unilateral nigrostriatal axotomy in the adult rat. Neuroscience. 2002;109:101–117. doi: 10.1016/S0306-4522(01)00457-2. [DOI] [PubMed] [Google Scholar]
- Morgenstern DA, Asher RA, Fawcett JW. Chondroitin sulphate proteoglycans in the CNS injury response. Prog Brain Res. 2002;137:313–332. doi: 10.1016/S0079-6123(02)37024-9. [DOI] [PubMed] [Google Scholar]
- Morrissey TK, Kleitman N, Bunge RP. Isolation and functional characterization of Schwann cells derived from adult peripheral nerve. J Neurosci. 1991;11:2433–2442. doi: 10.1523/JNEUROSCI.11-08-02433.1991. [DOI] [PMC free article] [PubMed] [Google Scholar]
- Muir EM, Fyfe I, Gardiner S, Li L, Warren P, Fawcett JW, Keynes RJ, Rogers JH. Modification of N-glycosylation sites allows secretion of bacterial chondroitinase ABC from mammalian cells. J Biotechnol. 2010;145:103–110. doi: 10.1016/j.jbiotec.2009.11.002. [DOI] [PMC free article] [PubMed] [Google Scholar]
- Murray PD, McGavern DB, Sathornsumetee S, Rodriguez M. Spontaneous remyelination following extensive demyelination is associated with improved neurological function in a viral model of multiple sclerosis. Brain. 2001;124:1403–1416. doi: 10.1093/brain/124.7.1403. [DOI] [PMC free article] [PubMed] [Google Scholar]
- Oudega M, Varon S, Hagg T. Regeneration of adult rat sensory axons into intraspinal nerve grafts: promoting effects of conditioning lesion and graft predegeneration. Exp Neurol. 1994;129:194–206. doi: 10.1006/exnr.1994.1161. [DOI] [PubMed] [Google Scholar]
- Papastefanaki F, Chen J, Lavdas AA, Thomaidou D, Schachner M, Matsas R. Grafts of Schwann cells engineered to express PSA-NCAM promote functional recovery after spinal cord injury. Brain. 2007;130:2159–2174. doi: 10.1093/brain/awm155. [DOI] [PubMed] [Google Scholar]
- Patel V, Joseph G, Patel A, Patel S, Bustin D, Mawson D, Tuesta LM, Puentes R, Ghosh M, Pearse DD. Suspension matrices for improved Schwann-cell survival after implantation into the injured rat spinal cord. J Neurotrauma. 2010;27:789–801. doi: 10.1089/neu.2008.0809. [DOI] [PMC free article] [PubMed] [Google Scholar]
- Paxinos G, Watson C. The rat brain in stereotaxic coordinates. Ed 4. Sydney: Academic; 1998. [DOI] [PubMed] [Google Scholar]
- Pearse DD, Pereira FC, Marcillo AE, Bates ML, Berrocal YA, Filbin MT, Bunge MB. cAMP and Schwann cells promote axonal growth and functional recovery after spinal cord injury. Nat Med. 2004;10:610–616. doi: 10.1038/nm1056. [DOI] [PubMed] [Google Scholar]
- Pearse DD, Sanchez AR, Pereira FC, Andrade CM, Puzis R, Pressman Y, Golden K, Kitay BM, Blits B, Wood PM, Bunge MB. Transplantation of Schwann cells and/or olfactory ensheathing glia into the contused spinal cord: Survival, migration, axon association, and functional recovery. Glia. 2007;55:976–1000. doi: 10.1002/glia.20490. [DOI] [PubMed] [Google Scholar]
- Petryniak MA, Potter GB, Rowitch DH, Rubenstein JL. Dlx1 and Dlx2 control neuronal versus oligodendroglial cell fate acquisition in the developing forebrain. Neuron. 2007;55:417–433. doi: 10.1016/j.neuron.2007.06.036. [DOI] [PMC free article] [PubMed] [Google Scholar]
- Plant GW, Bates ML, Bunge MB. Inhibitory proteoglycan immunoreactivity is higher at the caudal than the rostral Schwann cell graft-transected spinal cord interface. Mol Cell Neurosci. 2001;17:471–487. doi: 10.1006/mcne.2000.0948. [DOI] [PubMed] [Google Scholar]
- Rutkowski JL, Kirk CJ, Lerner MA, Tennekoon GI. Purification and expansion of human Schwann cells in vitro. Nat Med. 1995;1:80–83. doi: 10.1038/nm0195-80. [DOI] [PubMed] [Google Scholar]
- Schwab ME, Bartholdi D. Degeneration and regeneration of axons in the lesioned spinal cord. Physiol Rev. 1996;76:319–370. doi: 10.1152/physrev.1996.76.2.319. [DOI] [PubMed] [Google Scholar]
- Shen Y, Tenney AP, Busch SA, Horn KP, Cuascut FX, Liu K, He Z, Silver J, Flanagan JG. PTPsigma is a receptor for chondroitin sulfate proteoglycan, an inhibitor of neural regeneration. Science. 2009;326:592–596. doi: 10.1126/science.1178310. [DOI] [PMC free article] [PubMed] [Google Scholar]
- Silver J, Miller JH. Regeneration beyond the glial scar. Nat Rev Neurosci. 2004;5:146–156. doi: 10.1038/nrn1326. [DOI] [PubMed] [Google Scholar]
- Steward O, Zheng B, Tessier-Lavigne M. False resurrections: distinguishing regenerated from spared axons in the injured central nervous system. J Comp Neurol. 2003;459:1–8. doi: 10.1002/cne.10593. [DOI] [PubMed] [Google Scholar]
- Takami T, Oudega M, Bates ML, Wood PM, Kleitman N, Bunge MB. Schwann cell but not olfactory ensheathing glia transplants improve hindlimb locomotor performance in the moderately contused adult rat thoracic spinal cord. J Neurosci. 2002;22:6670–6681. doi: 10.1523/JNEUROSCI.22-15-06670.2002. [DOI] [PMC free article] [PubMed] [Google Scholar]
- Tang X, Davies JE, Davies SJ. Changes in distribution, cell associations, and protein expression levels of NG2, neurocan, phosphacan, brevican, versican V2, and tenascin-C during acute to chronic maturation of spinal cord scar tissue. J Neurosci Res. 2003;71:427–444. doi: 10.1002/jnr.10523. [DOI] [PubMed] [Google Scholar]
- Taylor L, Jones L, Tuszynski MH, Blesch A. Neurotrophin-3 gradients established by lentiviral gene delivery promote short-distance axonal bridging beyond cellular grafts in the injured spinal cord. J Neurosci. 2006;26:9713–9721. doi: 10.1523/JNEUROSCI.0734-06.2006. [DOI] [PMC free article] [PubMed] [Google Scholar]
- Tetzlaff W, Okon EB, Karimi-Abdolrezaee S, Hill CE, Sparling JS, Plemel JR, Plunet WT, Tsai EC, Baptiste D, Smithson LJ, Kawaja MD, Fehlings MG, Kwon BK. A systematic review of cellular transplantation therapies for spinal cord injury. J Neurotrauma. 2011;28:1611–1682. doi: 10.1089/neu.2009.1177. [DOI] [PMC free article] [PubMed] [Google Scholar]
- Urfer R, Tsoulfas P, Soppet D, Escandón E, Parada LF, Presta LG. The binding epitopes of neurotrophin-3 to its receptors trkC and gp75 and the design of a multifunctional human neurotrophin. EMBO J. 1994;13:5896–5909. doi: 10.1002/j.1460-2075.1994.tb06935.x. [DOI] [PMC free article] [PubMed] [Google Scholar]
- Vrinten DH, Hamers FF. ‘CatWalk’ automated quantitative gait analysis as a novel method to assess mechanical allodynia in the rat; a comparison with von Frey testing. Pain. 2003;102:203–209. doi: 10.1016/s0304-3959(02)00382-2. [DOI] [PubMed] [Google Scholar]
- Williams RR, Bunge MB. Schwann cell transplantation: A repair strategy for spinal cord injury? Prog Brain Res. 2012;201:295–312. doi: 10.1016/B978-0-444-59544-7.00014-7. [DOI] [PubMed] [Google Scholar]
- Williams RR, Henao M, Pearse DD, Bunge MB. Permissive Schwann cell graft/spinal cord interfaces for axon regeneration. Cell Transplant. 2013 doi: 10.3727/096368913X674657. Advance online publication. Retrieved Jan. 6, 2014. [DOI] [PMC free article] [PubMed] [Google Scholar]
- Xu XM, Guénard V, Kleitman N, Bunge MB. Axonal regeneration into Schwann cell-seeded guidance channels grafted into transected adult rat spinal cord. J Comp Neurol. 1995;351:145–160. doi: 10.1002/cne.903510113. [DOI] [PubMed] [Google Scholar]
- Xu XM, Chen A, Guénard V, Kleitman N, Bunge MB. Bridging Schwann cell transplants promote axonal regeneration from both the rostral and caudal stumps of transected adult rat spinal cord. J Neurocytol. 1997;26:1–16. doi: 10.1023/A:1018557923309. [DOI] [PubMed] [Google Scholar]
- Xu XM, Zhang SX, Li H, Aebischer P, Bunge MB. Regrowth of axons into the distal spinal cord through a Schwann-cell-seeded mini-channel implanted into hemisected adult rat spinal cord. Eur J Neurosci. 1999;11:1723–1740. doi: 10.1046/j.1460-9568.1999.00591.x. [DOI] [PubMed] [Google Scholar]
- Ying Z, Roy RR, Edgerton VR, Gómez-Pinilla F. Voluntary exercise increases neurotrophin-3 and its receptor TrkC in the spinal cord. Brain Res. 2003;987:93–99. doi: 10.1016/S0006-8993(03)03258-X. [DOI] [PubMed] [Google Scholar]
- Zhao RR, Muir EM, Alves JN, Rickman H, Allan AY, Kwok JC, Roet KC, Verhaagen J, Schneider BL, Bensadoun JC, Ahmed SG, Yáñez-Muñoz RJ, Keynes RJ, Fawcett JW, Rogers JH. Lentiviral vectors express chondroitinase ABC in cortical projections and promote sprouting of injured corticospinal axons. J Neurosci Methods. 2011;201:228–238. doi: 10.1016/j.jneumeth.2011.08.003. [DOI] [PMC free article] [PubMed] [Google Scholar]