

Abstract
Aim
The present study was designed to investigate whether the three-apolipoprotein (AI, B, E) gene polymorphisms were related to alter their plasma protein levels and hence associated to coronary artery disease (CAD).
Methods
We determined distribution of MspI apo AI, EcoRI apo B, HhaI apo E gene polymorphisms, plasma apolipoproteins and lipids levels among 150 patients having CAD admitted to the Department of Cardiology, N.R.S. Medical College & Hospital, Kolkata, India during June 2010–June 2012 and 150 age sex matched healthy controls.
Results
We found that ApoAI concentration of studied population was significantly different in each genotypes of −75 G/A apo AI (p < 0.0001) gene polymorphism. A significant association was found in multivariate analysis for the genotypes with apo E4 allele [odds ratio (OR): 3.639; 95% confidence interval (CI): 1.019–12.995, p = 0.040] with four conventional risk factors (i.e. smoking, low-density lipoprotein, ApoAI and ApoB) with CAD. In contrast E2 allele has reverse effect, but the genotypes with apo E2 allele was no longer significant in the multivariate model (OR: 1.788; 95% CI: 0.400–8.001, p = 0.447) where as being significant in univariate analysis (OR: 0.219; 95% CI: 0.087–0.552, p = 0.001).
Conclusions
Our findings suggest that the polymorphisms apo AI MspI and apo B EcoRI do not seem to affect CAD. But the genotype with E4 allele of apo E gene independent of other risk factors is associated with this disease.
Keywords: Apolipoprotein, Gene polymorphism, CAD, Allele frequency
1. Introduction
The high tendency to develop premature and accelerated CAD in Asian Indians is only partially explained by the presence of conventional risk factors such as insulin resistance, abdominal obesity and dyslipidemia.1 Consistently high prevalence of premature CAD in Asian Indians settled in widely different geographical locations, despite having varied dietary and lifestyle profiles, suggests a prominent role for genetic factor(s).2 During the past 20 years, India has experienced remarkable socioeconomic development, with the mean income increasing by several folds. Consequently, the lifestyle of people throughout the country has changed dramatically. The nutritional variations have led to increased intake of fat and cholesterol contents, which has gradually increased serum lipid levels. Disorders of lipid metabolism such as elevated serum levels of total cholesterol (TC),3 triglycerides (TGs),4 low-density lipoprotein cholesterol (LDL-c),5 apolipoprotein (Apo) B,6 or low levels of high-density lipoprotein cholesterol (HDL-c) and ApoAI7 have been considered to be important risk factors in the pathogenesis of atherosclerosis and coronary artery disease (CAD),8 whereas the influence of ApoE on serum lipid levels is often suggested to have major implications for the risk of CAD.9
The protective effect of HDL-c and ApoAI on the risk of CAD is mediated mainly through the promotion of cholesterol efflux from peripheral cells.10 In addition, both HDL-c and ApoAI may have antioxidant, antithrombotic, and anti-inflammatory properties, which could have important antiatherogenic effects.10 The apo AI gene is localized on chromosomal region 11q23 and is a member of the apolipoprotein multigene superfamily, which includes genes encoding for exchangeable apolipoproteins like ApoAI, AII, Cs, and E. The gene has been documented to possess several single nucleotide polymorphisms (SNPs) out of which −75G/A and −83C/T have been widely studied. The rare allele A (M1−) of the promoter region polymorphism −75G/A has been associated with raised HDL-c levels and this raised level is supposed to be due to its effects on apo AI gene transcription and increase in ApoAI concentrations. In comparison to −75G/A polymorphism, the mutant T allele (M2−) of 83C/T polymorphism has been associated with even higher rises in HDL-c levels.10
Apolipoprotein (Apo) B-100 is the principal protein component of LDL. The interaction of ApoB-100 with LDL receptors mediates the uptake of LDL from the liver and peripheral cells; hence Apo B-100 plays an important role in cholesterol homeostasis.11 The apo B gene is localized on chromosome 2, and the complete structure of the human apo B-100 gene has been elucidated.12 Several restriction fragment length polymorphisms (RFLPs) of the apo B gene have been described, including Xba1,13EcoR1,14 and insertion/deletion (ins/del) polymorphism of the signal peptide region.15 The EcoRI polymorphism (rs1042031) caused by a single nucleotide shift from G to A at nucleotide position 4154 present in exon 29 of the gene results in an amino acid change, Glu → Lys. This polymorphism affects the binding of LDL to the LDL receptor leading to decreased catabolism of LDL particles containing mutant alleles thus contributing to an increase in LDL-c levels.15
Apolipoprotein E (ApoE) is a protein that is incorporated into serum lipoproteins and directs their catabolism via binding to receptors. ApoE modulates the catabolism of triglyceride-depleted remnants of chylomicrons (CM) and very low-density lipoprotein (VLDL). The apo E gene, together with the apo CI, and apo CII genes, forms a gene cluster on the long arm of chromosome 19 (19q13.2).16 apo E is polymorphic with three common alleles (E2, E3, and E4) coding for 3 isoforms (E2, E3, and E4), which produce 3 homozygous (E2/E2, E3/E3, and E4/E4) and 3 heterozygous (E2/E3, E2/E4 and E3/E4) phenotypes in the human population.17 The frequencies of the E2 (112cys and 158cys), E3 (112cys and 158arg), and E4 (112arg and 158arg) alleles are relatively constant in adult Caucasians (8%, 78%, and 14%, respectively).18 However, the frequencies of these alleles in other populations are not identical. Allelic differences at the apo E gene locus determine about 16% of the genetic variance in the concentrations of LDL-c.19 Thus subjects with the genotypes E3/E2 and E4/E2 have 20% lower and those with genotype E4/E3 have 10% higher levels of LDL-c compared with subjects with genotype E3/E3.20 The incidence of CAD is increasing in India, especially in the younger population. Hence, it is important to delineate risk factors for CAD in Indians. No data are available for the relationship between apolipoprotein gene polymorphism and their plasma levels or other CAD risks factors in inhabitants of Asian Indian population in eastern part of India. We therefore hypothesized that genetic factor of these three apolipoprotein gene (apo AI, apo B and apo E) polymorphisms are important determinants of CAD in this population. To test this hypothesis, we studied all three-gene polymorphisms in patients with CAD and compare them with age sex matched healthy controls.
2. Methods
2.1. Study subjects
The study group was admitted to the Department of Cardiology unit at NRS Medical College and Hospital, Kolkata, India who had been diagnosed to have ischemic heart disease. The diagnosis was based on the complete physical and clinical examination of patients with typical angina and electrocardiographic study, tread-mill test, stress echo and echocardiographic evidence of ischemia or infarction. For the present study, only patients with ischemic heart disease were included, while patients with Alzheimer' disease, pulmonary, renal, hepatic diseases, cardiomyopathy and congestive heart failure and those taking any lipid lowering drugs were excluded.
The controls comprised the spouses, neighbors, and people from same work place of the patients, with the same socio-cultural background, in whom the clinical history, the objective search for signals of CAD, and the electrocardiographic as well as echocardiographic examinations did not suggest the presence of that disease. In the present study, evaluation of the contribution of confounding risk factors of the development of CAD was based on the individual's personal history findings.
2.2. Biochemical analysis
5 ml blood specimens were drawn after a 12 h overnight fast into EDTA-containing tubes. The plasma was separated after centrifugation at 2500 rpm for 10 min and was sent for biochemical analysis and used within 24 h for lipid analyses. TC, HDL-c and TG levels were measured by means of a semi-auto analyzer (Merck Ltd., India) using standard enzymatic methods. LDL-c levels were calculated using the Friedewald formula. HDL-c was determined after precipitation of the apolipoprotein (Apo) B-containing lipoproteins by phosphotungstate/magnesium chloride. Apolipoprotein AI, B, and E were determined by immunoturbidimetry method using auto N “DAIICHI” reagent and for standard measurement using Apo auto N “DAIICHI” calibrator.
2.3. DNA extraction
Genomic DNA was isolated using the phenol chloroform method. Extracted DNA was dissolved in 1× TE buffer after air-drying of ethanol and was stored at 4 °C until further analysis. All information regarding the volunteers and the DNA samples were saved onto the laboratory database after they were assigned sequential code numbers.
2.4. apo AI MspI polymorphisms
The forward primer to amplify the 433-bp fragment at the 5′ end of the apo AI gene was 5′-AGGGACAGAGCTGATCCTTGAACTCTTAAG-3′ with the reverse primer being 5′-TTAGGGGACACCTAGCCCTCAGGAAGAGCA-3′. Polymerase chain reaction (PCR) was performed in a volume of 25 μl containing 200 ng genomic DNA. The amounts of Mg2+, dNTP, and DNA polymerase (Bangalore Genei, India) used in each reaction were 1.5 mM, 200 μM, and 1 U, respectively. The thermal cycles started with 94 °C for 4 min and were followed by 35 cycles of 94 °C for 30 s, 55 °C for 30 s, and 72 °C for 30 s. A total volume of 20 μl containing 20 U MspI was added directly to the PCR product and digested at 37 °C overnight. After electrophoresis, the digested products were visualized on a 9% polyacrylamide gel with ethidium bromide staining.
There are 3 MspI restriction sites within the region amplified by PCR located at −75, +37, and +83 bp (Fig. 1). The genotypes of the −75-bp substitution are GG, GA, and AA.21 Both the G-to-A substitution at −75 bp and T-to-C and/or G-to-A substitutions at +83 bp result in a loss of MspI restriction sites, which were detected simultaneously by a single MspI digestion after PCR. The putative genotypes at −75 bp are defined as M1+/+ (GG) for the presence of MspI sites in both alleles (+ indicates the presence and –indicates the absence of the MspI restriction site), M1−/−(AA) for the absence of the site in both alleles, and M1+/−(GA) for a heterozygote. The putative genotypes at +83 bp are M2+/+, M2+/−, and M2−/−.
Fig. 1.
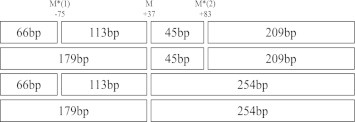
MspI restriction sites at the 5′-end of the apo AI gene amplified by PCR. M* = polymorphic MspI restriction site. The relevant fragment sizes with and without the base substitutions are indicated in each box (Supplementary Figure A).
2.5. apo B EcoRI polymorphism
The following primer pair forward-5′-CTGAGAGAAGTGTCTTCGAAG-3′ and reverse 5′-CTCGAAAGGAAGTGTAATCAC-3′ was used to amplify a region in the apo B gene. Each amplification reaction contained 300 ng DNA, 25 pmol of each primer, and 0.625 unit of Taq DNA polymerase in a final volume of 25 μl. The polymerase chain reaction procedure consisted of an initial denaturation step at 94 °C for 5 min, followed by 40 cycles of denaturation at 94 °C for 5 s, annealing at 58 °C for 10 s, and extension at 72 °C for 30 s.This was followed by a final extension of 7 min at 72 °C and the PCR product was digested with EcoRI at 37 °C overnight. The genotypes were determined by running the digested product in 2% agarose gel. R+ designates the presence of restriction site and R− indicates absence of site for the enzyme EcoRI. The total PCR product was of 480 bp size, which was digested with EcoR1 into two fragments of 253 bp and 227 bp in the presence of the cutting site (E+) (Supplementary Figure B).
2.6. apo E HhaI polymorphism
The 227 bp sequence of apo E was amplified by PCR in a DNA Thermal Cycler (Perkin Elmer Cetus 2400) using oligonucleotide primers forward (5′-TCCAAGGAGCTGCAGGCGGCGCA-3′) and reverse (5′-ACAGAATTCGCCCCGGCCTGGTACACTGCCA-3′). Each amplification reaction contained 250 ng of leukocyte DNA, 15 pmol of each primer, 200 μM dNTP 10% dimethyl sulfoxide, and 0.625 unit of Taq DNA polymerase in a final volume of 30 μl. Each reaction mixture was heated at 95 °C for 1 min for denaturation, and subjected to 35 cycles of annealing (65 °C for 25 s) and extension (72 °C for 50 s). After PCR amplification, 20 units of HhaI (Roche) were added to 20 μl PCR product and digested at 37 °C for 3 h. The digested product was loaded onto a 12% nondenaturing polyacrylamide gel and electrophoresed for 2 h at constant voltage. The gel was stained with ethidium bromide for 10 min and visualized under UV illumination. 227 bp amplicon digested with HhaI resulted in five genotypes, viz., E2/E2 (91, 81, 21, 18, 16), E3/E3 (91, 48, 33, 21, 18, 16), E4/E4 (72, 48, 33, 21, 19, 18, 16), E2/E3 (91, 81, 48, 33, 21, 18, 16), and E3/E4 (91, 72, 48, 33, 21, 19, 18, 16) (Supplementary Figure C).
2.7. Statistical analysis
The data were recorded on a pre-designed worksheet and managed with Microsoft Excel software. Data entry was double-checked. After confirming the normality aspects of the quantitative variables, descriptive statistics were computed using mean and standard deviation (SD). For qualitative variables, proportions were summarized. Student's t- test was applied to compare the mean values of quantitative variables among CAD patients and healthy controls. Frequency of allele is calculated as number of observation at the given allele divided by total number of observation. Associations of other categorical variables with CAD were assessed by χ2 test or Fisher's exact test, whichever was applicable. At the next stage of analysis, all the variables significantly associated with CAD were included in the logistic regression analysis after quantifying the associations by computing the unadjusted odds ratio for each variable. One way analysis of variance (ANOVA) was performed to test the null hypothesis of equality of apolipoprotein levels among the apolipoprotein genotype groups. All calculations were performed using SPSS, version 10 (SPSS, Chicago). Association of other categorical having p < 0.05 was considered as statistically significant. Assuming a 2-sided test with α = 0.05, power was calculated for the referent genotype compared with the other genotypes. The purpose of this was that the power validates the discovered associations because type II error is an important consideration herein.
3. Results
One hundred and fifty patients with angiographically proven CAD (126 males, 24 females) and one hundred fifty normal controls (129 males and 21 females) were evaluated. The mean age of the patients was 54.68 ± 8.84 years, while that of the controls was 52.76 ± 10.16 years. Smoking was highly prevalent in the group with CAD as compared to control group. Significantly higher mean concentrations of TC, LDL-c and TG (p < 0.0001) were observed in the CAD patients compared with the normal subjects, but the mean value of HDL-c was significantly lower in CAD patients than controls. Among the apolipoproteins, mean value of ApoB was higher in patients compared to controls and value of ApoAI was just reverse of it and both the values were statistically highly significant, on the other hand, mean value of ApoE was similar in patients and controls and the value was statistically insignificant (Table 1).
Table 1.
Carrier frequencies and mean (SD) of baseline characteristics by coronary artery disease (CAD).
| Risk factor | Control (n = 150) | CAD (n = 150) | p-value |
|---|---|---|---|
| Age/years | 52.76 (10.16) | 54.68 (8.84) | Matched |
| Sex (male/female) | 129/21 | 126/24 | Matched |
| Smoker | 39 (26%) | 123 (82%) | <0.0001 |
| Total cholesterol mg/dl | 153.82 (39.83) | 195.48 (38.09) | <0.0001 |
| Low-density lipoprotein cholesterol mg/dl | 89.41 (31.18) | 132.37 (35.52) | <0.0001 |
| High-density lipoprotein cholesterol mg/dl | 33.05 (8.03) | 29.25 (7.54) | <0.0001 |
| Triglycerides mg/dl | 150.09 (55.51) | 173.44 (57.45) | <0.0001 |
| ApoAI mg/dl | 130.39 (21.46) | 109.73 (23.03) | <0.0001 |
| ApoB mg/dl | 94.63 (14.39) | 110.74 (16.32) | <0.0001 |
| ApoE mg/dl | 4.08 (0.74) | 4.05 (0.54) | 0.697 |
ApoAI plasma concentration in relation to the −75G/A MspI restriction site genotype in the studied population is shown in Fig. 2. Individuals with the M1+/+ and M1+/-genotypes had a mean ApoAI concentration 1.2 times and 1.27 times, respectively, lower than the mean ApoAI concentration of M1−/− genotypes (p < 0.0001 for the difference genotypes).
Fig. 2.
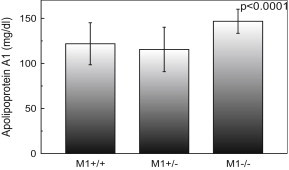
Apolipoprotein AI (ApoAI) concentration of study population according to the −75MspI restriction site genotypes. Subjects with M1+/+, M1+/-and M1−/− genotypes had mean ApoAI of 121.84, 115.53 and 146.84 mg/dl, respectively. The p-value is for comparison of the three genotypes (one way ANOVA). Data are shown as mean ± s.d.
In contrary, there was no such mean plasma ApoAI, ApoB and ApoE concentration difference in each genotype of apo AI +83 MspI, apo B EcoRI and apo E HhaI restriction site genotypes, gene polymorphism (p = 0.495, Fig. 3; p = 0.05, Fig. 4; p = 0.403, Fig. 5, respectively).
Fig. 3.
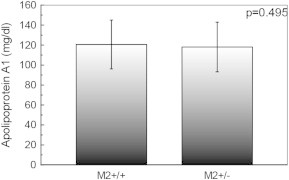
Apolipoprotein AI (ApoAI) concentration of study population according to the +83 MspI restriction site genotypes. Subjects with M2+/+ and M2+/− genotypes had mean ApoAI of 120.53 and 118.07 mg/dl, respectively. The p-value is for comparison of the three genotypes (one way ANOVA). Data are shown as mean ± s.d.
Fig. 4.
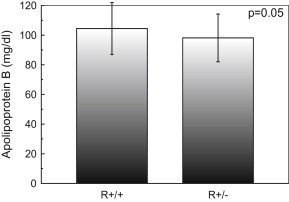
Apolipoprotein B (ApoB) concentration of study population according to the EcoRI restriction site genotypes. Subjects with R+/+ and R+/- genotypes had mean ApoB of 104.44 and 98.17 mg/dl, respectively. The p-value is for comparison of the three genotypes (one way ANOVA). Data are shown as mean ± s.d.
Fig. 5.
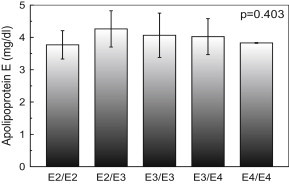
Apolipoprotein E (ApoE) concentration of study population according to the HhaI restriction site genotypes. Subjects with E2/E2, E2/E3, E3/E3, E3/E4 and E4/E4 genotypes had mean ApoE of 3.77, 4.26, 4.06, 4.02 and 3.83 mg/dl, respectively. The p-value is for comparison of the three genotypes (one way ANOVA). Data are shown as mean ± s.d.
The association of different apolipoprotein genotypes among CAD patients is shown in Table 2. There was no such association found among apo AI and apo B genotype. Among the apo E genotype the E3/E4 was extensively more common in patients compared to the healthy control group (OR: 7.178, 95% CI: 3.093–16.657, p < 0.0001) whereas, the E2/E3 genotype was more common in the control group (OR: 0.253, 95% CI: 0.091–0.700, p = 0.01).
Table 2.
Association of apolipoprotein AI, B and E genotypes among of CAD patients.
| Genotype | Control, no (%) | Patients, no (%) | p-value | OR | 95% CI |
|---|---|---|---|---|---|
| apo AI (M1) | |||||
| M1+/+ | 72 (48%) | 69 (46%) | Reference | ||
| M1+/− | 68 (45%) | 76 (51%) | 0.356 | 1.238 | 0.786–1.949 |
| M1−/− | 10 (7%) | 5 (3%) | 0.194 | 0.483 | 0.161–1.448 |
| apo AI (M2) | |||||
| M2+/+ | 126 (84%) | 117 (78%) | Reference | ||
| M2+/− | 24 (16%) | 33 (22%) | 0.187 | 1.481 | 0.827–2.652 |
| apo B (R) | |||||
| R+/+ | 102 (68%) | 114 (76%) | Reference | ||
| R+/- | 48 (32%) | 36 (24%) | 0.124 | 0.671 | 0.404–1.115 |
| apo E | |||||
| E3/E3 | 117 (78%) | 102 (68%) | Reference | ||
| E2/E2 | 6 (4%) | 1 (0.67%) | 0.092 | 0.161 | 0.019–1.355 |
| E2/E3 | 18 (12%) | 5 (3.33%) | 0.01 | 0.253 | 0.091–0.700 |
| E3/E4 | 7 (5%) | 39 (26%) | <0.0001 | 7.178 | 3.093–16.657 |
| E4/E4 | 2 (1%) | 3 (2%) | 0.654 | 1.510 | 0.248–9.170 |
The allele frequencies of both patients and controls were found to be in Hardy–Weinberg equilibrium (p > 0.05). Table 3 shows the allele frequency of different apolipoprotein genes. In this analysis, we have not found any statistically significant difference in allele frequency among apo AI and apo B gene. On the contrary, in apo E gene most participants carried at least one E3 allele, but 2.3% patient and 10% control carried an E2 allele (p = 0.003), while 15%, and 3.7% carried an E4 allele among patient and control, respectively (p < 0.0001).
Table 3.
Frequency distribution of apolipoproteins alleles.
| Alleles | Control (n = 150) | Patients (n = 150) | p-value |
|---|---|---|---|
| apo AI (M1) | |||
| M1+ | 0.71 | 0.71 | Reference |
| M1- | 0.29 | 0.29 | 1.000 |
| apo AI (M2) | |||
| M2+ | 0.92 | 0.89 | Reference |
| M2- | 0.08 | 0.11 | 0.212 |
| apo B (R) | |||
| R+ | 0.84 | 0.88 | Reference |
| R- | 0.16 | 0.12 | 0.159 |
| apo E | |||
| E3 | 0.862 | 0.827 | Reference |
| E2 | 0.100 | 0.023 | 0.003 |
| E4 | 0.037 | 0.150 | <0.0001 |
Variables showing statistically significant associations with CAD at p < 0.05 were simultaneously considered in a multivariate logistic regression model. We identified only five important predictors were statistically significant in this model. Among these, predictor presence of apo E4 allele (OR: 3.639, 95% CI: 1.019–12.995; p = 0.040) was found superior than other conventional risk factor i.e. smoker (OR: 0.044, 95% CI: 0.016–0.122; p < 0.0001), LDL-c (OR: 1.046, 95% CI: 1.013–1.079; p = 0.005), apo AI (OR: 0.923, 95% CI: 0.894–0.953; p < 0.0001) and apo B (OR: 1.109, 95% CI: 1.062–1.162; p < 0.0001) (Table 4). For these risk factors, the 95% CIs were wide because of small sample size.
Table 4.
Logistic regression analysis to determine risk factors for CAD.
| Variables | Unadjusted odds ratio (95% CI) | Adjusted odds ratio (95% CI), p-value |
|---|---|---|
| smoker | 0.077 (0.044–0.134) | 0.044 (0.016–0.122), p < 0.0001 |
| TC mg/dl | 1.028 (1.021–1.036) | 0.995 (0.965–1.025), p = 0.725 |
| LDL-c mg/dl | 1.039 (1.029–1.048) | 1.046 (1.013–1.079), p = 0.005 |
| HDL-c mg/dl | 0.938 (0.909–0.968) | 0.989 (0.926–1.055), p = 0.728 |
| TG mg/dl | 1.008 (1.003–1.012) | 0.999 (0.990–1.009), p = 0.912 |
| ApoAI mg/dl | 0.958 (0.946–0.970) | 0.923 (0.894–0.953), p < 0.0001 |
| ApoB mg/dl | 1.074 (1.053–1.095) | 1.109 (1.062–1.162), p < 0.0001 |
| ApoE mg/dl | 0.933 (0.658–1.321) | – |
| Genotypes with apo AI M1− allele | 1.084 (0.688–1.705) | – |
| Genotypes with apo AI M2− allele | 1.481 (0.827–2.652) | – |
| Genotypes with apo B R− allele | 0.716 (0.428–1.196) | – |
| Genotypes with apo E2 allele | 0.219 (0.087–0.552) | 1.788 (0.400–8.001), p = 0.447 |
| Genotypes with apo E4 allele | 6.092 (2.843–13.056) | 3.639 (1.019–12.995), p = 0.040 |
Power calculation showed that the apo E and apo AI −75G/A gene polymorphism had 99% (p < 0.0001) and 62% (p = 0.039) respectively statistical power, but the apo B and apo AI +83C/T gene polymorphism had showed only 54% (p = 0.067) and 46% (p = 0.121) respectively, which are statistically inadequate power in the association studies.
4. Discussion
The results of the present study show that plasma TC, TG, LDL-c and ApoB levels are significantly higher in CAD patients than in controls, whereas the levels of HDL-c and ApoAI in CAD patients are significantly lower than controls. These findings are consistent with those of our previous studies in a large population.22 The genotype frequencies of apo AI, apo B and apo E gene polymorphisms and their protein levels along with different conventional risk factors have been established for the first time in an Asian Indian population in the eastern part of India. The apo AI −75G/A polymorphism was found to be significantly associated with ApoAI levels in this population whereas no association was found in +83C/T polymorphism. There was no statistically significant change in the ApoB among different genotypes of apo B EcoRI polymorphism and also no significant difference was found in plasma levels of ApoE among the apo E HhaI genotypes.
Elevated levels of HDL-c and ApoAI are associated with reduced risk of developing CAD, probably because of the ability of HDL particles to promote cholesterol efflux from the cells.23 A G-to-A transition in the promoter region of the apo AI gene is relatively common, occurring in, 20% of normal Caucasians, and the frequency of the rare M2− allele (+83 bp) has been reported to be 4.1%.24 In the present study, the M1− allele frequency (29%) and the M2− allele frequency (8%) was greater than that of reported in previous studies.24 Mechanisms explaining the relationship of T and/or A substitutions with increased HDL cholesterol and ApoAI levels are currently unknown. However, hypomethylation, which occurs in the T and/or A substitution at the 59 region of the apo AI gene, increases apo AI gene expression.25 Alternatively, the T and/or A substitutions, which are located in the 5′-end leader region of the ApoAI mRNA, could be important for the initiation of mRNA translation.26 Matsunaga et al demonstrated that an A–C substitution at position −27 within TATA box and G to A substation at position −75 of human apo AI gene were associated with reduced ApoAI levels.27 In our study, we also found that ApoAI concentration is lower in heterozygous (M1+/−) than any other homozygous population in the −75 G/A MspI restriction site polymorphism. These data suggest that the M1+/− and −27 A–C substitution had the additive effect for reduced ApoAI levels. In the present study, the loss of the MspI site by the C-to-T (+830 bp) and/or G-to-A (+84 bp) substitutions was not associated with ApoAI.
A reason why ApoB may be a stronger predictor of risk than LDL-c is that ApoB is present not only in LDL but also in VLDL, intermediate density lipoprotein, and lipoprotein (a). Therefore, the sum of ApoB concentrations in all atherogenic particles might be a better risk marker than TC and LDL-c levels only.6 Absence of an association between EcoR1 polymorphism of apo B and plasma ApoB levels is, however, similar to the observations made by other group.28,29 The RFLP detected with EcoR1 is due to a single base pair change in the coding region of the gene, which is known to cause an amino acid change in the ApoB by itself. apo B R- allele frequency was found in our population similar in North Indians (0.18) and Brazilians (0.15).30,31 R- allele frequency in the present study population was found to be nearly three times than that of Chinese from Taipei (0.05).32 Hegele and his co-workers also found a significant correlation between apo B gene polymorphisms and CAD, without any significant association with either LDL or VLDL.33 Similar results were reported in a porcine model of atherosclerosis in which an apo B genetic variant was associated with atherosclerosis, despite normal lipid levels.34 Our results show that the apo B gene variations possibly do not affect the ApoB levels. We speculated that a mutation in the protein coding region of apo B could affect the interaction of LDL with monocyte macrophages, endothelial cells, ground substance, clotting factors, or the immune system in a manner that would promote atherogenesis.35 The present study and other investigators have found that although CAD patients showed a significantly higher concentration of LDL-c than the controls, none of the alleles of the apo B gene was significantly associated with variation in concentrations of ApoB in CAD patients or in controls.36 Paulweber et al reported that it is the R- allele that is associated with the risk of CAD. But in our study this association is not found.37
The apo E ε2/ε3/ε4 genotypes explain between 10% and 20% of the total variation of the plasma ApoE concentration in the population at large.38,39 However, combined linkage and association analysis revealed that ≈80% of the total variation in plasma ApoE concentration is determined by genetic factors.40 But in our study we did not find any correlation between apo E genotypes and ApoE plasma concentration. According to Mannila et al the apo E promoter polymorphism rs769,446 as a functional SNP involved in the regulation of the plasma ApoE concentration. However, the rs769,446 SNP was not associated with changes in plasma lipoprotein levels, indicating that variation in plasma ApoE concentration does not influence CHD risk41 as has been found in the study. In a population based study, Venkataramana et al reported that the allele frequencies in Indian population 85%–92% for E3 allele, 3.9% for E4 allele and 3.5% for E2 allele.42 In the present study, apo E allele frequencies in the control group of our population are 3.7%, 86.2% and 10% for E4, E3 and E2, respectively, which are comparable with the study.42 As is shown in Table 2, the prevalence of E3/E4 genotype was high in patient group than control subjects (OR: 7.178; 95% CI: 3.039–16.657; p < 0.0001). This finding suggests that the prevalence of E3/E4 genotype may be risk factors in this complex disease. Difference in the frequency of reference allele E3 was not statistically significant in control group when compared to patient (86.2% vs 82.7%, p = 0.215), while statistical difference was found between patients and controls with respect to E2 and E4 allele frequency (2.3% vs 10%, p = 0.003, and 14.4% vs 3.6%, p < 0.0001). Carriers of E4 allele form a high-risk group showing greater susceptibility to CAD while the E2 allele has reverse effect. It has been suggested that the E4 allele is related to HDL-c and LDL-c levels, while the potential antiatherogenic of the E2 involving lower levels of LDL-c may be offset by accumulation of atherogenic large very low-density lipoprotein cholesterol and remnant rich lipoproteins.43,44 Beyond the effect on lipid metabolism, apo E genotypes may also affect CAD risk though antioxidative, inflammatory and immune activities.43,44 In this investigation, we found that carriers of E4 allele had four fold higher risk of developing CAD (OR: 3.639, 95% CI: 1.019–12.995; p = 0.040) with smoking, LDL-c, ApoAI and ApoB but no association were found with TC, HDL-c, triglycerides and genotypes with apo E2 allele.
The lack of association for apo AI and apo B gene polymorphism in our study may be attributed to ethnic variation, or it may have been limited by its statistical power, and the current findings cannot definitively exclude a non-significant association between this polymorphism and CAD because of inadequate power. The size of the studied population is relatively small, and therefore our findings need to be confirmed in larger initial test populations or novel genetic epidemiological approaches to extract the genetic contribution to prevalent phenotypes such as CAD. Finally, we cannot exclude that the observed associations depend on the effect of genes.
In conclusion, our results support the notion that a significant association of E4 allele is observed with CAD in addition to the other well known risk factors (smoking, LDL-c ApoAI and ApoB) and this study shows genotypes with E4 allele is the prominent genetic predictors, for the development of CAD in Asian Indian population in Eastern part of India. These interesting observations should be confirmed in further large-scale trials in patients with CAD and in other macrovascular atherosclerotic diseases in Asian Indians.
Conflicts of interest
All authors have none to declare.
Acknowledgments
The authors are grateful to the staff of the Department of Cardiology, N.R.S. Medical College & Hospital, Kolkata, India for their cooperation during sample collection. We acknowledge Mr. Ranjit Kumar Das for his kind help in this work.
Appendix A. Supplementary data
The following are the supplementary data related to this article:
References
- 1.Misra A., Vikram N.K. Insulin resistance syndrome (metabolic syndrome) and Asian Indians. Curr Sci. 2002;83:1483–1496. [Google Scholar]
- 2.Kooner J.S. Coronary heart disease in UK Indian Asians the potential for reducing mortality. Heart. 1997;78:530–532. doi: 10.1136/hrt.78.6.530. [DOI] [PMC free article] [PubMed] [Google Scholar]
- 3.Kim H.K., Chang S.A., Choi E.K. Association between plasma lipids, and apolipoproteins and coronary artery disease: a cross-sectional study in a low-risk Korean population. Int J Cardiol. 2005;101:435–440. doi: 10.1016/j.ijcard.2004.03.057. [DOI] [PubMed] [Google Scholar]
- 4.Austin M.A. Plasma triglyceride as a risk factor for coronary heart disease. The epidemiologic evidence and beyond. Am J Epidemiol. 1989;129:249–259. doi: 10.1093/oxfordjournals.aje.a115130. [DOI] [PubMed] [Google Scholar]
- 5.Achari V., Thakur A.K. Association of major modifiable risk factors among patients with coronary artery disease - a retrospective analysis. J Assoc Physicians India. 2004;52:103–108. [PubMed] [Google Scholar]
- 6.Walldius G., Jungner I., Holme I. High apolipoprotein B, low apolipoprotein A-I, and improvement in the prediction of fatal myocardial infarction (AMORIS study): a prospective study. Lancet. 2001;358:2026–2033. doi: 10.1016/S0140-6736(01)07098-2. [DOI] [PubMed] [Google Scholar]
- 7.Assmann G., Schulte H. Relation of high-density lipoprotein cholesterol and triglycerides to incidence of atherosclerotic coronary artery disease (the PROCAM experience). Prospective Cardiovascular Munster study. Am J Cardiol. 1992;70:733–737. doi: 10.1016/0002-9149(92)90550-i. [DOI] [PubMed] [Google Scholar]
- 8.Young S.G. Recent progress in understanding apolipoprotein B. Circulation. 1990;82:1574–1594. doi: 10.1161/01.cir.82.5.1574. [DOI] [PubMed] [Google Scholar]
- 9.Davignon J., Gregg R.E., Sing C.F. Apolipoprotein E polymorphism and arteriosclerosis. Arteriosclerosis. 1988;8:1–21. doi: 10.1161/01.atv.8.1.1. [DOI] [PubMed] [Google Scholar]
- 10.Forte T.M., McCall M.R. The role of apolipoprotein A-I–containing lipoproteins in atherosclerosis. Curr Opin Lipidol. 1994;5:354–364. doi: 10.1097/00041433-199410000-00007. [DOI] [PubMed] [Google Scholar]
- 11.Brown M.S., Goldstein J.L. How LDL receptors influence cholesterol and atherosclerosis. SciAm. 1984;251:58–66. doi: 10.1038/scientificamerican1184-58. [DOI] [PubMed] [Google Scholar]
- 12.Knott T.J., Rall S.C., Jr., Innerarity T.L. Human apolipoprotein B: structure of carboxyl-terminal domains, sites of gene expression, and chromosomal localization. Science. 1985;230:37–43. doi: 10.1126/science.2994225. [DOI] [PubMed] [Google Scholar]
- 13.Priestly L., Knott T., Wallis S. RFLP for the human apolipoprotein B gene: V; Xba1. Nucleic Acids Res. 1985;13:6793. doi: 10.1093/nar/13.18.6793. [DOI] [PMC free article] [PubMed] [Google Scholar]
- 14.Huang L.S., Miller D.A., Bruns G.A. Mapping of the human APOB gene to chromosome 2p and demonstration of a two-allele restriction fragment length polymorphism. Proc Natl Acad Sci U S A. 1986;83:644–648. doi: 10.1073/pnas.83.3.644. [DOI] [PMC free article] [PubMed] [Google Scholar]
- 15.Boerwinkle E., Chan L. A three codon insertion/deletion polymorphism in the signal peptide region of the human apolipoprotein B (APOB) gene directly typed by the polymerase chain reaction. Nucleic Acids Res. 1989;17:4003. doi: 10.1093/nar/17.10.4003. [DOI] [PMC free article] [PubMed] [Google Scholar]
- 16.Shaw D.J., Brook J.D., Meredith A.L. Gene mapping and chromosome 19. J Med Genet. 1986;23:2–10. doi: 10.1136/jmg.23.1.2. [DOI] [PMC free article] [PubMed] [Google Scholar]
- 17.Endives E.S., Gordon D.A., Pursing L.K. Systemic distribution of apolipoprotein E secreted by grafts of epidermal keratinocytes; implications for epidermal function and gene therapy. PNAS U S A. 1989;86:8803–8807. doi: 10.1073/pnas.86.22.8803. [DOI] [PMC free article] [PubMed] [Google Scholar]
- 18.deKnijff P., Maagdenberg A.M.J.M., Frants R.R. Genetic heterogeneity of apolipoprotein E and its influence on plasma lipid and lipoprotein levels. Hum Mutat. 1994;4:178–194. doi: 10.1002/humu.1380040303. [DOI] [PubMed] [Google Scholar]
- 19.Sing C.F., Davignon J. Role of apolipoprotein E polymorphism in determining normal lipid and lipoprotein variation. AmJ Hum Genet. 1985;37:268–285. [PMC free article] [PubMed] [Google Scholar]
- 20.Robertson F.W., Cumming A.M. Effect of apoprotein E polymorphism on serum lipoprotein concentration. Arteriosclerosis. 1985;5:283–292. doi: 10.1161/01.atv.5.3.283. [DOI] [PubMed] [Google Scholar]
- 21.Paul-Hayase H., Rosseneu M., Robinson D. Polymorphisms in the apolipoprotein (apo) A1-CIII-A1V gene cluster: detection of genetic variation determining plasma apo A1, apo CIII and apo A1V concentrations. Hum Genet. 1992;88:439–446. doi: 10.1007/BF00215679. [DOI] [PubMed] [Google Scholar]
- 22.Biswas S., Ghosal P.K., Mandal S.C. Association of low-density lipoprotein particle size and ratio of different lipoproteins and apolipoproteins with coronary heart disease. J Cardiol. 2008;52:118–126. doi: 10.1016/j.jjcc.2008.06.005. [DOI] [PubMed] [Google Scholar]
- 23.Tribble D.L., Krauss R.M. HDL and coronary artery disease. Adv Intern Med. 1993;38:1–29. [PubMed] [Google Scholar]
- 24.Wang X.L., Badenhop R., Humphrey K.E. New MspI polymorphism at 83 bp of the human apolipoprotein A1 gene: association with increased circulating high density lipoprotein cholesterol levels. Genet Epidemiol. 1996;13:1–10. doi: 10.1002/(SICI)1098-2272(1996)13:1<1::AID-GEPI1>3.0.CO;2-D. [DOI] [PubMed] [Google Scholar]
- 25.Shemer R., Walsh A., Eisenberg S. Tissue-specific methylation patterns and expression of the human apolipoprotein A1 gene. J Biol Chem. 1990;265:1010–1015. [PubMed] [Google Scholar]
- 26.Kozak M. Structural features in eukaryotic mRNAs that modulate the initiation of translation. J Biol Chem. 1991;266:19867–19870. [PubMed] [Google Scholar]
- 27.Matsunaga A., Sasaki J., Han H. Compound heterozygosity for an apolipoprotein A1 gene promoter mutation and a structural nonsense mutation with apolipoprotein A1 deficiency. Arterioscler Thromb Vasc Biol. 1999;19:348–355. doi: 10.1161/01.atv.19.2.348. [DOI] [PubMed] [Google Scholar]
- 28.Saha N., Tay J.S., Heng C.K. DNA polymorphisms of the apolipoprotein B gene are associated with obesity and serum lipids in healthy Indians in Singapore. Clin Genet. 1993;44:113–120. doi: 10.1111/j.1399-0004.1993.tb03861.x. [DOI] [PubMed] [Google Scholar]
- 29.Renges H.H., Wile D.B., McKeigue P.M. Apolipoprotein B gene polymorphisms are associated with lipid levels in men of South Asian descent. Atherosclerosis. 1991;91:267–275. doi: 10.1016/0021-9150(91)90174-2. [DOI] [PubMed] [Google Scholar]
- 30.Puri R.D., Tewari S., Sinha N. Polymorphisms in the apolipoprotein B-100 gene: association with plasma lipid concentration and coronary artery disease. Indian Heart J. 2003;55:60–64. [PubMed] [Google Scholar]
- 31.Machado M.O., Hirata M.H., Bertolami M.C. Apo B gene haplotype is associated with lipid profile of higher risk for coronary heart disease in Caucasian Brazilian men. J Clin Lab Anal. 2001;15:19–24. doi: 10.1002/1098-2825(2001)15:1<19::AID-JCLA4>3.0.CO;2-#. [DOI] [PMC free article] [PubMed] [Google Scholar]
- 32.Pan J.P., Chiang A.N., Tai J.J. Restriction fragment length polymorphisms of apolipoprotein B gene in Chinese population with coronary heart disease. ClinChem. 1995;41:424–429. [PubMed] [Google Scholar]
- 33.Hegele R.A., Huang L.S., Herbert P.N., Hennekens C.H., Breslow J.L. Apolipoprotein B-gene DNA polymorphisms associated with myocardial infarction. N Engl J Med. 1986;315:1509–1515. doi: 10.1056/NEJM198612113152403. [DOI] [PubMed] [Google Scholar]
- 34.Rapacz J., Hasler-Rapacz J. Investigations on the relationship between immunogenetic polymorphisms of betalipoproteins and the beta lipoprotein and cholesterol in swine. In: Lenzi S., Descovich G.C., editors. Atherosclerosis and Cardiovascular Disease. EditriceCompositori; Bologna: 1984. pp. 99–108. [Google Scholar]
- 35.Ross R. The pathogenesis of atherosclerosis—an update. N Engl J Med. 1986;314:488–500. doi: 10.1056/NEJM198602203140806. [DOI] [PubMed] [Google Scholar]
- 36.Genest J.J., Jr., Ordovas J.M., McNamara J.R. DNA polymorphisms of the apolipoprotein B gene in patients with premature coronary artery disease. Atherosclerosis. 1990;82:7–17. doi: 10.1016/0021-9150(90)90138-9. [DOI] [PubMed] [Google Scholar]
- 37.Paulweber B., Friedl W., Krempler F. Association of DNA polymorphism at the apolipoprotein B gene locus with coronary heart disease and serum very low density lipoprotein levels. Arteriosclerosis. 1990;10:17–24. doi: 10.1161/01.atv.10.1.17. [DOI] [PubMed] [Google Scholar]
- 38.Neale M.C., de Knijff P., Havekes L.M. ApoE polymorphism accounts for only part of the genetic variation in quantitative ApoE levels. Genet Epidemiol. 2000;18:331–340. doi: 10.1002/(SICI)1098-2272(200004)18:4<331::AID-GEPI6>3.0.CO;2-V. [DOI] [PubMed] [Google Scholar]
- 39.Beekman M., Posthuma D., Heijmans B.T., Lakenberg N. Combined association and linkage analysis applied to the APOE locus. Genet Epidemiol. 2004;26:328–337. doi: 10.1002/gepi.10318. [DOI] [PubMed] [Google Scholar]
- 40.Beekman M., Heijmans B.T., Martin N.G. Heritabilities of apolipoprotein and lipid levels in three countries. Twin Res. 2002;5:87–97. doi: 10.1375/1369052022956. [DOI] [PubMed] [Google Scholar]
- 41.Mannila M.N., Mahdessian H., Franco-Cereceda A. Identification of a functional apolipoprotein e promoter polymorphism regulating. Arterioscler Thromb Vasc Biol. 2013;33 doi: 10.1161/ATVBAHA.112.300353. [DOI] [PubMed] [Google Scholar]
- 42.Venkataramana P., Chengal R.E., Ferrell R.E. Apolipoprotein E polymorphism in two populations of Andru Pradesh. Ind J Hum Genet. 2002;3:1–5. [Google Scholar]
- 43.Davignon J., Cohn J.S., Mabile L. Apolipoprotein E and atherosclerosis: insight from animal and human studies. ClinChimActa. 1999;286:115–143. doi: 10.1016/s0009-8981(99)00097-2. [DOI] [PubMed] [Google Scholar]
- 44.Lusis A.J., Mar R., Pajakanta P. Genetics of atherosclerosis. Anna Rev Genomics Hum Genet. 2004;5:184–218. doi: 10.1146/annurev.genom.5.061903.175930. [DOI] [PubMed] [Google Scholar]
Associated Data
This section collects any data citations, data availability statements, or supplementary materials included in this article.