

Abstract
Adropin is a secreted peptide that improves hepatic steatosis and glucose homeostasis when administered to diet-induced obese mice. It is not clear if adropin is a peptide hormone regulated by signals of metabolic state. Moreover, the significance of a decline in adropin expression with obesity with respect to metabolic disease is also not clear. We investigated the regulation of serum adropin by metabolic status and diet. Serum adropin levels were high in chow-fed conditions and were suppressed by fasting and diet-induced obesity (DIO). High adropin levels were observed in mice fed a high-fat low carbohydrate diet, whereas lower levels were observed in mice fed a low-fat high carbohydrate diet. To investigate the role of adropin deficiency in metabolic homeostasis, we generated adropin knockout mice (AdrKO) on the C57BL/6J background. AdrKO displayed a 50%-increase in increase in adiposity, although food intake and energy expenditure were normal. AdrKO also exhibited dyslipidemia and impaired suppression of endogenous glucose production (EndoRa) in hyperinsulinemic–euglycemic clamp conditions, suggesting insulin resistance. While homo- and heterozygous carriers of the null adropin allele exhibited normal DIO relative to controls, impaired glucose tolerance associated with weight gain was more severe in both groups. In summary, adropin is a peptide hormone regulated by fasting and feeding. In fed conditions, adropin levels are regulated dietary macronutrients, and increase with dietary fat content. Adropin is not required for regulating food intake, however, its functions impact on adiposity and are involved in preventing insulin resistance, dyslipidemia, and impaired glucose tolerance.
INTRODUCTION
Obesity is associated with insulin resistance and increased risk of developing type 2 diabetes. The economic impact of diabetes on the US economy, estimated at $174 billion in 2007 due to medical expenditures and lost productivity, are projected to increase to $336 billion by 2034 (1,2). Maintaining glycemic control is the primary objective for the treatment of type 2 diabetes. However, current methods of treatment provide effective glycemic control for <5 years requiring multidrug therapies and in some cases the use of insulin injections (3). Insulin resistance is also frequently associated with nonalcoholic fatty liver disease, which is an independent risk factor for type 2 diabetes and cardiovascular disease (4,5). Nonalcoholic fatty liver disease can progress to nonalcoholic steatohepatitis, the most common of cause of chronic liver disease in modern societies. While many therapies have been evaluated, a consensus on how to manage nonalcoholic fatty liver disease and nonalcoholic steatohepatitis has yet to develop (6).
The limited efficacy of current treatment methods and the continued upward trend in the diagnosis of type 2 diabetes and fatty liver disease are an incentive for investigating how metabolic homeostasis is maintained to improve treatment efficacy and identify novel treatment methods. Several peptide hormones secreted by the endocrine pancreas, gut, adipocytes, and liver modulate insulin activity to maintain glucose homeostasis; these hormones are considered promising leads in the development of therapies against type 2 diabetes (7–9). The secreted peptide adropin, a product of the Energy Homeostasis Associated (Enho) gene, was recently identified during an investigation of obese insulin resistant mice as a novel factor linking signals of nutrient intake with metabolic homeostasis (10). The analysis of adropin regulation and action in mouse models suggested a peptide hormone involved in metabolic homeostasis. A role for adropin in metabolic homeostasis is supported by the observation that therapy using synthetic peptide or transgenic over expression improves glucose homeostasis, fatty liver, and dyslipidemia observed with obesity. The expression of adropin in the central nervous system suggests a role as a neuropeptide, while it is possible also that adropin has autocrine/paracrine roles in peripheral tissues. Adropin also regulates angiogenesis, increasing blood flow, and capillary density in a model of hind limb ischemia, suggesting that it may be important for maintaining cardiovascular health (11). A recent report suggests that adropin is present in human serum, consistent with it being a peptide hormone, with an increase in levels observed in patients with heart failure (12).
The experiments reported herein had two objectives. The first was to investigate whether serum adropin is regulated by fasting, nutrition and obesity, as suggested by gene expression data (10). The second objective was to investigate the phenotype of adropin-deficient mice and determine whether adropin deficiency per se is sufficient to disturb metabolic homeostasis using C57BL/6J (B6) adropin knockout mice (AdrKO). The results presented herein suggest that adropin is a peptide hormone, and that the concentration of adropin in the circulation is regulated by metabolic state and dietary macronutrients. Analysis of AdrKO indicates that adropin is involved in regulating adiposity, and that the functions of adropin are required for preventing hepatic insulin resistance.
METHODS AND PROCEDURES
Gene targeting
The Enho gene may share a poly(A) site with the Dnaic1 gene encoding an axonemal protein involved in mucociliary clearance and neural development (13). We therefore targeted the open reading frame in exon 2 for Cre-mediated excision to minimize interference. LoxP sites were inserted into the first intron and 3′ of the adropin coding sequence in exon 2. Screening for recombinant B6 Bruce-4 ES clones involved PCR followed by sequencing of critical vector-target gene boundaries. Offspring inheriting the modified allele (C57BL/6- Enhotm1Butl) were crossed with B6.FVB-Tgn(EIIa-Cre)C5379Lmgd mice to remove the LoxP-flanked region of the Enho gene from the germline (14). Heterozygous carriers of the null allele (C57BL/6- Enhotm1.1Butl, hereafter called AdrHET) were mated to produce homozygous knockout mice.
Animal studies
Studies using mice were approved by the Institutional Animal Care and Use Committees of the Pennington Biomedical Research Center (Baton Rouge, LA) and The Scripps Research Institute (Jupiter, FL). Mice were maintained on a chow diet (Purina 5P76; 60% kJ provided by carbohydrates; 26% kJ/protein, and 14% kJ/fat). Studies investigated the regulation of serum adropin by dietary macronutrients used a purified low-fat diet (LFD; Research Diets formula 12450B: 10% kJ/fat, 70% kJ/carbohydrate, and 20% kJ/protein) and high-fat diet (HFD; Research Diets formula 12492: 60% kJ/fat, 20% kJ/carbohydrate, and 20% kJ/protein). Male lean and diet-induced obese (DIO) B6 mice were purchased from the Jackson Laboratory (Bar Harbor, ME); these mice had been maintained on HFD (12492) for 12 weeks. The lean controls for the DIO study purchased from the same vendor were maintained on LFD (12450B). For studies analyzing serum adropin levels, 8–10-week-old male B6 mice were purchased from the same vendor. All mice were allowed 2–4 weeks to recover from shipment. Food intake and energy expenditure were simultaneously measured using a comprehensive laboratory animal monitoring system (CLAMS; Columbus Instruments, Columbus, OH) as described previously (10). Mice were acclimated to housing in the CLAMS for 3 days, and then measurements of food intake, oxygen consumption (VO2), respiratory exchange ratio (VCO2/VO2) and movement recorded for a further 3 days. Body composition (fat mass, fat-free mass) was assessed using a Minispec Live Mice Analyzer (Bruker Optics, Billerica, MA) (15). Food intake was measured using cages with wire-mesh bases were to allow for capture of spillage (15).
Blood chemistries
Serum triglycerides, glucose and insulin tolerance tests, and liver lipids were measured as previously described (10). Serum adropin was measured by ELISA (Bachem, Torrance, CA). We tested the specificity of the adropin ELISA using conditioned media of HEK cells expressing a vector with the adropin open reading frame or empty vector (10), and using sera from AdrKO.
Hyperinsulinemic–euglycemic clamp in conscious mice
Clamp studies were performed at the Vanderbilt University School of medicine Mouse Metabolic Phenotyping Center. Catheters were inserted into the left carotid artery for sampling, and the right jugular vein for infusions. Animals were allowed 5–7 days to recover, with mice losing >15% of body weight excluded from the study. A 2-hour hyperinsulinemic–euglycemic clamp was conducted in conscious mice fasted for 4 h. Human insulin was infused at a dose of 2.5 mU/kg/min (Humulin; Eli Lilly, Indianapolis, IN), while a 20% glucose solution was infused at a variable rate to maintain euglycemia (16). Whole body glucose turnover was assessed with a 1 μCi bolus of [3-3H] glucose 90 min before insulin treatment, followed by a 0.05 μCi/min infusion during the clamp. Insulin-stimulated glucose uptake in individual organs was determined using 2-deoxy-d-[1-14C] glucose (PerkinElmer, Waltham, MA) administered as a single bolus (13 μCi) 120 min after the start of clamp procedure. At the end of the procedure (t = 145 min), mice were anesthetized using sodium pentobarbital and the gastrocnemius, superficial vastus lateralis, liver, diaphragm, heart, and brain were excised, immediately frozen, and stored at –80 °C for analysis.
Insulin signaling was assessed by measuring phosphorylation of Akt on threonine 308 and serine 473, and determining total Akt expression, by western blotting as described previously (15). All antibodies against Akt used for this study were purchased from Cell Signaling Technology (Danvers, MA). Total protein loading was assessed using an antibody against β-actin (Sigma-Aldrich, St Louis, MO)
Statistics
All data are presented as mean ± SEM. Student’s t-test or one- or two-way ANOVA where appropriate were used to determine significance with post-hoc analysis used to determine significance in comparisons of multiple groups.
RESULTS
Serum adropin is regulated by fasting, dietary macronutrients, and obesity
Expression of the adropin transcript in liver of mice is regulated by fasting and dietary macronutrients (10). To determine whether adropin levels in the circulation exhibit a similar pattern of regulation, we investigated serum adropin levels in fasted and chow-fed conditions, and in mice-fed purified diets with high- or low-fat content. In chow-fed mice, adropin levels averaged 15 ng/ml and with fasting levels fell to between 1 and 2 ng/ml (Figure 1a). In mice-fed purified diets for 48 h, serum adropin levels were markedly higher in the HFD-fed group compared to mice-fed LFD (Figure 1b). We next analyzed serum adropin in DIO mice. Mice-fed HFD were obese, exhibiting increased body weight compared to controls fed LFD (41.0 ± 1.4g vs. 30.9 ± 0.8 g, P < 0.001). Serum adropin levels were below the limits of detection (<1 ng/ml) in DIO mice. Serum adropin levels were also low in the lean control group fed a purified diet with high carbohydrate content (70% of calories). The low levels of adropin observed in mice fed the purified LFD from 2 days to 3 months is a novel finding, and suggests that diets high in simple carbohydrates may suppress serum adropin levels. In general, the pattern of regulation correlates with previously observed changes in expression of the adropin transcript in liver of mice in fed or fasted conditions (10).
Figure 1.
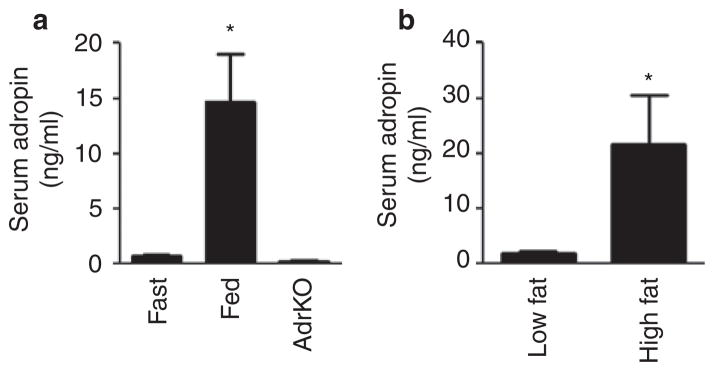
Serum adropin levels in wild-type mice subjected to various nutritional challenges and in adropin knockout mice (AdrKO). (a) Adropin levels were measured using ELISA in sera collected from wild-type C57BL/6J (B6) mice that were fasted overnight or allowed ad libitum access to rodent chow. No adropin immunoreactivity was observed in sera collected from AdrKO. There were 5–6 mice per group, *P < 0.05 vs. fasted and AdrKO. (b) Measurement of serum adropin in lean B6 mice fed a purified low-fat diet (10% kJ/fat, 70% kJ/carbohydrate) or high-fat diet (60% kJ/fat, 20 kJ%/carbohydrate) for 48 h. All samples were collected at 0900 h from mice housed in a 12 h light:dark cycle, with lights-on from 0600–1800 h, with six mice per group, *P < 0.05 vs. the low-fat diet-fed mice.
Adropin-deficient mice exhibit reduced viability and increased adiposity
The Enho gene is situated adjacent to the Dnaic1 gene that encodes a protein involved in signal transduction and cytoskeleton function. Mutations in this gene have been linked to primary ciliary dyskinesia (13). A targeting strategy was therefore designed to minimize potential interference with the Dnaic1 gene (Figure 2a). Expression of the Eiia-Cre transgene in embryogenesis removed portions of the single intron and the portion of exon 2 containing the adropin open reading frame that were flanked by LoxP sites. Heterozygous males and females (AdrHET) were then mated to produce homozygous carriers of the null Enho allele (AdrKO). Expression of the Enho transcript was not detected by reverse transcription-PCR in liver, whole brain, or skeletal muscle of AdrKO (Figure 2b). Adropin was also not detected in sera from fed AdrKO (Figure 1a), providing further confirmation of the successful removal of the adropin open reading frame. Expression of Dnaic1 and the ciliary neurotrophic receptor gene situated 60 kb upstream of the Enho gene on the same strand of mouse chromosome 4, were not suppressed in neural tissue of AdrKO (Figure 2c).
Figure 2.

Gene targeting strategy used to generate adropin knockout mice (AdrKO). (a) The Enho gene is comprised of two exons, with the adropin open reading frame (ORF) situated in exon 2 (E2). A disrupted Enho allele was generated by inserting loxP sites into the single intron and 3′ of the adropin ORF in exon 2. Expression of Cre-recombinase removes part of the intron and the part of exon 2 containing the open reading frame. Note that this will also remove the neomycin selection cassette (Neo). (b) The transcript produced by the Enho gene is not detected by reverse transcription (RT)-PCR in total RNA samples from the liver, brain, and skeletal muscle of AdrKO. (c) RT-PCR analysis of Dnaic1 and Cntr expression in the central nervous system of WT (+/+), AdrHET (+/−), and AdrKO (−/−).
We have weaned and genotyped 374 progeny obtained from mating heterozygous carriers. Our analysis suggests that adropin-deficiency has an impact on mortality before weaning. Genotyping of the offspring revealed 118 wild type (WT), 162 AdrHET, and 94 AdrKO mice, which is 20–30% fewer heterozygous and homozygous carriers of the null allele predicted based on simple a Mendelian pattern of inheritance (expected: 118:236:118, χ2 = 9.224 with 2 degrees of freedom, P < 0.01).
Male and female mice that survived to weaning were maintained on a standard rodent chow. AdrKO exhibited an increase in body weight due exclusively to increased fat mass (Figure 3). Analysis of adiposity by two-way ANOVA with sex and genotype as independent variables indicated no significant effect of sex, with a highly significant effect of genotype (P = 0.007). Post hoc analysis using a multiple comparison procedure indicated evidence of a gene-dosage effect, with heterozygous carriers of the null allele exhibiting an intermediate phenotype at 9 weeks of age (least square means of adiposity by genotype: WT, 11.1 ± 0.9%; AdrHET, 12.5 ± 0.8%; and AdrKO, 15.6 ± 1.0%; WT vs. AdrKO, P < 0.01; WT vs. AdrHET, P < 0.05). Analysis of body weight using the same procedures indicated significant effects of sex (P < 0.001), with males heavier than females, and a significant increase in body weight of AdrKO compared to WT (least square means for body weight by genotype: WT, 20.6 ± 0.7; AdrHET, 21.9 ± 0.6; and AdrKO, 23.1 ± 0.7; WT vs. AdrKO, P < 0.05).
Figure 3.

Adropin knockout mice (KO) weaned onto standard rodent chow exhibit increased adiposity at 9 weeks, but not 6 weeks of age. (a, b) Body weight and adiposity (fat mass as a percent of total body weight) (c, d) are shown for male and female mice at (a, c) 6 weeks and (b, d) 9 weeks of age. At 9 weeks of age, male and female knockout mice exhibit increased fat mass and adiposity; there was no significant difference in any of the parameter measured in heterozygous carriers of the null allele (HET). *P < 0.05 vs. WT. n = 3–5 per group.
To investigate the impact of age on the body composition phenotype, we examined 24 weeks old male AdrKO (n = 9) and control littermates (n = 10) maintained on standard rodent chow. There was no significant difference in body weight of AdrKO compared to the control group (31.8 ± 0.8 g vs. 29.6 ± 0.8 g). However, a 50% increase in fat mass was still observed (4.4 ± 0.5 g vs. 2.6 ± 0.5 g, P < 0.05) with no significant difference in fat-free mass (19.0 ± 0.5 g vs. 19.5 ± 0.5 g).
AdrKO display reduced physical activity but have normal food intake and energy expenditure
Whole body energy expenditure and activity was assessed using a 16 chamber comprehensive laboratory animal monitoring system (Figure 4a–c). The study used WT and AdrKO with similar body weight (30.0 ± 0.9 g vs. 30.9 ± 1.6 g). The respiratory exchange ratio, an indicator of whole body substrate preference, and energy expenditure expressed as kJ per mouse per day were not significantly different in AdrKO compared to controls (Figure 4a,b). Food intake of AdrKO was also normal (data not shown). However, a modest reduction in physical activity expressed as X-beam breaks/h was observed in the dark phase in AdrKO (Figure 4c).
Figure 4.

Comparison of energy expenditure and insulin sensitivity in male adropin knockout mice (AdrKO) and controls. (a) Respiratory exchange ratio (RER), (b) energy expenditure, and (c) mean hourly movements in the X-axis in 8-week-old control wild-type (WT, n = 8) and AdrKO mice (n = 7). Data shown are the mean of measurements recorded over 48 h, and are presented as mean for the lights-on and dark periods. There was no significant difference in RER or energy expenditure, the reduction in movement of AdrKO in the dark period was statistically significant (*P < 0.05). (d–g) Results from the hyperinsulinemic–euglycemic clamp comparing insulin function in WT (n = 8) and AdrKO mice (n = 9). Insulin was infused to generate a physiological increase in (d) serum insulin, and glucose was infused at a variable rate to maintain (e) euglycemia. The glucose infusion rate (GIR) was significantly lower in (f) AdrKO (*P < 0.05). Glucose uptake was reduced by 30–35% in gastrocnemius and diaphragm muscle, but was normal in other (g) muscle types and organs. (h–j) Insulin stimulation of Akt phosphorylation is normal in the liver of AdrKO. (h) Representative western blots showing phosphorylation of Akt on threonine 308 (pAkt, T308), serine 473 (pAkt, S473), and total Akt protein. β-Actin levels were assessed as a control for loading. Quantification of (i) T308 and (j) S473 phosphorylation, expressed as a ratio of total Akt protein (n = 3–5 per group).
Fasted AdrKO exhibit hyperinsulinemia and hypertriglyceridemia
Analysis of the blood chemistries of 8–10-week AdrKO and WT controls suggests mild fasting hyperinsulinemia, hyperglycemia, and increased fasting triglycerides (Table 1). However, while chow-fed AdrKO displayed fasting hyperglycemia, they were not glucose intolerant (baseline blood glucose for WT, 147 ± 8; for AdrKO, 171 ± 16; area under the curve for blood glucose during the glucose tolerance test for WT, 285 ± 44; AdrKO, 267 ± 50; n = 10 for WT, n = 5 for AdrKO).
Table 1.
Blood chemistries of samples collected from AdrKO (n = 8) and WT littermates (n = 7) collected after an overnight fast
| WT | AdrKO | Student’s t-test | |
|---|---|---|---|
| Insulin (pg/ml) | 304 ± 33 | 462 ± 67 | P = 0.06 |
| Serum glucose (mg/dl) | 160 ± 4 | 179 ± 7 | P < 0.05 |
| Triglyceride (mg/dl) | 36 ± 3 | 57 ± 8 | P = 0.05 |
| Cholesterol (mg/dl) | 67 ± 2 | 70 ± 3 | n.s. |
| FFA (mmol/l) | 1.05 ± 0.07 | 0.98 ± 0.14 | n.s. |
AdrKO, adropin knockout mice; FFA, free-fatty acid; WT, wild type.
Data are mean ± SEM.
Attenuated suppression of endogenous glucose production (EndoRa) by insulin in AdrKO
Whole body insulin sensitivity was assessed using the hyperin-sulinemic– euglycemic clamp method in conscious AdrKO and WT (17). After a 3 h fast, infusion of insulin (2 mU/kg/min) resulted in a state of moderate hyperinsulinemia (Figure 4d). Glucose was infused at a variable rate sufficient to maintained euglycemia (Figure 4e). The glucose infusion rate required for maintaining serum glucose at 120 mg/dl was significantly lower in AdrKO compared to controls during the steady state (Figure 4f and Table 2). Glucose uptake (Rg) was moderately reduced (25–40%) in some muscle groups (gastrocnemius and diaphragm) (Figure 4g). However, glucose uptake in brain, cardiac muscle, and adipose tissue was normal in AdrKO (Figure 4g, data not shown).
Table 2.
Glucose infusion rate (GIR) and rate of endogenous glucose production (EndoRa) of WT and AdrKO mice
| WT | AdrKO | P value | |
|---|---|---|---|
| GIR | 33.4 ± 3.8 | 19.3 ± 2.0 | <0.01 |
| EndoRa–basal | 24.1 ± 1.1 | 21.1 ± 0.8 | <0.05 |
| EndoRa–clamp | 8.6 ± 3.8 | 15.7 ± 1.7 | 0.10 |
| Delta (EndoRa) | 14.9 ± 3.5 | 4.3 ± 1.8 | <0.05 |
The units for all data are mg/kg/min.
AdrKO, adropin knockout mice; WT, wild type.
EndoRa was modestly (12.5%) but significantly reduced in AdrKO when assessed in basal conditions (Table 2). During clamp conditions, there was a tendency (P = 0.01) for an increase (1.8-fold) in EndoRa in AdrKO (Table 2). Calculation of delta EndoRa by subtracting EndoRa in clamp conditions from basal indicated a marked (75–80%) reduction in the ability of insulin to suppress EndoRa (Table 2). These data suggest that the insulin resistance observed in AdrKO is partial, and is primarily due to impaired suppression of EndoRa with a modest effect on insulin-stimulated glucose uptake in nonhepatic tissues.
Normal insulin signaling in the liver of AdrKO
The hyperinsulinemic–euglycemic clamp data suggests hepatic insulin resistance. To investigate this possibility at a molecular level, we measured insulin-stimulated phosphorylation of Akt on threonine 308 (T308) and serine 473 (S473) in WT and AdrKO at a similar age (10 months) to those used for the clamp experiments (Figure 4h–j). The AdrKO mice used in this experiment were matched for body weight relative to controls (36.7 ± 1.5 vs. 36.8 ± 1.6 g), but still displayed significantly elevated fasting blood glucose (174 ± 13 vs. 141 ± 7 mg/ dl, P < 0.05, n = 8 for WT, n = 7 for AdrKO). Mice were fasted overnight, and insulin (2 mU/g BW) or saline administered as a single intraperitoneal injection; liver tissue was collected for analysis 10 min following the injections. Compared to saline-treated control, a marked increase in phosphorylation was observed on T308 and S473 of Akt in WT mice 10 min after administration of insulin. A similar response was observed in AdrKO. AKT is a critical component of the insulin-receptor/ insulin-receptor substrate/phosphoinositide 3-kinase-signaling cascade, and regulates hepatic glucose and lipid metabolism through modulating the activity of FOXO1 (18). The impaired suppression of EndoRa observed in clamp conditions thus cannot explained by a reduction in the response of the insulin receptor signaling cascade to a pharmacological dose of insulin.
DIO is normal in adropin-deficient mice
The analysis of serum adropin and expression of the adropin transcript in liver indicate that regulation in fed conditions is influenced by dietary macronutrients. To investigate whether adropin has a role in energy homeostasis in situations where dietary fat content is increased, we compared the response to challenge with HFD in 8-week old AdrKO, AdrHET, and controls (n = 6/group). Male B6 mice are commonly used as a model of DIO and insulin resistance (19). Male WT, AdrHET, and AdrKO all exhibited weight gain when fed HFD, and genotype had no significant effect on this response (Figure 5a). Food intake recorded over 1 month was also not significantly different between genotypes (Figure 5b). We also examined weight gain of female AdrKO and WT controls fed a HFD for 8 weeks. As with studies using male mice, weight gain was not significantly different between genotype (weight gain of WT, 13.8 ± 0.9 g; of AdrKO, 11.9 ± 0.6 g). Loss of adropin production thus has no impact on the effect of HFD on weight gain.
Figure 5.

Adropin-deficiency does not affect weight gain associated with high-fat diets, but is associated with an increased severity of impaired glucose homeostasis associated with obesity. (a) Body composition of wild-type control (WT), heterozygous carriers of the null adropin allele (HET) and adropin knockout (KO) mice weaned onto chow, and then after 8 weeks on the high-fat diet (60% kJ/fat, HFD) (n = 6/group). Exposure to the HFD resulted in weight gain predominantly due to increased fat mass. Body weight and composition were not significantly different after 8 weeks on HFD; at the start of the study, there was a tendency (P = 0.07) for increased fat mass in adropin knockout mice. (b) Food intake expressed as kJ/day was not significantly affected by genotype. Food intake was recorded over a 1 month period. (c–e) Insulin and glucose measurements recorded at the end of 8 weeks on HFD. Hyperinsulinemia and hyperglycemia were more severe in adropin knockout mice relative to WT. The differences in insulin, blood glucose and homeostasis model assessment–insulin resistance (HOMAIR) between WT and KO were significant (*P < 0.05, **P < 0.001). The differences in insulin, blood glucose, and HOMAIR between HET and KO were not statistically significant. (e) Adropin knockout mice exhibited fasting hypertriglyceridemia (*P < 0.05 vs. WT). (f, g) Impaired glucose tolerance associated with diet-induced obesity is more severe in heterozygous and homozygous carriers of the null adropin allele. Shown are the raw data (f, P < 0.05 when comparing WT vs. *KO only, **WT vs. KO and HET, #WT vs. HET only) and the area under the curve (AUC) above baseline levels (g, *P < 0.05 vs. WT). (h, i) Insulin tolerance tests suggest reduced insulin action in AdrKO carriers of the null adropin allele fed high-fat diet. *P < 0.05, WT vs. KO.
Increased severity of impaired glucose tolerance and hepatic steatosis with DIO in adropin-deficient mice
In contrast to WT mice, fasting hyperinsulinemia and hyperglycemia associated with weight gain were more severe in AdrKO (Figure 5c–e). There was also a suggestion of a gene-dosage effect, with AdrHET exhibiting an intermediate phenotype (Figure 5c–e). Fasting Triglycerides were significantly increased in AdrKO (Figure 5e). Glucose tolerance was also significantly affected by genotype, and was more severely impaired in AdrKO and AdrHET (Figure 5f,g). Assessment of insulin action using an insulin tolerance test suggested impaired insulin sensitivity, with blood glucose levels being significantly higher 15 min after the injection of insulin (Figure 5h). However, when assessed as a decline from baseline glucose levels there was no significant effect of genotype (Figure 5i).
Liver lipid and triglyceride content were significantly increased in AdrHET and AdrKO (Figure 6a,b). Hyperinsulinemia promotes hepatic lipogenesis at least partially through the stimulation of sterol-regulatory element binding factor-1c (Srebf1c), which regulates the expression of lipogenic enzymes (20). Srebf1c mRNA was increased in liver of AdrHET and AdrKO, the only enzyme measured showing a significant increase was stearoyl Co-A desaturase-1 (Scd1), a key enzyme in the synthesis of monounsaturated fatty acids involved in the production of very low density lipoproteins (21) (Figure 6c).
Figure 6.

Increased hepatic lipid content and expression of lipogenic genes in adropin knockout mice (AdrKO)-fed high-fat diet (HFD). (a) Total lipid and triglyceride (TG) content (per g wet weight) of liver samples collected from fasted wild type (WT), heterozygous (HET), and homozygous carriers (KO) of the null adropin allele. *P < 0.05 vs. WT. (b) Histological analysis of the liver phenotye of WT mice with AdrKO fed HFD. (c) Expression of genes involved in lipid and carbohydrate metabolism in livers of WT, HET, and KO mice. The expression of stearoyl-CoA desaturase-1 (SCD1) and sterol-regulatory element-binding protein-1c (SREBP1C) was significantly affected by genotype. ACC1, acetyl-CoA carboxylase; CPT1, carnitine palmitoyl transferase-1; FAS, fatty acid synthase; G6p, glucose-6-phosphatase; LPL, lipoprotein lipase; PEPCK, phosphoenolpyruvate carboxykinase; PPARα, peroxisome proliferator- activated receptor α.
DISCUSSION
These results provide further support for the hypothesis that adropin is a peptide hormone involved in regulating metabolic homeostasis. While demonstrating that adropin in circulation may act as a hormonal signal of metabolic status and dietary macronutrients, these studies do not rule out a role for adropin acting as an autocrine/paracrine factor. Moreover, the functions of adropin expressed in the central nervous system likewise remain to be determined. The second finding is that adropin deficiency has a negative impact on glucose homeostasis, and is associated with attenuated suppression of EndoRa by insulin. The liver of AdrKO display a more pronounced steatosis and increased expression of genes involved in hepatic triglyceride production. Adropin deficiency was also associated with increased fat mass. Assessment of food intake and energy expenditure suggests that the impact of adropin deficiency on insulin action and fat mass is not due to altered food intake.
The suggestion that adropin functions as a peptide hormone was based on the detection of FLAG-immunoreactivity in mice infected with an adenoviral vector expressing an adropin open reading frame linked to a c-terminal FLAG (10). Recently, it was reported that adropin is detectable using a different ELISA in human serum, with normal male subjects having levels of adropin around 6 ng/ml (12). The current results provide further evidence for an endocrine role, and are the first measurements of the endogenous adropin peptide in serum from mice. Adropin circulates in chow-fed mice at levels ranging from 4 to 60 ng/ml, or 1–10 nmol/l assuming a molecular weight of 4.5 kDa for the secreted protein (adropin34–76). The effects of fasting, feeding and the ingestion of refined diets with either high-fat low carbohydrate or low-fat high carbohydrate content are remarkably similar to the regulation exhibited by the adropin transcript in liver. A high degree of variability in serum adropin levels was observed in chow-fed mice. The reason for this variability is not clear at this time. However, as expression of the adropin transcript in liver exhibits rapid regulation by fasting and refeeding (10), it is possible that differences in food intake preceding sample collection may result in large fluctuations in adropin levels in the circulation. Further studies are clearly required to analyze the kinetics of adropin clearance from the circulation, and to investigate the mechanisms involved in the response of adropin to altered metabolic status.
The hypothesis that the liver is the primary source of adropin is based on the high level of expression of the transcript in the liver, and the similarities in the regulation of hepatic gene expression and serum adropin levels. Expression of the adropin transcript in liver is reduced with fasting, and is stimulated by food intake (10); a similar pattern of regulation of serum adropin was observed in the present study. It is, however, not possible to state conclusively that the liver is the only source of adropin in the circulation. Future studies involving tissue-specific deletion of the adropin coding sequence are required to investigate the source of circulating adropin.
Our analysis of the expression of the adropin transcript in liver and serum adropin in fed and fasting conditions indicates that the regulation is complex and likely involves a response to signals of metabolic state and dietary macronutrients. At one level, signals of fasted or fed stated are involved; fasting is associated with low expression of the transcript and negligible levels in serum. In fed conditions, these data suggest an additional level of regulation by dietary macronutrients. In mice fed a chow diet or the HFD, levels of adropin in serum are high. However, short- or long-term exposure to the LFD diet has an inhibitory effect on serum adropin levels when compared to chow-fed animals. While we can only speculate at this time, one possible explanation is that the source of carbohydrate impacts on adropin levels in serum. Carbohydrate is the major source of energy in both the chow diet (58% of the energy in the diet) and the purified LFD (70%) used for these experiments. However, chow is a high fiber diet containing a complex mix of agricultural byproducts such as ground up corn, soybean meal, oats, yeast, alfalfa. Chow contains a mix of complex carbohydrates, with a low content of sucrose (<4%) and fructose (<1%). In contrast, sucrose is a major source of energy in the LFD used for these studies, providing 35% of the energy in the diet. It is also interesting to note that in fed conditions, the expression of the adropin transcript and levels in sera are higher in situations where hepatic lipogenesis would be predicted to be reduced (e.g., ingestion of high-fat diets), and low in situations where hepatic lipogenesis is stimulated (e.g., ingestion of a high-sucrose diet, stimulation of LXRα) (10). Future studies investigating the regulation of serum adropin by dietary macronutrients, and determining whether adropin therapy can reduce atherogenic dyslipidemia associated with the ingestion of refined sugars such as sucrose and fructose, are clearly warranted.
The second objective of these studies was to investigate the overall phenotype of adropin-deficient mice, and to determine whether adropin-deficiency affects metabolic homeostasis. The phenotype of adropin-deficient mice suggests functions related to nutrient partitioning and insulin sensitivity, with no evidence that adropin is required for growth. Adropin-deficiency is associated with insulin resistance affecting both EndoRa and disposal, and is also associated with dyslipidemia. We also observed evidence of increased mortality in both homozygous and heterozygous carriers of the null allele before weaning. Whether this occurs in utero or as neonates (or both) was not determined. The mechanism explaining the increase in mortality is likewise unclear. Based on studies showing a role for adropin in regulating vascularization (11), and altered levels of adropin in sera of patients with heart failure (12), we can speculate that deficits in cardiovascular development could be one factor causing increased mortality.
A modest reduction in physical activity was also observed in AdrKO. We previously observed an increase in physical activity of transgenic mice expressing adropin controlled by a β-actin promoter (10). The current data thus provide evidence for a bidirectional response of locomotor behavior to overexpression or deletion of the adropin. The mechanism explaining this behavioral phenotype is not clear, but could involve actions in the central nervous system. Interestingly, adropin is expressed in regions of the brain that could regulate complex behaviors including circadian rhythms and feeding-associated reward (10).
Obesity due to genetic mutation or a failure to maintain homeostasis when challenged chronically with calorie-dense diets disrupts the normal regulation of adropin. The phenotype of AdrKO indicates the loss of adropin production in obesity may be a factor in the deterioration of metabolic homeostasis. The response of adropin-deficient mice to high-fat diets is also of interest. Specifically, the increased propensity of carriers of the null allele to develop impaired glucose tolerance when challenged with HFD suggests that adropin has an important function in maintaining glucose tolerance. The increase in propensity is not due to altered food intake or differences in weight gain. The observation that partial loss of function increases risk of developing insulin resistance and impaired glucose tolerance in situations where genetic susceptibility or environment exists is particularly important. Genetic variations that have subtle effects on the activity of gene encoding adropin may therefore confer increased susceptibility to type 2 diabetes.
It is possible that the modest increase in adiposity observed in AdrKO might contribute to insulin resistance in chow-fed conditions. However, a significant reduction in glucose infusion rate was still observed when AdrKO and controls matched for body weight were compared. While the data obtained from the clamp experiments indicating that the insulin resistance may be primarily hepatic, no difference in insulin-stimulation phosphorylation of Akt was evident. Several explanations for this discrepancy are possible. During the hypeinsulinemic–euglycemic clamp, the infusion of insulin at 2.5 mU/kg BW/ min resulted in a moderate physiological increase in insulin levels (from between 1.5–2 ng/ml and 5–6 ng/ml). The dose of insulin used to investigate insulin signaling, while similar to those previously, was higher (2 mU/g BW), and likely results in a pharmacological “spike” in insulin levels. It is thus possible that at this dose any moderate insulin resistance would not be evident. Indeed, we have observed that stimulation of pAkt(S473) is still evident in mice displaying severe obesity and hepatomegaly when using a similar dose of insulin (15). Another possible explanation is that the site of insulin resistance is not hepatic. The intestine and kidneys can be a significant source of glucose when hepatic output is compromised (22,23). Finally, adropin has been hypothesized to have a significant role in cardiovascular function and vascularization (11,12). Proper vascularization has an important role in islet function, and in transport of insulin to myocytes (24). Further investigation of the development and health of the vasculature of AdrKO may therefore be informative not only for investigating potential mechanisms explaining mortality up to the age of weaning.
Another important observation was the response of AdrKO to HFD. DIO was not significantly affected by genotype. However, the impact of DIO on fasting hyperinsulinemia and glucose intolerance was more severe in AdrKO and AdrHET. This observation suggests that the interaction of adropin deficiency and obesity has a deleterious impact on glucose homeostasis. The more pronounced impaired glucose tolerance observed in AdrKO and AdrHET fed HFD may indicate a deterioration of β-cell function. Further impairment of insulin-stimulated glucose disposal in AdrKO and AdrHET is unlikely, as male B6 mice develop insulin resistance in muscle and adipose tissue as early as 3 weeks after ingestion of HFD (25).
The liver is known to produce peptide hormones regulated by signals of metabolic state. These hormones are pleiotropic, with functions ranging from the regulation of growth to the control of lipid and glucose metabolism. Important examples are the insulin-like growth factor/insulin-like growth factor binding proteins that regulate growth, amino acid, and glucose metabolism (26) and fibroblast growth factor-21 that mediates an endocrine response to fasting (27,28). When compared to these hormones, adropin is unique in terms of evolution and regulation. In silico analysis of the National Center for Biotechnology Information (NCBI) adropin open reading frame in the NCBI databases indicates a protein highly conserved in eutherian mammals, with no compatible sequence observed in the metatherian, reptilian, or avian genomes. This observation may indicate that the evolution of the adropin coincided with the development of the true placenta, and that the functions of adropin are related specifically to the life history of placental mammals.
In summary, these results provide further indication of the significance of adropin in maintaining glucose homeostasis. Adropin deficiency also impacts on lipid metabolism, and is association with dyslipidemia and increased propensity for hepatic steatosis. The phenotype observed in heterozygous carriers of a null gene indicates that partial loss of function could have a significant impact on metabolic health. Adropin-deficiency associated with the consumption of diets with a high content of simple carbohydrates or obesity may increase risk for the development of insulin resistance and diseases of the Metabolic Syndrome.
Acknowledgments
We thank Dr Danielle Skorupa for assistance with manuscript production. This work was supported provided by grants from the American Diabetes Association (1-04-JF09 and 07-08-RA-16), The Pennington Biomedical Research Foundation, a sponsored research agreement from Biomeasure, Inc. IPSEN, and the State of Florida to A.A.B.; Vanderbilt MMPC DK59637 and Vanderbilt Diabetes Research and Training Center DK020693. A.A.B. and R.L.M. were partially supported provided by the Clinical Nutrition Research Unit Center Grant (1P30 DK072476) entitled “Nutritional Programming: Environmental and Molecular Interactions” sponsored by National Institute of Diabetes and Digestive and Kidney Diseases.
Footnotes
DISCLOSURE
The authors declared no conflict of interest.
References
- 1.ADA. Economic costs of diabetes in the U.S. In 2007. Diabetes Care. 2008;31:596–615. doi: 10.2337/dc08-9017. [DOI] [PubMed] [Google Scholar]
- 2.Huang ES, Basu A, O’Grady M, Capretta JC. Projecting the future diabetes population size and related costs for the U. S. Diabetes Care. 2009;32:2225–2229. doi: 10.2337/dc09-0459. [DOI] [PMC free article] [PubMed] [Google Scholar]
- 3.D’Alessio DA, Hirsch IB. Glycemic management of type 2 diabetes. In: Robertson RP, Powers AC, editors. Translational Endocrinology & Metabolism. Chevy Chase: The Endocrine Society; 2011. pp. 69–94. [Google Scholar]
- 4.Kotronen A, Yki-Jarvinen H. Fatty liver: a novel component of the metabolic syndrome. Arterioscler Thromb Vasc Biol. 2008;28:27–38. doi: 10.1161/ATVBAHA.107.147538. [DOI] [PubMed] [Google Scholar]
- 5.Perlemuter G, Bigorgne A, Cassard-Doulcier AM, Naveau S. Nonalcoholic fatty liver disease: from pathogenesis to patient care. Nat Clin Pract Endocrinol Metab. 2007;3:458–469. doi: 10.1038/ncpendmet0505. [DOI] [PubMed] [Google Scholar]
- 6.Satapathy SK, Sanyal AJ. Novel treatment modalities for nonalcoholic steatohepatitis. Trends Endocrinol Metab. 2010;21:668–675. doi: 10.1016/j.tem.2010.08.003. [DOI] [PubMed] [Google Scholar]
- 7.Barrera JG, Sandoval DA, D’Alessio DA, Seeley RJ. GLP-1 and energy balance: an integrated model of short-term and long-term control. Nat Rev Endocrinol. 2011;7:507–516. doi: 10.1038/nrendo.2011.77. [DOI] [PMC free article] [PubMed] [Google Scholar]
- 8.Kliewer SA, Mangelsdorf DJ. Fibroblast growth factor 21: from pharmacology to physiology. Am J Clin Nutr. 2010;91:254S–257S. doi: 10.3945/ajcn.2009.28449B. [DOI] [PMC free article] [PubMed] [Google Scholar]
- 9.Field BC, Chaudhri OB, Bloom SR. Bowels control brain: gut hormones and obesity. Nat Rev Endocrinol. 2010;6:444–453. doi: 10.1038/nrendo.2010.93. [DOI] [PubMed] [Google Scholar]
- 10.Kumar KG, Trevaskis JL, Lam DD, et al. Identification of adropin as a secreted factor linking dietary macronutrient intake with energy homeostasis and lipid metabolism. Cell Metab. 2008;8:468–481. doi: 10.1016/j.cmet.2008.10.011. [DOI] [PMC free article] [PubMed] [Google Scholar]
- 11.Lovren F, Pan Y, Quan A, et al. Adropin is a novel regulator of endothelial function. Circulation. 2010;122:S185–S192. doi: 10.1161/CIRCULATIONAHA.109.931782. [DOI] [PubMed] [Google Scholar]
- 12.Lian W, Gu X, Qin Y, Zheng X. Elevated plasma levels of adropin in heart failure patients. Intern Med. 2011;50:1523–1527. doi: 10.2169/internalmedicine.50.5163. [DOI] [PubMed] [Google Scholar]
- 13.Ostrowski LE, Yin W, Rogers TD, et al. Conditional deletion of dnaic1 in a murine model of primary ciliary dyskinesia causes chronic rhinosinusitis. Am J Respir Cell Mol Biol. 2010;43:55–63. doi: 10.1165/rcmb.2009-0118OC. [DOI] [PMC free article] [PubMed] [Google Scholar]
- 14.Lakso M, Pichel JG, Gorman JR, et al. Efficient in vivo manipulation of mouse genomic sequences at the zygote stage. Proc Natl Acad Sci USA. 1996;93:5860–5865. doi: 10.1073/pnas.93.12.5860. [DOI] [PMC free article] [PubMed] [Google Scholar]
- 15.Sutton GM, Trevaskis JL, Hulver MW, et al. Diet-genotype interactions in the development of the obese, insulin-resistant phenotype of C57BL/6J mice lacking melanocortin-3 or -4 receptors. Endocrinology. 2006;147:2183–2196. doi: 10.1210/en.2005-1209. [DOI] [PMC free article] [PubMed] [Google Scholar]
- 16.Kim HJ, Higashimori T, Park SY, et al. Differential effects of interleukin-6 and -10 on skeletal muscle and liver insulin action in vivo. Diabetes. 2004;53:1060–1067. doi: 10.2337/diabetes.53.4.1060. [DOI] [PubMed] [Google Scholar]
- 17.Ayala JE, Bracy DP, McGuinness OP, Wasserman DH. Considerations in the design of hyperinsulinemic-euglycemic clamps in the conscious mouse. Diabetes. 2006;55:390–397. doi: 10.2337/diabetes.55.02.06.db05-0686. [DOI] [PubMed] [Google Scholar]
- 18.Cheng Z, White MF. Targeting Forkhead box O1 from the concept to metabolic diseases: lessons from mouse models. Antioxid Redox Signal. 2011;14:649–661. doi: 10.1089/ars.2010.3370. [DOI] [PMC free article] [PubMed] [Google Scholar]
- 19.Collins S, Martin TL, Surwit RS, Robidoux J. Genetic vulnerability to diet-induced obesity in the C57BL/6J mouse: physiological and molecular characteristics. Physiol Behav. 2004;81:243–248. doi: 10.1016/j.physbeh.2004.02.006. [DOI] [PubMed] [Google Scholar]
- 20.Horton JD, Goldstein JL, Brown MS. SREBPs: activators of the complete program of cholesterol and fatty acid synthesis in the liver. J Clin Invest. 2002;109:1125–1131. doi: 10.1172/JCI15593. [DOI] [PMC free article] [PubMed] [Google Scholar]
- 21.Lam TK, Gutierrez-Juarez R, Pocai A, et al. Brain glucose metabolism controls the hepatic secretion of triglyceride-rich lipoproteins. Nat Med. 2007;13:171–180. doi: 10.1038/nm1540. [DOI] [PubMed] [Google Scholar]
- 22.Mutel E, Gautier-Stein A, Abdul-Wahed A, et al. Control of blood glucose in the absence of hepatic glucose production during prolonged fasting in mice: induction of renal and intestinal gluconeogenesis by glucagon. Diabetes. 2011;60:3121–3131. doi: 10.2337/db11-0571. [DOI] [PMC free article] [PubMed] [Google Scholar]
- 23.Mutel E, Abdul-Wahed A, Ramamonjisoa N, et al. Targeted deletion of liver glucose-6 phosphatase mimics glycogen storage disease type 1a including development of multiple adenomas. J Hepatol. 2011;54:529–537. doi: 10.1016/j.jhep.2010.08.014. [DOI] [PubMed] [Google Scholar]
- 24.Richards OC, Raines SM, Attie AD. The role of blood vessels, endothelial cells, and vascular pericytes in insulin secretion and peripheral insulin action. Endocr Rev. 2010;31:343–363. doi: 10.1210/er.2009-0035. [DOI] [PMC free article] [PubMed] [Google Scholar]
- 25.Park SY, Cho YR, Kim HJ, et al. Unraveling the temporal pattern of diet-induced insulin resistance in individual organs and cardiac dysfunction in C57BL/6 mice. Diabetes. 2005;54:3530–3540. doi: 10.2337/diabetes.54.12.3530. [DOI] [PubMed] [Google Scholar]
- 26.LeRoith D, Yakar S. Mechanisms of disease: metabolic effects of growth hormone and insulin-like growth factor 1. Nat Clin Pract Endocrinol Metab. 2007;3:302–310. doi: 10.1038/ncpendmet0427. [DOI] [PubMed] [Google Scholar]
- 27.Inagaki T, Dutchak P, Zhao G, et al. Endocrine regulation of the fasting response by PPARalpha-mediated induction of fibroblast growth factor 21. Cell Metab. 2007;5:415–425. doi: 10.1016/j.cmet.2007.05.003. [DOI] [PubMed] [Google Scholar]
- 28.Badman MK, Pissios P, Kennedy AR, et al. Hepatic fibroblast growth factor 21 is regulated by PPARalpha and is a key mediator of hepatic lipid metabolism in ketotic states. Cell Metab. 2007;5:426–437. doi: 10.1016/j.cmet.2007.05.002. [DOI] [PubMed] [Google Scholar]