Abstract
Collaborative information systems (CISs) are deployed within a diverse array of environments that manage sensitive information. Current security mechanisms detect insider threats, but they are ill-suited to monitor systems in which users function in dynamic teams. In this paper, we introduce the community anomaly detection system (CADS), an unsupervised learning framework to detect insider threats based on the access logs of collaborative environments. The framework is based on the observation that typical CIS users tend to form community structures based on the subjects accessed (e.g., patients’ records viewed by healthcare providers). CADS consists of two components: 1) relational pattern extraction, which derives community structures and 2) anomaly prediction, which leverages a statistical model to determine when users have sufficiently deviated from communities. We further extend CADS into MetaCADS to account for the semantics of subjects (e.g., patients’ diagnoses). To empirically evaluate the framework, we perform an assessment with three months of access logs from a real electronic health record (EHR) system in a large medical center. The results illustrate our models exhibit significant performance gains over state-of-the-art competitors. When the number of illicit users is low, MetaCADS is the best model, but as the number grows, commonly accessed semantics lead to hiding in a crowd, such that CADS is more prudent.
Index Terms: Privacy, social network analysis, data mining, insider threat detection
1 Introduction
Collaborative information systems (CISs) allow groups of users to communicate and cooperate over common tasks. They have long been called upon to support and coordinate activities related to the domain of “computer supported and cooperative work” [4], [16]. Recent breakthroughs in networking, storage, and ubiquitous computing have facilitated an explosion in the deployment of CIS across a wide range of environments. Beyond computational support, the adoption of CIS has been spurred on by the observation that such systems can increase organizational efficiency through streamlined workflows [3], shave administrative costs [15], assist innovation through brainstorming sessions [22], and facilitate social engagement [55]. On the Internet, for instance, the notion of CIS is typified in wikis, video conferencing, document sharing and editing, as well as dynamic bookmarking [19].
At the same time, CIS are increasingly relied upon to manage sensitive information [23]. Intelligence agencies, for example, have adopted CIS to enable timely access and collaboration between groups of analysts [8], [9], [41] using data on personal relationships, financial transactions, and surveillance activities. Additionally, hospitals have adopted electronic health record (EHR) systems to decrease health-care costs, strengthen care provider productivity, and increase patient safety [34], using vast quantities of personal medical data. However, at the same time, the detail and sensitive nature of the information in such CIS make them attractive to numerous adversaries. This is a concern because the unauthorized dissemination of information from such systems can be catastrophic to both the managing agencies and the individuals (or organizations) to whom the information corresponds.
It is believed that the greatest security threat to information systems stems from insiders [42], [44], [48], [52]. In this work, we focus on the insider threat to centralized CIS which are managed by a sole organization. A suspicious insider in this setting corresponds to an authenticated user whose actions run counter to the organization’s policies.
Various approaches have been developed to address the insider threat in collaborative environments. Formal access control frameworks, for instance, have been adapted to model team [17] and contextual scenarios [6], [27], [39]. Recognizing that access control is necessary, but not sufficient to guarantee protection, anomaly detection methods have been proposed to detect deviations from expected behavior. In particular, certain data structures based on network analysis [14], [21], [37] have shown promise. We review these models in depth in Section 5, but wish to highlight several limitations of these approaches up front. First, access control models assume a user’s role (or their relationship to a group) is known a priori. However, CIS often violate this principle because teams can be constructed on the fly, based on the shifting needs of the operation and the availability of the users (e.g., [33]). Second, the current array of access control and anomaly detection methods tend to neglect the metainformation associated with the subjects.
In this paper, we introduce a framework to detect anomalous insiders from the access logs of a CIS by leveraging the relational nature of system users as well as the metainformation of the subjects accessed. The framework is called the community anomaly detection system, or CADS, and builds upon the work introduced in [10]. This framework accounts for the observations that, in collaborative environments, users tend to be team and goal oriented [11]. In this context, an arbitrary user should exhibit similar behavior to other users based on their coaccess of similar subjects in the CIS.
There are several specific contributions of this work.
Relational patterns from access logs. We introduce a process to transform the access logs of a CIS into dynamic community structures using a combination of graph-based modeling and dimensionality reduction techniques over the accessed subjects. We further illustrate how metainformation, such as the semantics associated with subjects, can be readily integrated into the CADS framework. We call this extended framework MetaCADS.
Anomaly detection from relational patterns. We propose a technique, rooted in statistical formalism, to measure the deviation of users within a CIS from the extracted community structures.
Empirical evaluation. We utilize a real-world data set to systematically evaluate the effectiveness of our anomaly detection framework. In particular, we study three months of real-world access logs from the electronic health record system of the Vanderbilt University Medical Center, a large system that is well integrated in the everyday functions of health-care. In lieu of labeled anomalous users, we simulate insider threat behavior and empirically demonstrate that our models are more effective in performance than the state-of-the-art competitive anomaly detection approaches. Our analysis provides evidence that the typical system user is likely to join a community with other users, whereas the likelihood that a simulated user will join a community is low. Our findings indicate the quantity of illicit insiders in the system influences which model (i.e., CADS or MetaCADS) is a more prudent solution.
This paper is organized as follows: in Section 2, we introduce CADS, the MetaCADS extension, and describe the specific community extraction and anomaly detection methods that we developed. In Section 3, we provide a detailed experimental analysis of our methods and illustrate how various facets of user behavior influence the likelihood of detection. In Section 4, we summarize the findings and discuss the limitations of the model. In Section 5, we present related research, with a particular focus on insider threat prevention and detection. Finally, we summarize the work and propose extensions in Section 6.
2 MetaCADS
This section begins with a high-level overview of the CADS framework. This is followed by a description of the empirical methods applied in the framework.
2.1 Overview of Framework
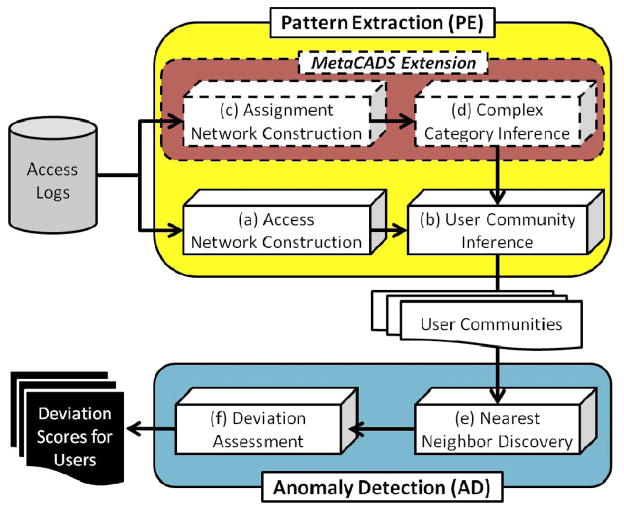
As depicted in Fig. 1, CADS consists of two primary components: 1) Pattern Extraction (CADS-PE) and 2) Anomaly Detection (CADS-AD).
Fig. 1.
An architectural overview of the CADS framework and the MetaCADS extension.
One of the challenges in working with CIS access logs is they do not explicitly document the social structure of the organization. In recognition of this deficiency, CADS-PE leverages the relations between users and subjects to infer communities. To accomplish this derivation, the access transactions are translated into a tripartite graph of users, who are mapped to subjects, who are mapped to semantic categories. This structure is transformed into a relational network of users, the edges of which are weighted by the similarity of subjects and categories accessed. The network is decomposed into a spectrum of patterns that represents the user communities as probabilistic models.
CADS-AD compares the behaviors of the users to the communities inferred by CADS-PE. Users found to deviate significantly from expected behavior are considered to be anomalous. To accomplish this assessment, the users are projected onto the spectrum of communities to compute the distance between each user and their neighbors in the network. The greater the distance between the user and their neighbors, the greater the likelihood that the user is anomalous.
The remainder of this section describes how each of these components is constructed in greater depth.
2.2 Notation
To formalize the problem, we use the following notation. Let U, S, and G be the set of users, subjects, and categories to which a subject can belong in the CIS, respectively. Let DB be a database of access transactions, such that db ∈ DB is a tuple of the form 〈u, s, G′, time〉, where u ∈ U, s ∈ S, G′ ⊆ G, and time is the timestamp associated with the access. We use cardinality |·| to represent the number of elements in a set.
2.3 Pattern Extraction
CADS-PE infers communities from the relationships observed between users and subjects’ records in the CIS access logs. The community extraction process consists of two primary steps: a) construction of the user-subject access network and b) user community inference. The MetaCADS extension incorporates two additional steps into the process: c) construction of the subject-category assignment network, and d) complex category inference. These steps are performed prior to user community inference.
2.3.1 Network Construction
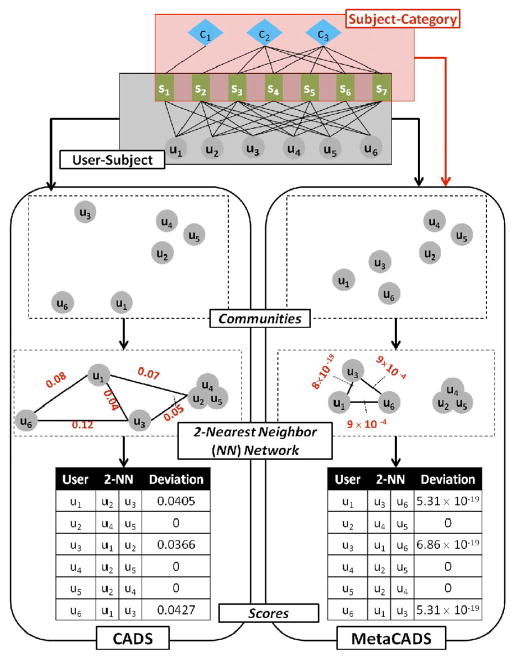
The extraction process begins by mapping T onto a tripartite graph, an example of which is depicted in Fig. 2. The graph represents the amalgamation of the user-subject access network and the subject-category assignment network. In the former, an edge represents that a user accessed the subject’s record. In the latter, an edge represents that the subject’s record is assigned to a particular category.
Fig. 2.
An illustration of the differences between CADS and MetaCADS.
For an arbitrary time period, the information in this graph is summarized in two binary matrixes A and B of size |S| × |U| and |G| × |S|, respectively.1 A(i, j) = 1 when uj accesses si, and 0 otherwise. B(i, j) is defined similarly for subjects and categories.
Prior research in social network analysis (e.g., [1], [11]) suggests it is important to represent the affinity that a user has toward a particular subject when assessing the similarity of a group. There are various aspects of a user’s relationship to subjects that could be leveraged for measuring similarity. To mitigate bias and develop a generic approach, we focus our attention on the number of subjects a user accessed. Using this feature, we employ the inverse document frequency (IDF) model, popularized by information retrieval systems and shown to be effective for weighting the affinity of individuals to subjects in friendship networks [1].
Based on this observation, A is transformed into matrix AI, where a cell in AI is defined as , such that C = ATA. This matrix models the affinity of a user to a subject relative to all subjects in the system. The less subjects that a user accesses, the greater the affinity of the user to these subjects.
For subjects and categories, MetaCADS builds matrices B and BI, which are similarly derived from A and AI.
2.3.2 Complex Category Inference
In prior anomaly detection models, communities are based on the access network at one time only. This is appropriate when the set of users in the system is static and collaborate over distinct subjects. However, in a CIS, the set of users (e.g., care providers) and subjects (e.g., patients) are constantly rotating through the system and represent a varying set of semantic categories (e.g., diagnoses). Thus, an anomaly detection should account for the dynamic nature of the system and the semantics of the subjects.
As such, MetaCADS extends CADS with a second spectral decomposition of the system, this time on the assignment network. This is accomplished by applying singular value decomposition2 (SVD) on the covariance matrix , where B* is the centered version of BI, such that
The assignment network is thus decomposed into ωΛυT, where ω and υ are orthonormal matrices, and Λ is a matrix with eigenvalues λ1, λ2, …, λσ on the diagonal and zeros elsewhere. We use σ = min(|S|, |G|) to represent the number of principal components in the system. The size of υT is σ × |G| and, each row of this matrix is a principal component, which we refer to as a complex category.
2.3.3 Community Inference
To infer user communities, CADS performs a spectral decomposition on a relational model of the users, which MetCADS extends to include complex categories. In preparation for the decomposition, CADS builds a matrix R = AITAI, which is based on the access network. By contrast, MetaCADS extends the model to incorporate the assignment network, where R = (AITAI)(AIT(υTBI)T), such that the ith row is the projection of user ui over the relational system.
Since users are represented as vectors, CADS uses cosine as the similarity measure and stores the results in a matrix R̂, such that , where Rx is the xth row vector in R.
CADS applies SVD over the covariance matrix , where R̂* is the centered version of R̂. In doing so, R̂ is represented as ω̂Λ̂υ̂T, where Λ̂ has eigenvalues λ̂1, λ̂2, …, λ̂μ on the diagonal and zeros elsewhere. We use μ = min(|U|, |S|, |G|) to represent the number of principle components. Recognizing that a certain portion of the decomposition corresponds to noise, CADS retains only the most informative principle components. Specifically, it retains the l principle components, such that
where τ is a prespecified threshold.
At this point, R̂ is projected into the new space to generate matrix Z = υ̂TR̂. This matrix implies the structure of the user communities, which CADS uses as the core patterns for anomaly detection.
2.4 Anomaly Detection
CADS-AD predicts which users in the CIS are anomalous by e) discovering a user’s nearest neighbors and f) calculating the deviation of each user from their neighbors.
2.4.1 Nearest Neighbor Discovery
To search for the k-nearest neighbors (KNNs) of a user, we adopt a modified euclidean distance. This measure weights the principal components proportionally to the amount of variance they cover in the system. These distances are stored in a matrix DIS of size |U| × |U|, where
indicates the distance between ui and uj.
Using this measure, we determine an appropriate value for k. This is accomplished by leveraging the network community profile (NCP), a characterization of community quality based on its size [29], [30]. In particular, k is set to the value that minimizes NCP as defined in Algorithm 1.
Algorithm 1.
Minimization of the network community profile
| Input: DIS, a distance matrix | |
| Output: k, the number of nearest neighbors | |
| 1: | k ← |U| {Initialize to all possible neighbors} |
| 2: | for i = 1 to |U| do |
| 3: | N = { } |
| 4: | for j = 1 to |U| do |
| 5: | N ← N ∪ i − nnj |
| {the i-nearest neighbor network for user uj} | |
| 6: | end for |
| 7: | for j = 1 to |U| do |
| 8: | if ψ(gj, N, i) < k then |
| 9: | k ← i {the conductance function} |
| 10: | end if |
| 11: | end for |
| 12: | end for |
Here, ψ corresponds the conductance, a measure designed to characterize network quality [24], [45]. Formally, let N be defined as in Line 5 of Algorithm 1 and let H be the union of the elements in N (i.e., the union of nodes and edges in the nearest neighbor networks). Then, for a subgraph g = (ng, eg) ∈ N, conductance is defined as
where Ng denotes the size of the edge boundary
and
such that deg(y) is the degree of node y.
For illustration, Fig. 3 depicts a small cellular network of Fig. 2. When the community size is set to 2, 3, and 4 vertices, there are three corresponding clusters: β, α, and γ with , respectively. Notice, ψ(α) < ψ(β) = ψ(γ), which implies that the set of vertices in α exhibits stronger community structure than those in β and γ.
Fig. 3.
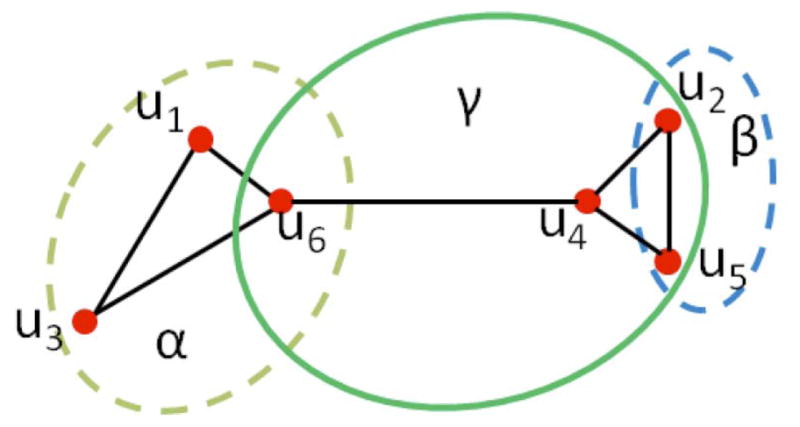
Example network with clusters α, β, and γ.
2.4.2 Measuring Deviation from Nearest Neighbors
The radius of a user ui is defined as the distance to its kth nearest neighbor excluding itself. Specifically, the radius of ui is ri = sort(DIS(i, :))(i, k + 1), where sort is a function that ranks distances in increasing order from smallest to largest. Users are thus characterized as a vector of radius r = [r1, r2, …, r|U|] and set of neighbors knn = [knn1, knn2, …, knn|U|]. The smaller the radius, the higher the density of the user’s network.
Anomalous users cannot be detected through radius alone and direct application of such a measure can lead to undesirable results. Consider, in Fig. 4, user uy and the users in cluster F can be correctly classified as anomalous based on their radius. In contrast, we would fail to detect ux as an anomaly because it has a smaller radius in comparison to nodes in the F area. This bias is due to a reliance on raw magnitudes and thus we normalize the system. Rather than use raw radius, we calculate the deviation of a node’s radius from those of its k-nearest neighbors to assess the degree to which it is anomalous.
Fig. 4.
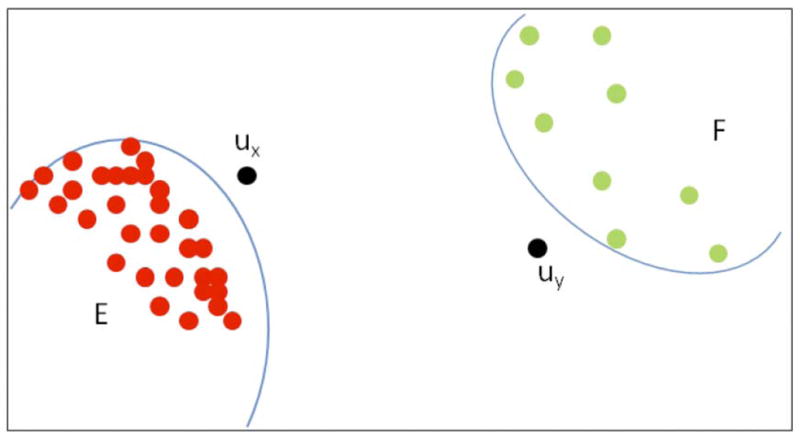
An illustration of the influence of radius size in nearest neighbor sets on anomaly detection.
For a user ui, we calculate the deviation of their radius as
where r̄ = Σuj∈knnirj/(k). Turning back to Fig. 4, the radius deviations of the nodes in area E are much smaller than those in F, such that the deviation of node ux is much larger that uy. Our hypothesis is that normal users are likely to exhibit significantly smaller radius deviation scores than abnormal users.
Returning to the running example, the bottom of Fig. 2 depicts the deviations and two nearest neighbors for each user in the system. Notice that u1, u3, and u6 receive larger deviation scores in CADS than they do in MetaCADS.
3 Experiments
3.1 Anomaly Detection Models
There are alternative anomaly detection models that have been proposed in the literature. Thus, in addition to CADS and MetaCADS, we evaluate three of the most related models. The first two are based on supervised classification and assume there exists a training set of anomalous and nonanomalous user class labels, whereas the final model is an unsupervised heuristic. For each of these models, we treat real and simulated users as nonanomalous and anomalous, respectively.
k-nearest neighbors [31]. This model predicts the label for a user based on their k-nearest neighbors in the training set. The labels are weighted based on the cosine similarity of each neighbor to the user. For this work, we measure similarity via the vectors of the AI matrix.
Principle components analysis (PCA) [47]. This model predicts if a user is closer to normal or abnormal users according to the weighted principal components model. The components are derived from the AI matrix.
High volume users (HVUs) [5]. This model is based on a rule invoked by privacy officials at several healthcare providers. It ranks users based on the number of subjects they accessed. The greater the number of subjects accessed, the higher the rank.
3.2 EHR Access Log Data Set
StarPanel is a longitudinal electronic patient chart developed and maintained by the Department of Biomedical Informatics faculty working with staff in the Informatics Center of the Vanderbilt University Medical Center [18]. StarPanel is ideal for this study because it aggregates all patient data as fed into the system from any clinical domain and is the primary point of clinical information management. The user interfaces are accessible on the medical center’s intranet and remotely accessible via the Internet. The system has been in operation for over a decade, is well integrated into the daily patient care workflows and healthcare operations, and illustrates collaborative behaviors [33]. In all, the EHR stores over 300,000,000 observations on over 1.5 million patient records.
We analyze the access logs of three months from the year 2010. When possible, the logs are embellished with diagnostic billing codes assigned to the patient after the visit to their healthcare provider. Access transactions are represented as 〈user, patient, date, diagnosis codes〉. These transactions were divided into two parts: 1) user-patient access transactions of the form 〈user, patient record, date〉 and patient-diagnosis transactions of the form 〈patient record, diagnose code, date〉. There are 863,733 access transactions and 520,598 diagnosis transactions in the analyzed data set. For simplicity, we refer to this as the EHR data set. For the experiments, we treat the patient records as subjects and the diagnosis codes as categories. We evaluate the anomaly detection models on a daily basis and report on the average performance.
The summary statistics of the EHR data set are depicted in Table 1. We observe the access network and assignment network in this data set are very sparse. For an arbitrary weekday, there are 1,006 patients, 4,208 users, 1,482 diagnosis codes, 4,609 diagnosis transactions, and 22,014 access transactions. In other words, only , or 0.5 percent of the possible user-patient edges and or 0.3 percent of the possible patient-diagnosis edges were observed.
TABLE 1.
Basic Statistics of the EHR Data Set
| ATTRIBUTE | VALUE |
|---|---|
| Months in study | 3 months |
| Users per day | 4,208 |
| Subjects per day | 1,006 |
| Diagnoses per day | 1,482 |
| Accesses of subjects per day | 22,014 |
| Assignments of diagnoses per day | 4,609 |
3.3 Deviation Score Distributions
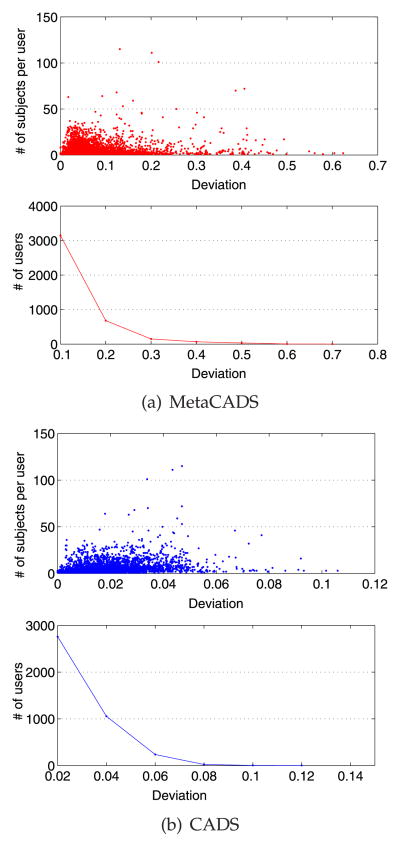
Fig. 5 provides an example of the deviation score distributions of MetaCADS and CADS on an arbitrary day of accesses in the EHR data set (see Section 3.2). There are several important aspects of the relationship between MetaCADS and CADS that we wish to highlight.
Fig. 5.
Distribution of user deviations on an arbitrary day in a real EHR data set.
First, the figure indicates that MetaCADS and CADS have significantly different distributions. In particular, MetaCADS exhibits larger deviations than CADS, which is a result of combining the access network and assignment network relations. This combination tends to lead to larger user communities.
Second, most users access only a small number of subjects. For instance, it is rare to see a user access more than 100 subjects.
Third, the majority of users’ deviations are relatively small. Nearly 98.7 percent of the users receive a deviation score less than 0.2 in MetaCADS, and less than 0.04 in CADS. In contrast to CADS, users with large deviations in the MetaCADS model are significantly farther from users with smaller deviations. For instance, in MetaCADS, most users’ deviations are less than 0.2, which is nearly four times smaller than the largest deviation of 0.7. In CADS, however, most deviations are less than 0.04, which is approximately two times smaller than the largest score of 0.1.
3.4 Simulation of Users
One of the challenges of working with real data from an operational setting is that it is unknown if there is abnormal behavior in the data set. Thus, to test the performance of the models, we designed an evaluation process that mixes simulated users with the real users of the EHR data set. We worked under the assumption that an anomalous user would not exhibit steady behavior. We believe that such a behavior is indicative of users that access patient records for malicious purposes, such as identity theft.
The evaluation is divided into three types of settings.
Sensitivity to number of records accessed
The first setting investigates how the number of subjects accessed by a simulated user influences the extent to which the user can be predicted as anomalous. In this case, we mix a lone simulated user into the set of real users. The simulated user accesses a set of randomly selected subjects, the size of which ranges from 1 to 120.
Sensitivity to number of anomalous users
The second setting investigates how the number of simulated users influences the rate of detection. In this case, we vary the number of simulated users from 0.5 to five percent of the total number of users, which we refer to as the mix rate (e.g., five percent implies 5 out of 100 users are simulated). Each of the simulated users access an equivalent-sized set of random subjects’ records.
Sensitivity to diversity
The third setting investigates a more diverse environment. In this case, we set the mix rate of simulated users and the total number of users as 0.5 to five percent. In addition, we allow the number of patients accessed by the simulated users to range from 1 to 150 in the EHR data set.
3.5 Setting the Neighborhood Parameter
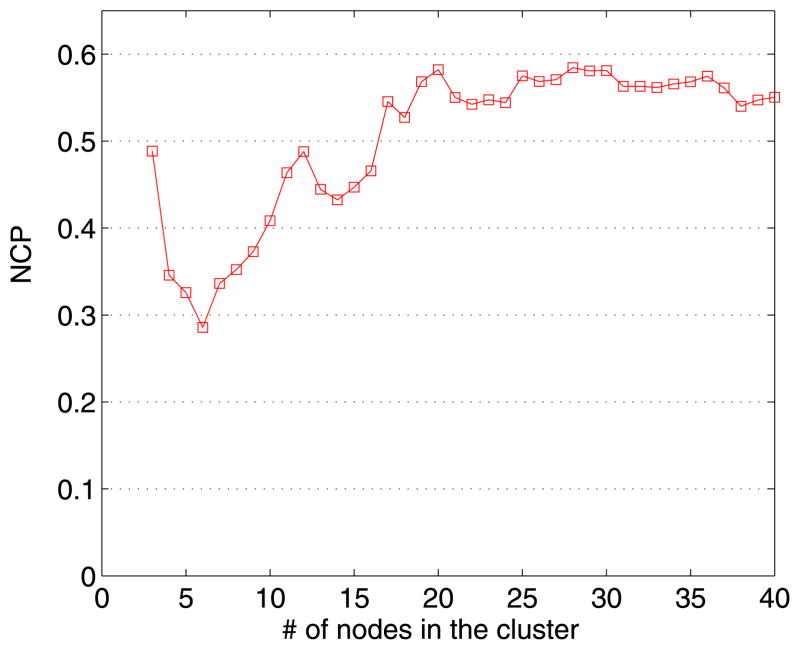
The community-based models incorporate a parameter k to modulate the community size. This parameter was tuned empirically using the network community profile. For (1), we set τ = 0.8. This is based on [46], which showed this value allows for reconstruction of the original network with minimal information loss. The result is depicted in Fig. 6, where it can be observed that NCP is minimized at six neighbors.
Fig. 6.
The NCP plot of network in the EHR data set.
For illustration purposes, Fig. 7 depicts the social network based on six-nearest neighbors from an arbitrary day of the study. Informally, it appears that most of the users exhibit community structures. For a more empirical perspective, we calculated the cluster coefficient [36] for every user, which yielded an average clustering coefficient 0.48. This score is significantly larger than the clustering coefficient of nearest neighbor networks that are generated randomly. We simulated such random networks and observed an average clustering coefficient of 0.001. This observation suggests that users in six-nearest neighbor networks are acting in a collaborative manner.
Fig. 7.
The six-nearest neighbor network for all users in an arbitrary day of the EHR data set.
3.6 Detection Performance Metrics
We measure the performance of the models using the receiver operating characteristic (ROC) curve. This is a plot of the true positive rate versus false positive rate for a binary classifier as its discrimination threshold is varied. The area under the ROC curve (AUC) reflects the relationship between sensitivity and specificity for a given test. A higher AUC indicates better overall performance. In the final two simulation settings, we report on the average AUC per simulation configuration.
3.7 Results
3.7.1 Varying Number of Accessed Subjects
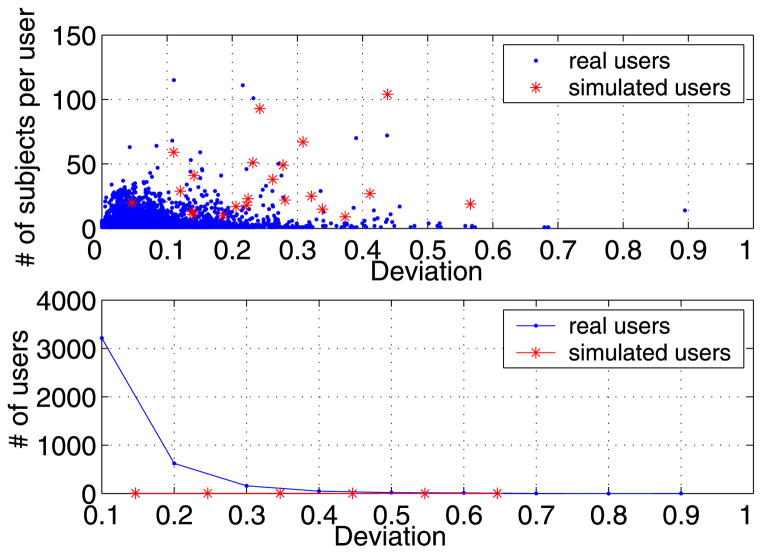
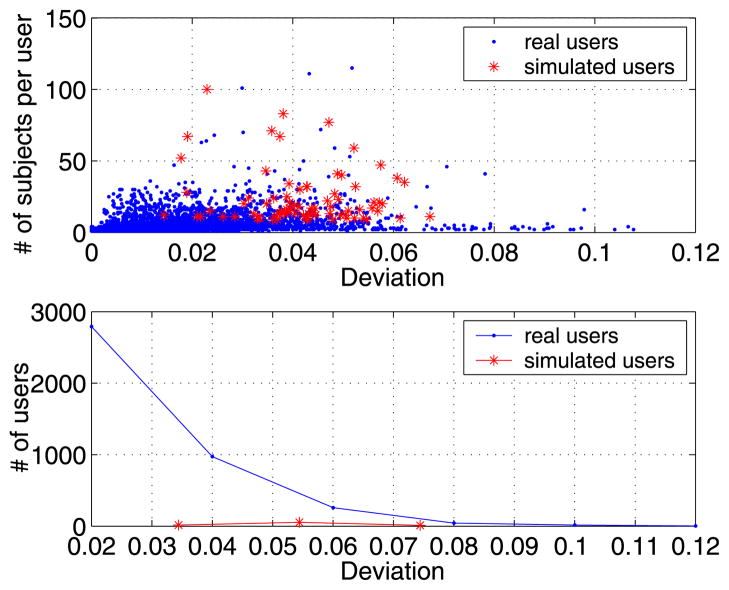
The first set of experiments focus on the sensitivity of anomaly detection models. To begin, we mixed a single simulated user with the real users. We varied the number of subjects accessed by the simulated user to investigate how volume impacts the deviation score and the performance of the anomaly detection models in general. For illustration, the MetaCADS and CADS deviation scores for the simulated users in the EHR data set are summarized in Fig. 8 and Fig. 9 respectively.
Fig. 8.
The MetaCADS deviation scores of real and simulated users as a function of number of subjects accessed.
Fig. 9.
The CADS deviation scores of real and simulated users as a function of number of subjects accessed.
Notice that when the number of subjects accessed by the simulated users is small, the deviation score is low as well. However, when the number of subjects accessed is larger than 20, the deviation scores of simulated users increase significantly. This is because users with a small number of accesses do not provide sufficient information for Meta-CADS to appropriately characterize their access behaviors.
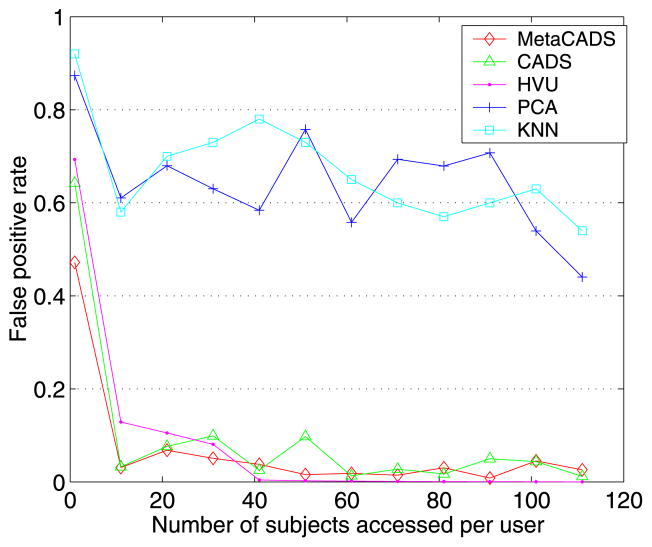
Next, we set out to determine when the deviation score is sufficiently large to detect the simulated user in the context of the real users. Fig. 10 shows how the number of subjects accessed by the simulated user influences the performance of the anomaly detection models. When the number of accessed subjects for the simulated user is small (e.g., one), it is difficult for all of the models to discover the user via the largest deviation score. This is expected because all of the models, except for HVU, are evidence-based. They need to accumulate a certain amount of statistical evidence before they can determine that the actions of the user are not the result of noise in the system.
Fig. 10.
False positive rate of detection for a simulated user with an increasing number of accessed subjects.
The performance of all models generally increase with the number of subjects accessed. However, the performance gain is relatively minor for the classification models; i.e., KNN and PCA. The false positive rate of these models is never lower than 0.4, even when the number of subjects accessed is greater than 100. By contrast, the false positive rates of HVU, CADS, and MetaCADS drop significantly. By the point at which 10 subjects are accessed, HVU achieves a false positive rate of approximately 0.1 and CADS and MetaCADS are below 0.02. When the number of accessed subjects is greater than 30, HVU consistently achieves the lowest false positive rate. This is because, as shown in Fig. 5, the majority of the real users access less than 30 subjects per day. Nonetheless, it is apparent that both MetaCADS and CADS achieve very low false positive rates when attempting to detect a single simulated user. Moreover, MetaCADS consistently achieves a smaller false positive rate than CADS. We believe this is because the assignment network facilitates a stronger portrayal of real users’ communities than the access network in isolation.
3.7.2 Varying Number of Intruding Insiders
In order to assess how the number of simulated users influences the performance of the five models, we conducted several experiments when the number of simulated users was randomly generated. In these experiments, the number of subjects accessed by the simulated users was fixed at 5. We chose this number to simulate evasive maneuvering. By setting the number of subjects accessed to this level, we simulate users that attempt to avoid triggering the high volume rule. The mix rate of simulated users was varied from 0.5 to five percent.
The AUC scores for the models are summarized in Table 2 and there are several notable observations. First, it is evident that HVU exhibits the worst performance in this setting. This is unsurprising because there are many real users that access more than five subjects in the system. Second, as in the previous set of experiments, the supervised classification models (i.e., KNN and PCA) exhibit significantly worse performance than the unsupervised relational models (i.e., CADS and MetaCADS). Third, when the number of simulated users is low (i.e., 0.5 percent), MetaCADS yields a slightly higher AUC than CADS (0.92 versus 0.91). This observation is in accordance with our results from the first experiment in which a single simulated user is mixed into the real system. However, as the number of simulated users increases, CADS clearly dominates MetaCADS. Specifically, the performance rate of CADS increases from 0.91 to 0.94, while MetaCADS decreases from 0.92 to 0.87. We believe this is because when the number of simulated users increases, they have more frequent categories in common. In turn, these categories enable simulated users to form more communities than those based on subjects along, thus lowering their deviation scores. This is an interesting observation because it suggests that if the number of intruding insiders is expected to constitute a significant number of users, the anomaly detection model will benefit from neglecting the categories associated with the accessed subjects.
TABLE 2.
AUC Scores (+/− One Standard Deviation) of the Detection Models on Different Rates
| MIX RATE | |||
|---|---|---|---|
| MODEL | 0.5% | 2% | 5% |
| MetaCADS | 0.92±0.02 | 0.90±0.01 | 0.87±0.03 |
| CADS | 0.91±0.01 | 0.94±0.02 | 0.94±0.01 |
| KNN | 0.75±0.02 | 0.73±0.03 | 0.72±0.04 |
| PCA | 0.72±0.03 | 0.74±0.02 | 0.75±0.03 |
| HVU | 0.68±0.03 | 0.68±0.03 | 0.68±0.03 |
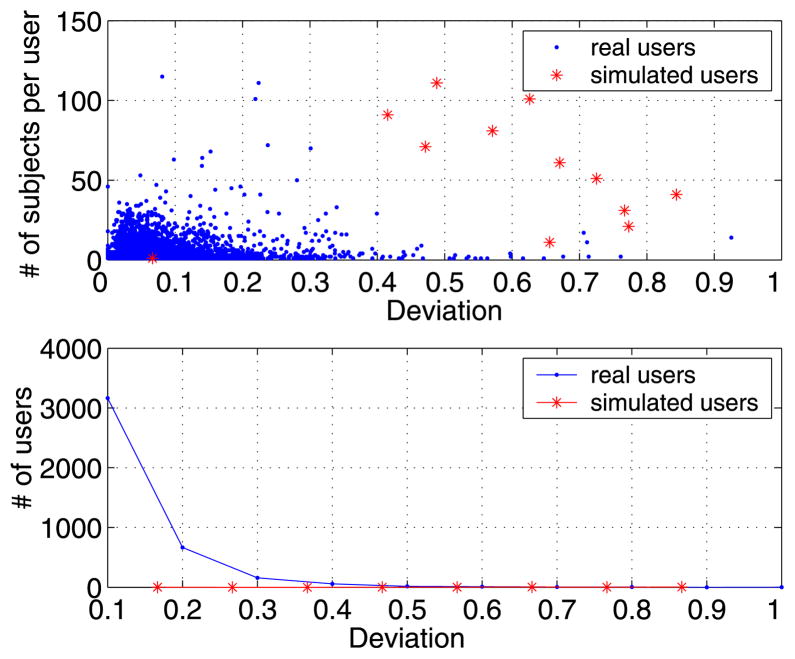
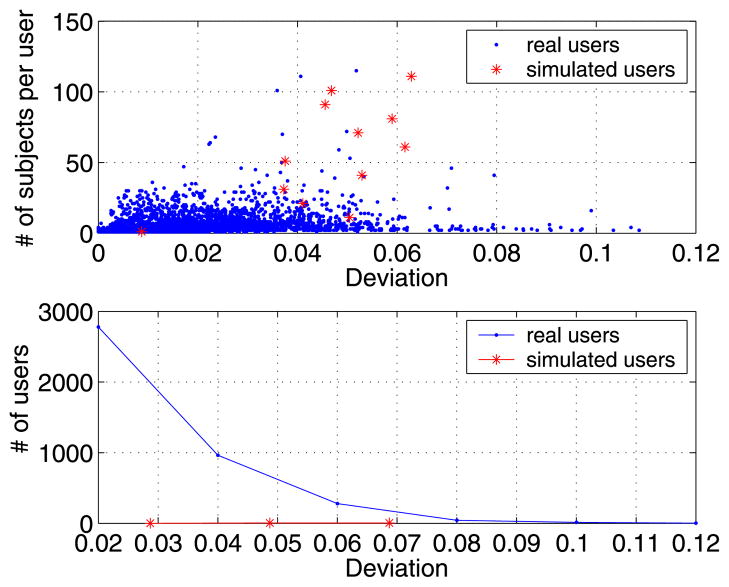
Fig. 11 depicts the distributions of deviation scores for MetaCADS at mix rate of 0.5 percent. It can be observed that when the threshold of the deviation score is set to 0.3, most of the simulated users are detected with a low false positive rate. Similarly, Fig. 12, depicts CADS at a mix rate of two percent, where it can be seen that a threshold of 0.6 provides relatively strong detection capability.
Fig. 11.
MetaCADS deviation scores of the real and simulated users as a function of number of subjects accessed. This system was generated with a mix rate of 0.5 percent and five subjects accessed per simulated user.
Fig. 12.
CADS deviation scores of the real and simulated users as a function of number of subjects accessed. This system was generated with a mix rate of two percent and five subjects accessed per simulated user.
3.7.3 Varying Number of Simulated User and Accessed Subjects
In this experiment, we simulated an environment in which the system varied in the types of intruders to compare the anomaly detection models. Specifically, we allowed both the number of simulated users and the number of subjects accessed by the simulated users to vary. The mix rate between simulated users and the total number of users was varied between 0.5 to five percent and the number of subjects accessed per simulated user was selected at random between 1 and 150.
The ROC curves of the models for three mix rates are depicted in Fig. 13 and the AUC scores are depicted in Table 3. There are several findings to recognize. First, as in the previous experiment, it can be seen that the performance of the supervised classification models is significantly worse than the unsupervised models. The supervised models consistently have a lower true positive rate at all operating points. Second, unlike the previous experiment, HVU achieves comparable results to the supervised classification models. This is due to the fact that this model is correctly characterizing the intruders that access a larger number of records. Third, with respect to AUC, we observe the same trend as earlier regarding the dominance of the unsupervised models as a function of the mix rate. Specifically, MetaCADS dominates when the mix rate is low, but CADS dominates when the mix rate is high. Notably the disparity between MetaCADS and CADS is more pronounced at the low mix rate (0.91 versus 0.88) in this setting than in the previous setting. However, at lower false positive operating points, CADS appears to dominate MetaCADS.
Fig. 13.
Comparison of the detection models at several mix rates. The number of accessed subjects for simulated user is random.
TABLE 3.
AUC Scores (+/− One Standard Deviation) of the Detection Models on Different Rates
| MIX RATE | |||
|---|---|---|---|
| MODEL | 0.5% | 2% | 5% |
| MetaCADS | 0.91±0.01 | 0.82±0.02 | 0.78±0.03 |
| CADS | 0.88±0.01 | 0.87±0.01 | 0.80±0.02 |
| PCA | 0.73±0.02 | 0.69±0.02 | 0.67±0.01 |
| KNN | 0.69±0.03 | 0.68±0.03 | 0.68±0.02 |
| HVU | 0.72±0.06 | 0.72±0.06 | 0.73±0.05 |
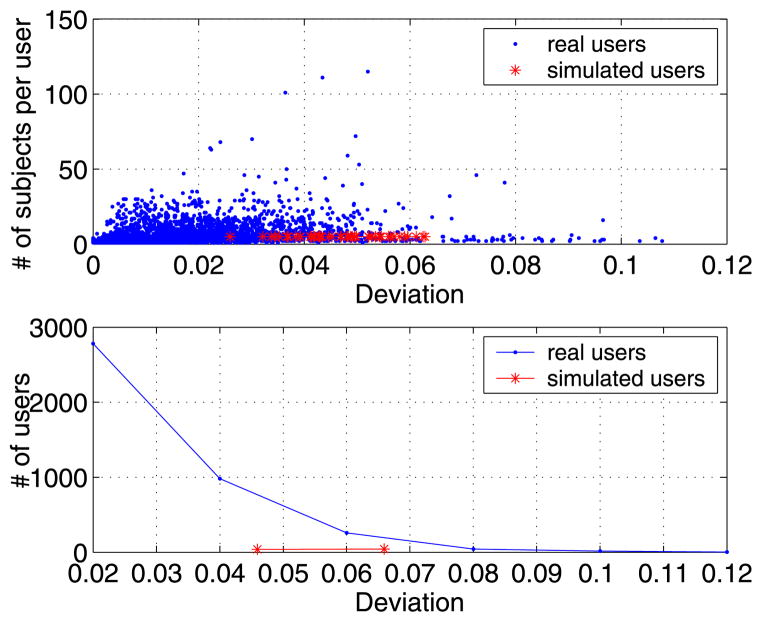
Figs. 14 and 15 depict the MetaCADS and CADS deviation scores for real and simulated users as a function of the number of subjects accessed in an arbitrary day of the EHR data set. The mix rate was set to 0.5 percent for MetaCADS and two percent for CADS.
Fig. 14.
MetaCADS deviation scores of real and simulated users as a function of the number of subjects accessed. This system was generated with a mix rate of 0.5 percent and a random number of subjects accessed per simulated user.
Fig. 15.
CADS deviation scores of real and simulated users as a function of the number of subjects accessed. This system was generated with a mix rate of two percent and a random number of subjects accessed per simulated user.
4 Discussion
To detect anomalous insiders in a CIS, we proposed CADS, a community-based anomaly detection model that utilizes a relational framework. To predict which users are anomalous, CADS calculates the deviation of users based on their nearest neighbor networks. We further extended CADS into MetaCADS to incorpate the semantics of the subjects accessed by the users. Our experimental evaluation suggests that unsupervised relational models exhibit better performance at detecting anomalous users in collaborative domains than supervised models. Moreover, the AUC suggests that MetaCADS may have better effectiveness than CADS when the rate of intruding users to real users is low (e.g., 0.5 percent). We further note that the relational models are generic and should be capable of inferring the collaborative behavior of users in many settings.
At the same time, there are several limitations of this study that we wish to point out, which we believe can serve as a guidebook for future research on this topic.
First, we believe our results are a lower bound on the performance of the anomaly detection methods evaluated in this paper. This is because, in complex collaborative environments such as EHR systems, we need to evaluate the false positives with real humans, such as the privacy officials of a medical center. It is possible that the false positives we reported were, in fact, anomalous users. This is a process that we have initiated with officials and believe it will help further tune the anomaly detection approach.
Second, the performance of MetaCADS is sensitive to the number of simulated users and the number of subjects accessed. If intruding users access a large number of common subjects, or common categories, they tend toward larger communities. This will allow intruders to hide in the system, such that MetaCADS may fail to detect them. Our experimental findings suggest that MetaCADS is more sensitive to this phenomenon than CADS when the number of simulated intruding users is high. This is due, in part, to the fact that as the number of intruding users access a large number of subjects grows, the intruders will access common concepts. Thus, the relations of these users will be closer in MetaCADS than they are in CADS.
Third, this work did not incorporate additional semantics that may be known for users that could be useful in constructing more meaningful patterns. For instance, the anomaly detection framework could use the “role” or “departmental affiliation” of the EHR users to construct more specific models about the users [56]. We intend to analyze the impact of such information in the future, but point out that the goal of the current work was to determine how the basic information in the access logs and metainformation for the subjects could assist in anomaly detection. We are encouraged by the results of our initial work and expect that such additional semantics may improve the system.
Fourth, in this paper, we set the size of the communities to the users’ k nearest neighbors, but we assumed that k was equivalent for each user in the system. However, it is known that the size of communities and local networks is variable [30]. As such, in future work, we intend on parameterizing such models based on local, rather than global, observations.
Finally, CADS aims to detect anomalous insiders that access subjects at random, but this is only one type of anomalous insiders. As a result, CADS may be susceptible to mimicry attacks if an adversary has the ability to game the system by imitating group behavior or the behavior of another user. Moreover, there are many different types of anomalies in collaborative systems, each of which depends on the perspective and goals of the organization. For instance, models could be developed to search for anomalies at the level of individual accesses or sequences of events [11]. We aim to design models to integrate our approach with others in the future.
5 Related work
In general, there are two types of security mechanisms that have been designed to address the insider threat. The first is to prevent illicit activity by modeling access rules for the system and its users. The second is to detect illicit activity post hoc by reviewing patterns of user behavior. In this section, we review prior research in these areas and relate them to the needs and challenges of CIS. We recognize that information leakage may transpire when information is shared between organizations, in which case trusted computing (e.g., [2]) and digital rights management frameworks (e.g., [32]) may be feasible solutions. However, in this work, our focus is on the threats posed by authenticated individuals in a single organization.
5.1 Prevention of the Insider Threat
Formal access control frameworks are designed to specify how resources in a system are made available to authenticated users. Most access control frameworks determine if a request to the system is permitted based on a set of static predefined rules. Access control frameworks have been extended to address complex workflows by accounting for teams [17], tasks [38], [51], and contextual cues [39]. These frameworks assume the system is static and can be clearly modeled, but the dynamic nature of modern CIS make it difficult to apply these principles in such a setting. Additionally, collaborative systems require a much broader definition of context, and the nature of collaboration cannot always be easily partitioned into tasks associated with usage counts.
A potential way to account for the fluid nature of modern organizations is experience-based access management (EBAM) [20]. The goal of EBAM is to evolve an access control configuration based on patterns extracted from the system’s audit logs. It was recently shown that EBAM can be applied to refine role definitions in an EHR based on differential invocation of features such as “reason” for access and “service” provided to the patient [56]. Alternatively, there have been various investigations into role mining [26], [35], [54], which automatically (re)groups users based on the similarity of their permissions sets [53]. These approaches are in their infancy, however, and it is not clear how stable they are across time periods.
Moreover, we wish to note that access control and role engineering is complicated by the fact that not all users are equally trustworthy. Based on this observation, there have been some investigations into combining trust management models with access control frameworks [7], [12], [13], [28]. These approaches assign users to roles based on their level of trust. At the present time, there is little evidence regarding how such approaches can be applied in real systems. Yet, there is concern that these models require complex calculations and may consume more resources than available in the context of evolving systems.
In many instances, access control systems provide users with the opportunity to “break-the-glass” when they do not have sufficient access rights. However, this approach is only feasible when the number of broken glass instances (i.e., policy exceptions) is relatively small. However, there is evidence to suggest that the complexity of CIS, such as EHRs, result in broken glass as the norm, rather than the exception. As an example, we refer to a break-the-glass model which was piloted in a consortium of hospitals in the Central Norway Health Region [42]. In this instance, users were assigned to an initial set of privileges and could invoke break-the-glass. However, in this study, users accessed approximately 54 percent of 99,352 patients’ records through break-the-glass in a single month and 43 percent of the 12,258 users invoked the right. Overall more than 295,000 break-the-glass instances were logged. Clearly, this is more cases than an administrator can review and indicates that automated auditing strategies are still necessary.
5.2 Detection of the Insider Threat
The previous set of approaches strive to define “zones” in which a user can access and act upon subjects in a system. However, users can commit illicit actions in the zones in which they are entitled to function. In this case, there are mainly two classes of malicious insiders [48]: 1) masqueraders and 2) traitors. The masqueraders are the most familiar example of an insider. They have little knowledge of the system and the anticipated behavior. They may be a user that searches for knowledge to exploit or they may be users whose accounts have been compromised. Traitors on the other hand have complete knowledge of the system and its policies. A traitor may exhibit normal behavior and still perpetrate malicious acts.
The problem studied in this paper is akin to that of detecting masqueraders. Several notable approaches have been proposed to address this type of intruder. The first is nearest neighbor anomaly detection techniques [31], [40], [49], [50], which are designed to measure the distances between instances by assessing their relationship to “close” instances. If the instance is not sufficiently close, then it may be classified as an anomaly. However, social structures in a CIS are not explicitly defined and need to be inferred from the utilization of system resources. If distance measurement procedures are not tuned to the way in which social structures have been constructed, the distances will not represent the structures well. Our experimental results confirm this notion.
The second approach is based on spectral anomaly detection. This approach estimates the principal components from the covariance matrix of the training data of “normal” events. The testing phase involves the comparison of each point with the components and assigning an anomaly score based on the point’s distance. The model can reduce noise and redundancy, however, collaborative systems are team oriented, which can deteriorate performance of the model as our experiments demonstrate.
The discovery of traitors is a different challenge because it requires the detection of subtle and significant changes from a user’s normal behavior. Yet, this is an area ripe for new research and several approaches have been recently proposed to address this type of insider threat [5], [11], [25]. The most recent is also based on social networking [11]. This model constructs a subject-specific graph, which contains all users acting upon a particular subject (i.e., the local network). This model then inquires how the similarity of this network is affected by the removal of certain users. It was shown that large changes of similarity can imply illicit actions. However, it was shown that local networks are more adept at detecting such actions than all users (i.e., the global network), which is crucial to CADS.
6 Conclusions
To detect anomalous insiders in a CIS, we proposed CADS, a community anomaly detection system that utilizes a relational framework. To predict which users are anomalous, CADS calculates the deviation of users based on their nearest neighbor networks. We further extended CADS into MetaCADS to incorpate the semantics of the subjects accessed by the users.
Our model is based on the observation that “normal” users tend to form communities, unlike illicit insiders. To evaluate the performance of our model, we conducted a series of experiments that compared our framework with the state-of-the-art anomaly detection methods for CIS systems. In the experiments, we mixed simulated users with the real users of a real electronic health record system. Our results illustrated that the community-based models exhibited better performance at detecting simulated insider threats. The evidence further suggested that MetaCADS is the best model when the number of intruders is relatively small, but that CADS dominates when the number of intruders increases. Since the framework is an unsupervised system, we believe it may be implemented in real time environments with offline training. There are limitations of the system; however, and in particular, we intend to validate and improve our system with adjudication through real human experts.
Acknowledgments
The authors thank Dario Giuse for the EHR access logs studied in this paper. The authors also thank Erik Boczko, Josh Denny, Carl Gunter, David Liebovitz, and the members of the Health Information Privacy Lab for thoughtful discussion. This research was sponsored by grants CCF-0424422 and CNS-0964063 from the US National Science Foundation (NSF) and 1R01LM010207 from the NIH.
Biographies

You Chen received the PhD degree in computer science from the Chinese Academy of Sciences. Currently, he is working as a postdoctoral research fellow in the Department of Biomedical Informatics at Vanderbilt University. His research interests include data and application security and privacy. His current research focuses on the construction and evaluation of data privacy models for personal information that is collected, stored, and shared in large complex systems.

Steve Nyemba received the MS degree in software engineering from Southern Adventist University. Currently, he is working as a software engineer in the Department of Biomedical Informatics, Vanderbilt University. He has extensive industrial experience in health care transactional systems and customer facing applications systems design and implementation. He has contributed to various open-source projects and is the primary of Jx framework and the stored procedure generator for PostgreSQL. In 2008, he earned a Business Objects Award for excellence from Emdeon’s Inc.

Bradley Malin received the BS degree in biological sciences, the MS degree in machine learning, the MPhil degree in public policy and management, and the PhD degree in computer science, all from Carnegie Mellon University. Currently, he is working as an associate professor of Biomedical Informatics and Computer Science at Vanderbilt University, where he directs the Health Information Privacy Laboratory. His current research interests include data mining, biomedical informatics, and trustworthy computing, with specific application to health information systems. His work is supported by the US National Science Foundation (NSF) and National Institutes of Health. Among various honors, he received the Presidential Early Career Award for Scientists and Engineers (PECASE). He is a member of the IEEE Computer Society.
Footnotes
The matrix is binary because the number of accesses to a particular subject can be artificially inflated due to system design. For instance, in an EHR, a user may access different components of a patient’s medical record, such as a laboratory report then a progress note, but each view constitutes an “access.”
We leverage SVD because it is useful for large sparse matrices [46], which tend to arise in CIS.
Contributor Information
You Chen, Email: you.chen@vanderbilt.edu.
Steve Nyemba, Email: steve.l.nyemba@vanderbilt.edu.
Bradley Malin, Email: b.malin@vanderbilt.edu.
References
- 1.Adamic LA, Adar E. Friends and Neighbors on the Web. Social Networks. 2003;25(3):211–230. [Google Scholar]
- 2.Alawneh M, Abbadi I. Preventing Information Leakage between Collaborating Organisations. Proc. 10th Int’l Conf. Electronic Commerce; 2008. pp. 185–194. [Google Scholar]
- 3.Bellotti V, Bly S. Walking Away from the Desktop Computer: Distributed Collaboration and Mobility in a Product Design Team. Proc. ACM Conf. Computer Supported Cooperative Work; 1996. pp. 209–218. [Google Scholar]
- 4.Benaben F, Touzi J, Rajsiri V, Pingaud H. Collaborative Information System Design. Proc. Int’l Conf. Assoc. Information and Management; 2006. pp. 281–296. [Google Scholar]
- 5.Boxwala AA, Kim J, Grillo JM, Machado LO. Using Statistical and Machine Learning to Help Institutions Detect Suspicious Access to Electronic Health Records. J Am Medical Informatics Assoc. 2011;18:498–505. doi: 10.1136/amiajnl-2011-000217. [DOI] [PMC free article] [PubMed] [Google Scholar]
- 6.Byun J, Li N. Purpose Based Access Control for Privacy Protection in Relational Database Systems. Int’l J Very Large Data Bases. 2008;17:603–619. [Google Scholar]
- 7.Chakraborty S, Ray I. TrustBac: Integrating Trust Relationships into the RBAC Model for Access Control in Open Systems. Proc. 11th ACM Symp. Access Control Models and Technologies; 2006. pp. 49–58. [Google Scholar]
- 8.Chen H, Wang F, Zeng D. Intelligence and Security Informatics for Homeland Security: Information, Communication, and Transportation. IEEE Trans Intelligent Transportation Systems. 2004 Dec;5(4):329–341. [Google Scholar]
- 9.Chen H, Zeng D, Atabakhsh H, Wyzga W, Schroeder J. COPLINK: Managing Law Enforcement Data and Knowledge. Comm ACM. 2003;46(1):28–34. [Google Scholar]
- 10.Chen Y, Malin B. Detection of Anomalous Insiders in Collaborative Environments via Relational Analysis of Access Logs. Proc. First ACM Conf. Data and Application Security Security and Privacy,; 2011. pp. 63–74. [DOI] [PMC free article] [PubMed] [Google Scholar]
- 11.Chen Y, Nyemba S, Zhang W, Malin B. Leveraging Social Networks to Detect Anomalous Insider Actions in Collaborative Environments. Proc. IEEE Ninth Intelligence and Security Informatics; 2011. pp. 119–124. [DOI] [PMC free article] [PubMed] [Google Scholar]
- 12.Cheng P, Rohatgi P, Keser C, Karger PA, Wagner GM. Research Report RC24190 (W0702-085) IBM; 2007. Fuzzy Multi-Level Security: An Experiment on Quantified Risk-Adaptive Access Control. [Google Scholar]
- 13.Crampton J, Huth M. Towards an Access-Control Framework for Countering Insider Threats. Springer; 2010. [Google Scholar]
- 14.Eberle W, Holder L. Applying Graph-Based Anomaly Detection Approaches to the Discovery of Insider Threats. Proc. IEEE Int’l Conf. Intelligence and Security Informatics,; 2009. pp. 206–208. [Google Scholar]
- 15.Eldenburg L, Soderstrom N, Willis V, Wu A. Behavioral Changes Following the Collaborative Development of an Accounting Information System. Accounting, Organizations and Soc. 2010;35(2):222–237. [Google Scholar]
- 16.George J, Easton G, Nunamaker J, Northcraft G. A Study of Collaborative Group Work with and without Computer-Based Support. Information Systems Research. 1990;1(4):394–415. [Google Scholar]
- 17.Georgiadis C, Mavridis I, Pangalos G, Thomas R. Flexible Team-Based Access Control Using Contexts. Proc. Sixth ACM Symp. Access Control Models and Technologies,; 2001. pp. 21–27. [Google Scholar]
- 18.Giuse D. Supporting Communication in an Integrated Patient Record System. Proc. Ann. Symp. Am. Medical Informatics Assoc; 2003. p. 1065. [PMC free article] [PubMed] [Google Scholar]
- 19.Gruber T. Collective Knowledge Systems: Where the Social Web Meets the Semantic Web. J Web Semantics. 2007;6(1):4–13. [Google Scholar]
- 20.Gunter C, Liebovitz D, Malin B. Experience-Based Access Management: A Life-Cycle Framework for Identity and Access Management Systems. IEEE Security and Privacy Magazine. 2011 Sep-Oct;9(5):48–55. doi: 10.1109/MSP.2011.72. [DOI] [PMC free article] [PubMed] [Google Scholar]
- 21.Hirose S, Yamanishi K, Nakata T, Fukimaki R. Network Anomaly Detection Based on Eigen Equation Compression. Proc. 15th ACM SIGKDD Int’l Conf. Knowledge Discovery and Data Mining,; 2009. pp. 1185–1194. [Google Scholar]
- 22.Huang C, Li T, Wang H, Chang C. A Collaborative Support Tool for Creativity Learning: Idea Storming Cube. Proc. IEEE Seventh Int’l Conf. Advanced Learning Technologies; 2007. pp. 31–35. [Google Scholar]
- 23.Javanmardi S, Lopes C. Modeling Trust in Collaborative Information Systems. Proc. Int’l Conf. Colla borative Computing: Networking, Applications and Worksharing,; 2007. pp. 299–302. [Google Scholar]
- 24.Kannan R, Vempala S, Vetta A. On Clusterings: Good, Bad and Spectral. J ACM. 2004;51(3):497–515. [Google Scholar]
- 25.Kim J, Grillo J, Boxwala A, Jiang X, Mandelbaum R, Patel B, Mikels D, Vinterbo S, Ohno-Machado L. Anomaly and Signature Filtering Improve Classifier Performance for Detection of Suspicious Access to EHRs. Proc. Ann. Symp. Am. Medical Informatics Assoc; 2011. pp. 723–731. [PMC free article] [PubMed] [Google Scholar]
- 26.Kuhlmann M, Shohat D, Schimpf G. Role Mining-Revealing Business Roles for Security Administration Using Data Mining Technology. Proc. Eighth ACM Symp. Access Control Models and Technologies; 2003. pp. 179–186. [Google Scholar]
- 27.Kulkarni D, Tripathi A. Context-Aware Role-Based Access Control in Pervasive Computing Systems. Proc. 13th ACM Symp. Access Control Models and Technologies; 2008. pp. 113–122. [Google Scholar]
- 28.Lee A, Yu T. Towards a Dynamic and Composable Model of Trust. Proc. 14th ACM Symp. Access Control Models and Technologies; 2009. pp. 217–226. [Google Scholar]
- 29.Leskovec J, Lang K, Dasgupta A, Mahoney M. Statistical Properties of Community Structure in Large Social and Information Networks. Proc. 17th Int’l Conf. World Wide Web; 2008. pp. 695–704. [Google Scholar]
- 30.Leskovec J, Lang KJ, Dasgupta A, Mahoney MW. Computing Research Repository. 2008. Community Structure in Large Networks: Natural Cluster Sizes and the Absence of Large Well-Defined Clusters. abs/0810.1355. [Google Scholar]
- 31.Liao Y, Vemuri VR. Use of k-Nearest Neighbor Classifier for Intrusion Detection. J Computer Security. 2002;21(5):439–448. [Google Scholar]
- 32.Lotspiech J, Nusser S, Pestoni F. Anonymous Trust: Digital Rights Management Using Broadcast Encryption. Proc IEEE. 2004 Jun;92(6):898–902. [Google Scholar]
- 33.Malin B, Nyemba S, Paulett J. Learning Relational Policies from Electronic Health Record Access Logs. J Biomedical Informatics. 2011;44(2):333–342. doi: 10.1016/j.jbi.2011.01.007. [DOI] [PMC free article] [PubMed] [Google Scholar]
- 34.Menachemi N, Brooks R. Reviewing the Benefits and Costs of Electronic Health Records and Associated Patient Safety Technologies. J Medical Systems. 2008;30(3):159–168. doi: 10.1007/s10916-005-7988-x. [DOI] [PubMed] [Google Scholar]
- 35.Molloy I, Chen H, Li T, Wang Q, Li N, Bertino E, Calo S, Lobo J. Mining Roles with Semantic Meanings. Proc. 13th ACM Symp. Access Control Models and Technologies; 2008. pp. 21–30. [Google Scholar]
- 36.Newman M. Properties of Highly Clustered Networks. Physical Rev E. 2003;68(026121):1–6. doi: 10.1103/PhysRevE.68.026121. [DOI] [PubMed] [Google Scholar]
- 37.Noble CC, Cook DJ. Graph-Based Anomaly Detection. Proc. Ninth ACM SIGKDD Int’l Conf. Knowledge Discovery and Data Mining; 2003. pp. 631–636. [Google Scholar]
- 38.Park J, Sandhu R, Ahn G. Role-Based Access Control on the Web. ACM Trans Information System Security. 2001;4(1):37–71. [Google Scholar]
- 39.Peleg M, Beimel D, Dori D, Denekamp Y. Situation-Based Access Control: Privacy Management via Modeling of Patient Data Access Scenarios. J Biomedical Informatics. 2008;41(6):1028–1040. doi: 10.1016/j.jbi.2008.03.014. [DOI] [PubMed] [Google Scholar]
- 40.Pokrajac D, Lazarevic A, Latecki L. Incremental Local Outlier Detection for Data Streams. Proc. IEEE Symp. Computational Intelligence and Data Mining; 2007. pp. 504–515. [Google Scholar]
- 41.Popp R. Countering Terrorism through Information Technology. Comm ACM. 2004;47(3):36–43. [Google Scholar]
- 42.Probst C, Hansen RR, Nielson F. Where Can an Insider Attack?. Proc. Workshop Formal Aspects in Security and Trust; 2006. pp. 127–142. [Google Scholar]
- 43.Røstad L, Edsberg O. A Study of Access Control Requirements for Healthcare Systems Based on Audit Trails from Access Logs. Proc. 22nd Ann. Computer Security Applications Conf; 2006. pp. 175–186. [Google Scholar]
- 44.Schultz E. A Framework for Understanding and Predicting Insider Attacks. Computers and Security. 2002;21(6):526–531. [Google Scholar]
- 45.Shi J, Malik J. Normalized Cuts and Image Segmentation. IEEE Trans Pattern Analysis and Machine Intelligence. 2002 Aug;22(8):888–905. [Google Scholar]
- 46.Shlens J. A Tutorial on Principal Component Analysis. Inst. of Nonlinear Science, Univ. of California; 2005. [Google Scholar]
- 47.Shyu M, Chen S, Sarinnapakorn K, Chang L. A Novel Anomaly Detection Scheme Based on Principal Component Classifier. Proc. IEEE Third Foundations and New Directions of Data Mining Workshop; 2003. pp. 172–179. [Google Scholar]
- 48.Stolfo S, Bellovin S, Hershkop S, Keromytis A, Sinclair S, Smith SW. Insider Attack and Cyber Security: Beyond the Hacker. Springer; 2008. [Google Scholar]
- 49.Sun J, Qu H, Chakrabarti D, Faloutsos C. Neighborhood Formation and Anomaly Detection in Bipartite Graph. Proc. IEEE Fifth Int’l Conf. Data Mining; 2005. pp. 418–425. [Google Scholar]
- 50.Tang J, Chen Z, Fu A, Cheung D. Enhancing Effectiveness of Outlier Detections for Low Density Patterns. Proc. Sixth Pacific-Asia Conf. Knowledge Discovery and Data Mining; 2002. pp. 535–7548. [Google Scholar]
- 51.Thomas R, Sandhu S. Task-Based Authorization Controls (TBAC): A Family of Models for Active and Enterprise-Oriented Autorization Management. Proc. IFIP 11th Int’l Conf. Database Security; 1997. pp. 166–181. [Google Scholar]
- 52.Tuglular T, Spafford E. Unpublished paper. 1997. A Framework for Characterization of Insider Computer Misuse. [Google Scholar]
- 53.Vaidya J, Atluri V, Guo Q, Adam N. Migrating to Optimal RBAC with Minimal Perturbation. Proc. 13th ACM Symp. Access Control Models and Techologies; 2008. pp. 11–20. [Google Scholar]
- 54.Vaidya J, Atluri V, Warner J. Roleminer: Mining Roles Using Subset Enumeration. Proc. 13th ACM Conf. Computer and Comm. Security; 2006. pp. 144–153. [Google Scholar]
- 55.von Ahn L. Games with a Purpose. Computer. 2006 Jun;39(6):96–98. [Google Scholar]
- 56.Zhang W, Gunter C, Liebovitz D, Tian J, Malin B. Role prediction Using Electronic Medical Record System Audits. Proc. Ann. Symp. Am. Medical Informatics Assoc; 2011. pp. 858–867. [PMC free article] [PubMed] [Google Scholar]


