

Abstract
Background and purpose
Small vessel disease (mainly hypertensive arteriopathy and cerebral amyloid angiopathy (CAA)) is an important cause of spontaneous intracerebral haemorrhage (ICH), a devastating and still poorly understood stroke type. Enlarged perivascular spaces (EPVS) are a promising neuroimaging marker of small vessel disease. Based on the underlying arteriopathy distributions, we hypothesised that severe centrum semiovale EPVS are more common in lobar ICH attributed to CAA than other ICH. We evaluated EPVS prevalence, severity and distribution, and their clinical–radiological associations.
Methods
Retrospective multicentre cohort study of 121 ICH patients. Clinical information was obtained using standardised forms. Basal ganglia and centrum semiovale EPVS on T2-weighted MRI (graded 0–4 (>40 EPVS)), white-matter changes, cerebral microbleeds (CMBs) and lacunes were rated using validated scales.
Results
Patients with probable or possible CAA (n=76) had a higher prevalence of severe (>40) centrum semiovale EPVS compared with other ICH patients (35.5% vs 17.8%; p=0.041). In logistic regression age (OR: 1.43; 95% CI 1.01 to 2.02; p=0.045), deep CMBs (OR: 3.27; 95% CI 1.27 to 8.45; p=0.014) and mean white-matter changes score (OR: 1.29; 95% CI 1.17 to 1.43; p<0.0001) were independently associated with increased basal ganglia EPVS severity; only age was associated with increased centrum semiovale EPVS severity (OR: 1.50; 95% CI 1.08 to 2.10; p=0.017).
Conclusions
EPVS are common in ICH. Different mechanisms may account for EPVS according to their anatomical distribution. Severe centrum semiovale EPVS may be secondary to, and indicative of, CAA with value as a new neuroimaging marker. By contrast, basal ganglia EPVS severity is associated with markers of hypertensive arteriopathy.
Keywords: Amyloid, Cerebrovascular Disease, Clinical Neurology, MRI
Introduction
Spontaneous (non-traumatic) intracerebral haemorrhage (ICH) is usually defined as ICH not due to any structural, vascular or other primary cause (eg, tumour, arteriovenous malformation, aneurysm, cavernoma), and therefore attributed to intrinsic disease of the cerebral small vessels. Spontaneous ICH accounts for more than 75% of ICH in adults, leading to high rates of death and disability.1 It results from the rupture of small arteries damaged by two main age-related cerebral small vessel diseases: hypertensive arteriopathy (including arteriolosclerosis) and cerebral amyloid angiopathy (CAA). Hypertensive arteriopathy typically affects the small perforating end-arteries of the deep grey nuclei and deep white matter, and is an important cause of ICH in deep structures. CAA is characterised by the progressive deposition of amyloid-β in the walls of small vessels in the cerebral cortex, overlying leptomeninges and grey- white-matter junction, and is a major cause of lobar ICH in the elderly.2 There is an urgent need to better understand the pathophysiology of cerebral small vessel disease and spontaneous ICH, to enhance diagnosis, prevention and treatment.
Perivascular spaces (also known as Virchow–Robin spaces) are interstitial fluid-filled3 cavities surrounding the small penetrating vessels which function as the brain drainage system,4 and have been recognised pathologically for many years. Enlarged perivascular spaces (EPVS) can also be seen on MRI, and have attracted attention as a potential neuroimaging marker of small vessel disease.5 6 Although EPVS are common finding in the elderly,7 8 and show consistent associations with other markers of small vessel damage,6 they have received relatively little attention to date, usually being considered unimportant or even normal. EPVS are visible on T2-weighted cerebral MRI as characteristically small, high-signal areas in the basal ganglia and centrum semiovale.6
ICH is perhaps the most devastating clinical consequence of small vessel disease, yet EPVS have not been systematically studied in this population. There is an urgent need to develop more sensitive diagnostic markers of the arteriopathies underlying ICH, particularly CAA.2 In the present study, our aims were to determine the prevalence, distribution and severity of EPVS in ICH, and investigate their associations with other imaging markers of small vessel disease, and with presumed ICH aetiology. We hypothesised that, in patients with ICH: (1) EPVS are common; (2) EPVS severity is associated with other small vessel disease MRI markers including white-matter changes, lacunes and cerebral microbleeds (CMBs) and (3) patients with strictly lobar ICH attributed to CAA have a higher prevalence of severe EPVS in the centrum semiovale compared with other ICH, due to the expected distributions of the underlying arteriopathies.
Patients and methods
Study participants and data collection
We performed a retrospective analysis of patients with spontaneous ICH (defined as ICH without evidence for an underlying cause, except for sporadic small vessel disease) referred to four specialist stroke centres over defined time periods in the UK and Belgium. The hospitals were: University College London Hospitals National Health Servie (NHS) Foundation Trust (09/2004–06/2011), Cliniques Universitaires Saint Luc (Brussels) (12/2004–04/2008), CHU Mont-Godinne UCL (Belgium) (08/2005–06/2008) and Addenbrooke's Hospital (Cambridge) (07/2002–12/2009). At all participating centres, MRI scanning is a routine investigation for ICH, unless there are contraindications. Cases were systematically ascertained using multiple overlapping methods from prospective clinical databases and radiological reports. A total of 377 patients with ICH were screened, of whom 129 were excluded because of diagnosis of non-spontaneous ICH (eg, secondary to aneurysms, tumours, cavernomas, etc), and 127 because MRI with the necessary sequences of adequate quality was not available for analysis.
We categorised cases of spontaneous ICH as either strictly lobar, consistent with a diagnosis of CAA (clinically possible or probable CAA according to the Boston criteria9) or ‘other ICH’ (ie, deep ICH and mixed deep and lobar ICH). Demographic and clinical information (eg, age at time of MRI, gender, vascular risk factors, use of antithrombotics, etc) was obtained from prospective databases and by medical records review using standardised data collection forms. Hypertension was defined as a history of hypertension, taking antihypertensive treatment or documented elevated blood pressure (systolic >150 or diastolic >95 mm Hg) prior to ICH, diabetes as ongoing use of a hypoglycaemic agent, and smoking as history of tobacco use before admission.
The study received ethical approval by the National Hospital for Neurology and Neurosurgery and Institute of Neurology Joint Research Ethics Committee, the Commission d'Ethique Biomedicale Hospitalo Facultaire of the Faculte de Medicine (Universite Catholique de Louvain), and the Comite d'ethique medicale of the Cliniques Universitaires UCL de Mont Godinne.
MRI acquisition and analysis
The MRI stroke protocol was similar in each hospital. Imaging was at 1.5 T field strength and included axial T1-weighted, T2-weighted, coronal fluid-attenuated inversion recovery (FLAIR), axial diffusion-weighed imaging and T2*-weighted gradient-recalled echo (T2*-GRE) sequences (see online supplementary table S1).
MRI were reviewed on medical imaging workstations, blinded to clinical details. The presence, number and distribution (lobar-including cerebellum, as suggested in the Boston criteria9 and deep-including brainstem) of ICHs were recorded. The presence, number and distribution of CMBs were evaluated on T2*-GRE images using the Microbleed Anatomical Rating Scale.10 White-matter changes were rated on a four-point scale (0–3)11 on coronal FLAIR, T1-weighted and T2-weighted MRI.
EPVS were rated on axial T2-weighted MRI by a trained observer, using a validated visual rating scale.6 12 EPVS were defined as small, sharply delineated structures of Cerebrospinal Fluid (CSF) intensity (or close to CSF intensity), measuring <3 mm following the course of perforating or medullary vessels (figure 1). Lacunes were distinguished from EPVS by their larger size (>3 mm), spheroid shape and surrounding hyperintensity on FLAIR. EPVS were rated in basal ganglia and centrum semiovale regions. For both of these anatomical areas, the EPVS rating categories applied were: 0=no EPVS, 1 ≤ 10 EPVS, 2=11–20 EPVS, 3=21–40 EPVS and 4≥40 EPVS. The numbers refer to EPVS on one side of the brain: after reviewing all relevant slices for the anatomical area being assessed, the slice and side with the highest number of EPVS was recorded.6 12 In patients with other ICH, basal ganglia EPVS were evaluated contralateral to the lesion if deep ICH was present. The assessment of EPVS may have been influenced by the presence of confluent white-matter changes; in such cases, as per guidance provided for the rating scale we used,6 estimation was made of the closest EPVS rating category, using the appearance of non-involved white matter, and cortical grey matter. Similarly, in cases of large lobar ICH, centrum semiovale EPVS were assessed contralateral to the index ICH lesion; an estimation of the closest centrum semiovale EPVS rating category ipsilateral to the lesion was made, and the highest number of EPVS was recorded. Intrarater reliability testing (n=30 scans) showed an excellent intrarater Cohen's kappa value of 0.91 for basal ganglia EPVS and 0.82 for centrum semiovale EPVS.
Figure 1.

Axial T2-weighted MRI. (A and B) Dot-like hyperintensities characteristic of enlarged perivascular spaces (EPVS) in the basal ganglia in a patient with spontaneous deep intracerebral haemorrhage (ICH). (C and D) Linear hyperintensities typical of EPVS in the centrum semiovale in a patient with cerebral amyloid angiopathy-related lobar ICH. Note that deep brain regions (eg, basal ganglia) are not affected by EPVS (D).
Statistical analysis
We compared clinical and imaging characteristics of patients with strictly lobar ICH (attributed to CAA according to the Boston criteria) to those with other ICH, using χ2 tests and the Fisher's exact test for categorical variables, and two-sample t tests or Mann–Whitney U tests depending on the distribution of continuous variables. To test our hypothesis, we sought to compare the prevalence of severe centrum semiovale and basal ganglia EPVS (>40 EPVS) in the two ICH groups. However, since only one patient had severe basal ganglia EPVS in a posthoc analysis, we compared frequent-to-severe basal ganglia EPVS (>20) in the two ICH groups. Both crude and age-adjusted severe EPVS centrum semiovale prevalence rates are reported. For the logistic regression analysis, severity of EPVS was trichotomised due to the small number of patients with no EPVS or >40 EPVS (1 (mild; 1–10), 2 (moderate; 11–20) and 3 (severe; over 21)). Ordinal logistic regression analysis was used to identify predictors of increasing EPVS severity in the two anatomical areas (centrum semiovale and basal ganglia) and for total brain EPVS. Multivariable analysis was adjusted for age, lobar microbleeds, deep microbleeds, white-matter changes score and lacunes, based on the results of univariable analysis, plus other biologically plausible confounders, especially neuroimaging markers of small vessel disease. As a sensitivity analysis, we repeated these analyses with the addition of other variables in our model (including sex, hypertension, CAA-group etc). Using a likelihood ratio test, the assumption of proportional odds for the ordinal logistic regression models was met. A p value ≤0.05 was considered to be statistically significant. All statistical analyses were carried out using STATA data analysis and statistical software (V.11.2, StataCorp).
Results
Patients with spontaneous ICH excluded from the study were not significantly different from those included in measures of ICH severity including: median (IQR range) ICH volume (10.5 cm3; 2.93–18.81 cm3 vs 12.84 cm3; 4.05–25.31 cm3; p=0.288), median (IQR range) Glasgow Coma Score on admission (14; 11–15 vs 15; 14–15; p=0.087) in patients excluded versus patients included, respectively. Patients excluded had a higher prevalence of deep ICH (50.5% vs 27.4%, p=0.005). The final cohort consisted of 121 patients with ICH (mean age 69.4 (95% CI 67.2 to 69.6); 69 (57%) male); 76 (63%) had strictly lobar ICH, fulfilling the Boston criteria for probable (n=53) or possible (n=23). The clinical and radiological characteristics of the ICH cohort overall, and according to ICH location, are reported in table 1. The median time from ICH to MRI was 10 days (IQR: 3–61 days).
Table 1.
Patient characteristics
| n (%) | Overall (n=121) | Strictly lobar ICH (n=76) | Other ICH (n=45) | p Value |
|---|---|---|---|---|
| Age, mean (95% CI), years | 69.4 (67.2 to 69.6) | 71.1 (68.4 to 73.8) | 66.6 (62.8 to 72.4) | 0.05 |
| Sex, male | 69 (57) | 41 (54) | 28 (62.2) | 0.449 |
| History of hypertension | 86 (72.9) | 49 (67.1) | 37 (82.2) | 0.090 |
| Smoking history | 39 (33.3) | 22 (30.1) | 17 (38.6) | 0.419 |
| Diabetes | 20 (17.1) | 11 (15.1) | 9 (20.5) | 0.459 |
| On statins | 26 (22) | 15 (20.6) | 11 (25) | 0.648 |
| On antithrombotics | 38 (32.8) | 27 (37) | 11 (25.6) | 0.226 |
| First-ever ICH | 68 (63) | 40 (62.5) | 28 (63.6) | 1.000 |
| Lacunar infarct | 25 (49) | 11 (37.9) | 14 (63.6) | 0.093 |
| Multiple ICHs | 47 (39.8) | 34 (46.6) | 13 (28.9) | 0.081 |
| Microbleeds presence | 79 (67.5) | 45 (62.5) | 34 (75.6) | 0.160 |
| Microbleeds type | ||||
| Lobar | 77 (64.7) | 45 (62.5) | 30 (68.2) | 0.556 |
| Deep | 28 (23.1) | 0 | 28 (63.6) | <0.0001 |
| Mean total white matter changes score (95% CI) | 8.58 (7.59 to 9.57) | 8.21 (6.95 to 9.46) | 9.18 (7.53 to 10.83) | 0.346 |
| Mean total EPVS score (95% CI) | 4.38 (4.18 to 4.58) | 4.29 (4.04 to 4.54) | 4.53 (4.17 to 4.9) | 0.255 |
| Mean basal ganglia EPVS score (95% CI) | 1.50 (1.37 to 1.63) | 1.32 (1.18 to 1.45) | 1.8 (1.56 to 2.05) | 0.0003 |
| Mean centrum semiovale EPVS score (95% CI) | 2.85 (2.72 to 3.05) | 2.97 (2.76 to 3.19) | 2.73 (2.47 to 2.99) | 0.1590 |
| EPVS centrum semiovale | ||||
| Mild: 1–10 | 7 (5.8) | 4 (5.3) | 3 (6.7) | 0.338* |
| Moderate: 11–20 | 36 (29.8) | 21 (27.6) | 15 (33.3) | |
| Frequent: 21–40 | 43 (35.5) | 24 (31.6) | 18 (40) | |
| Severe: >40 | 35 (28.9) | 27 (35.5)† | 8 (17.8)† | |
| EPVS basal ganglia | ||||
| No EPVS | 2 (1.7) | 2 (2.6) | 0 (0) | 0.005* |
| Mild: 1–10 | 70 (57.9) | 51 (67.1) | 19 (42.2) | |
| Moderate: 11–20 | 37 (30.6) | 20 (26.3) | 17 (37.8) | |
| Frequent: 21–40 | 11 (9.1) | 3 (4) | 8 (17.8) | |
| Severe: >40 | 1 (0.8) | 0 (0) | 1 (2.2) | |
p Values refer to differences between strictly lobar (clinically probable or possible CAA) and other ICH.
*p Value for trend across groups.
†Statistically significant difference between strictly lobar (possible or probable CAA) and other ICH (see figure 2 for age-adjusted prevalences).
CAA, cerebral amyloid angiopathy; EPVS, enlarged perivascular spaces; ICH, intracerebral haemorrhage.
Prevalence and distribution of EPVS in ICH
Almost all patients had some degree of EPVS (table 1); the mean total score was 4.38 (95% CI 4.18 to 4.58).
Patients with strictly lobar ICH had a significantly higher prevalence of severe EPVS (>40 EPVS) in the centrum semiovale compared with other ICH patients (35.5% vs 17.8%, respectively; p=0.041) (table 1) The age-adjusted prevalences of severe EPVS in the centrum semiovale are 29.3% (95% CI 23.1% to 35.5%) in the strictly lobar ICH group versus 13.5% (95% CI 9.3% to 17.8%) in the ‘other ICH’ group (p<0.05) (figure 2).
Figure 2.
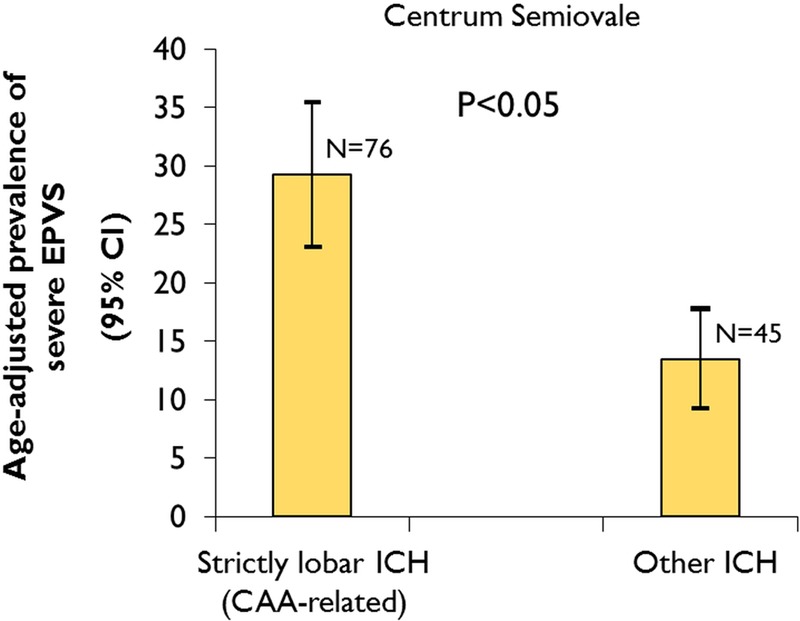
Age-adjusted prevalence of severe centrum semiovale enlarged perivascular spaces (EPVS) (>40 EPVS) in patients with strictly lobar intracerebral haemorrhage (ICH), attributed to cerebral amyloid angiopathy, compared with other ICH. Age was used as a continuous variable. (For within-group comparisons of the proportion of patients with centrum semiovale EPVS vs basal ganglia EPVS for lobar ICH and other ICH see online supplementary material).
It was not possible to test for differences between the strictly lobar and other ICH groups in the prevalence of severe basal ganglia EPVS since only one patient had severe basal ganglia EPVS. However, in a posthoc analysis, the proportion of patients with frequent-to-severe basal ganglia EPVS (>20) was higher in those with other ICH than in strictly lobar ICH (20% vs 4%, p=0.009).
There was no statistically significant relationship between basal ganglia and centrum semiovale EPVS severity (compared using χ2 test across categories; see online supplementary table S2). For factors associated with increasing severity of total EPVS, see online supplementary table S3 and online supplementary figure S1.
Predictors of increased EPVS severity in logistic regression
In univariable ordinal logistic regression analysis, significant predictors of increasing EPVS severity in the basal ganglia were age, smoking history, the presence of CMBs, presence of deep CMBs, presence of lacunes, mean white-matter changes score and other ICH (non-CAA aetiology) (table 2). In multivariable logistic regression analysis (table 3), age (OR: 1.43, per 10 years increase; 95% CI 1.01 to 2.02; p=0.045), presence of deep CMBs (OR: 3.27; 95% CI 1.27 to 8.45; p=0.014), and mean white-matter changes score (OR: 1.29, per unit increase; 95% CI 1.17 to 1.43; p<0.0001) were independent predictors of increased basal ganglia EPVS severity, after adjusting for the presence of lobar CMBs and lacunes.
Table 2.
Univariable (unadjusted) ordinal logistic regression analysis showing predictors of increased basal ganglia and centrum semiovale EPVS severity in the whole cohort
| Basal ganglia EPVS | Centrum semiovale EPVS | |||
|---|---|---|---|---|
| (Yes vs No) | OR (95% CI) | p Value | OR (95% CI) | p Value |
| Age (per 10 years older) | 1.41 (1.02 to 1.95) | 0.036 | 1.36 (0.98 to 1.87) | 0.065 |
| Sex, male | 0.53 (0.26 to 1.10) | 0.088 | 0.56 (0.27 to 1.18) | 0.128 |
| History of hypertension | 1.05 (0.57 to 2.33) | 0.469 | 0.68 (0.28 to 1.63) | 0.381 |
| Smoking history | 2.89 (1.35 to 6.18) | 0.006 | 1.20 (0.53 to 2.71) | 0.666 |
| Diabetes | 1.26 (050 to 3.16) | 0.622 | 1.11 (0.39 to 3.13) | 0.851 |
| On statins | 0.71 (0.29 to 1.72) | 0.441 | 0.74 (0.31 to 1.81) | 0.514 |
| On antithrombotics | 0.62 (0.28 to 1.38) | 0.240 | 0.70 (0.31 to 1.57) | 0.387 |
| First ever ICH | 0.64 (0.30 to 1.37) | 0.248 | 1.07 (0.47 to 2.46) | 0.866 |
| Other ICH (non-CAA aetiology) | 3.58 (1.70 to 7.54) | 0.001 | 0.74 (0.35 to 1.57) | 0.431 |
| Lacunar infarct | 2.75 (0.93 to 8.14) | 0.068 | 2.84 (0.87 to 9.29) | 0.083 |
| Multiple ICHs | 0.71 (0.34 to 1.47) | 0.350 | 0.87 (0.41 to 1.86) | 0.724 |
| Microbleeds presence | 2.29 (1.01 to 5.21) | 0.048 | 1.62 (0.73 to 3.56) | 0.233 |
| Strictly lobar microbleeds | 0.99 (0.48 to 2.04) | 0.985 | 1.59 (0.73 to 3.47) | 0.246 |
| Lobar microbleeds | 1.81 (0.82 to 3.99) | 0.140 | 1.89 (0.87 to 4.13) | 0.109 |
| Deep microbleeds | 2.25 (1.01 to 4.98) | 0.046 | 0.97 (0.41 to 2.26) | 0.937 |
| Mean total white-matter changes score (for each unit increase) | 1.23 (1.13 to 1.33) | <0.0001 | 1.01 (0.94 to 1.08) | 0.772 |
CAA, cerebral amyloid angiopathy; EPVS, enlarged perivascular spaces; ICH, intracerebral haemorrhage.
Table 3.
Multivariable (adjusted) ordinal logistic regression analysis showing predictors of increased basal ganglia and centrum semiovale EPVS severity in the whole cohort
| Basal ganglia EPVS | Centrum semiovale EPVS | |||
|---|---|---|---|---|
| OR (95% CI) | p Value | OR (95% CI) | p Value | |
| Age (per 10 years older) | 1.43 (1.01 to 2.02) | 0.045 | 1.50 (1.08 to 2.10) | 0.017 |
| Lobar microbleeds | 0.43 (0.16 to 1.20) | 0.107 | 1.92 (0.74 to 4.96) | 0.180 |
| Deep microbleeds | 3.27 (1.27 to 8.45) | 0.014 | 0.91 (0.35 to 2.38) | 0.850 |
| Mean total white-matter changes score (for each unit increase) | 1.29 (1.17 to 1.43) | <0.0001 | 0.99 (0.91 to 1.08) | 0.856 |
| Lacunar infarct | 1.00 (1.00 to 1.01) | 0.362 | 1.00 (0.99 to 1.00) | 0.918 |
EPVS, enlarged perivascular spaces.
No clinical or radiological variables were found to be significantly associated with increasing EPVS severity in the centrum semiovale, at the 5% level, in univariable analysis; age was marginally significant. In multivariable analysis, age was the only significant independent predictor of increasing EPVS severity in the centrum semiovale: for every 10 years increase in age, the odds of having an increase in centrum semiovale EPVS was 1.50 (95% CI 1.08 to 2.10; p=0.017).
Logistic regression analyses of total EPVS severity are shown in online supplementary tables S3 and S4.
Discussion
In this multicentre retrospective study, we found that the distribution of severe EPVS differed according to the location of ICH: severe centrum semiovale EPVS were twice as common in patients with strictly lobar (ie, probable or possible CAA) than in those with other ICH. By contrast, the ICH patients not fulfilling these criteria for CAA more often had frequent-to-severe basal ganglia EPVS compared with strictly lobar ICH patients. In the whole cohort, we found that age, white-matter changes and deep CMBs were independently associated with basal ganglia EPVS severity, but only age was independently associated with increased centrum semiovale EPVS severity. Our study thus provides new evidence that the distribution of severe EPVS reflects the underlying arteriopathy type in spontaneous ICH.
We found EPVS in almost every participant in our study, and moderate to severe centrum semiovale and basal ganglia EPVS in more than 90% and 40% of them, respectively. To our knowledge, no previous imaging study has investigated the prevalence and distribution of EPVS in spontaneous ICH. A recent prospective study which evaluated EPVS in patients with acute lacunar stroke (n=129), cortical stroke (n=124) and age-matched non-stroke controls (n=97), found that EPVS were more prevalent in small vessel (lacunar) ischemic stroke than large vessel stroke.6 In this study, Doubal and colleagues6 used the same EPVS rating scale, applied to T2-weighted MR images, as in our study, thus allowing comparisons to be made. The mean total EPVS score in our ICH cohort (4.38, 95% CI 4.18 to 4.58) is close to that of patients with lacunar stroke (3.81, SD: 1.76), but higher than non-stroke controls (1.02, SD: 0.89).6 However, the absence of a non-ICH control group in our study makes it difficult to directly compare EPVS counts with other patient groups.
Although EPVS have not been studied in ICH cohorts, previous pathological and neuroimaging studies in other patient populations have shown a significant association between hypertension, white-matter changes, and EPVS.13 14 The associations we found between the severity of basal ganglia and total EPVS with the severity of white-matter changes further add to evidence that EPVS are an imaging manifestation of cerebral small vessel disease rather than an incidental finding. The association of EPVS with white-matter changes seems consistent across different populations including vascular dementia,15 Alzheimer's disease and mild cognitive impairment. A large population-based study also reported an association between the degree of EPVS and the volume of white-matter changes, as well as with the prevalence of lacunes.16
We also found that EPVS associations vary according to their distribution (table 3), suggesting different pathophysiological mechanisms relevant to the underlying arteriopathy in ICH. Basal ganglia EPVS were independently associated with age, white-matter changes burden and deep CMBs, suggesting hypertensive arteriopathy as a possible underlying mechanism. It is likely that at least some white-matter changes share a common pathophysiological mechanism with EPVS, perhaps related to blood-brain barrier disruption, a potentially key pathogenic process in cerebral small vessel disease.5 Indeed, it has been suggested that white-matter changes tend to form around EPVS,5 and that EPVS may be an early imaging marker of small vessel disease and blood-brain barrier alteration. By contrast, in the present study, EPVS in the centrum semiovale were only associated with age, and not with other imaging or clinical factors. In the study by Doubal et al6 in patients with minor ischaemic stroke, total EPVS were also associated with white-matter changes after adjusting for age, the presence of stroke and vascular risk factors (p<0.001); centrum semiovale EPVS were not associated with any explanatory variables, in keeping with our findings.6 It is thus possible that a distinct pathophysiological process other than hypertensive arteriopathy contributes to the development of centrum semiovale EPVS: CAA is a likely candidate, a hypothesis consistent with evidence that advancing age is the strongest clinical risk factor for sporadic CAA.2 Although we did not find a significant association between EPVS severity in the centrum semiovale and the presence of lobar microbleeds (a putative neuroimaging marker of CAA) at the 5% level, the OR suggests a possible effect (OR: 1.92; 95% CI 0.74 to 4.96; table 3); our ability to detect any association may be limited by our sample size and the high prevalence of hypertension, which can also contribute to lobar CMBs. In addition, the absence of association between basal ganglia and centrum semiovale EPVS severity (see online supplementary table S2) further supports the notion that EPVS in these two anatomical compartments are related to different pathophysiological processes.
Severe EPVS in our ICH cohort showed a different anatomical pattern depending on the location and the presumed small vessel arteriopathy underlying ICH. In patients with strictly lobar, presumed CAA-related ICH, the centrum semiovale was more often affected by severe EPVS compared with other ICH patients (figure 2). A predilection of severe EPVS for the centrum semiovale most parallels the topography of CAA pathology, since amyloid-β is deposited primarily in cortical and leptomeningeal small vessels, largely sparing small vessels in the basal ganglia.2 Moreover, several lines of evidence suggest that perivascular spaces have a key role in the pathophysiology of CAA.2 It is hypothesised that an important mechanism underlying vascular amyloid-β deposition is impaired clearance of amyloid-β along perivascular drainage pathways.2 As amyloid-β is deposited in the walls of small arteries, it could block perivascular drainage, leading to dilation of perivascular spaces downstream in the underlying deep white matter, even in regions not directly affected by CAA pathology. This regional preference for severe EPVS further supports our hypothesis that severe centrum semiovale EPVS are at least partly related to CAA, whereas, basal ganglia EPVS are most likely related to hypertensive arteriopathy affecting deep perforators. Severe centrum semiovale EPVS may, therefore, be a potential useful new neuroimaging marker of CAA, in an appropriate clinical context. The diagnosis of CAA currently depends on the radiological demonstration of multiple strictly lobar haemorrhages; existing criteria have high specificity but limited sensitivity.9 17 Whether severe EPVS presence and topography might usefully improve the sensitivity for current diagnostic criteria for CAA9 requires further study with pathological verification of CAA.
Our multicentre study has several strengths including the systematic evaluation of MRI scans by trained raters using validated scales for a range of imaging markers of small vessel disease, and the use of a validated EPVS rating scale.6 A potential limitation is the lack of pathological confirmation of the CAA pathology as a cause of ICH, in view of the imperfect sensitivity and specificity of the Boston criteria (particularly their overall sensitivity and the specificity of the ‘possible CAA’ category).9 We may thus have misclassified some patients as CAA-related ICH when their ICH was related to hypertensive arteriopathy. It is also likely that some of the patients with ‘other ICH’ (eg, spontaneous deep ICH), many of whom had lobar CMBs, not classified as CAA related might in fact have some degree of CAA pathology as well as hypertensive arteriopathy. However, any misclassification of patients would tend to bias toward a null result (no between-group differences in EPVS severity or distribution), suggesting that EPVS may in fact be a more powerful marker for CAA than we have been able to demonstrate here. It was not possible to blind the EPVS rater to ICH location, potentially introducing a bias towards the study hypothesis. We also acknowledge the potential of bias in our sample, as MRIs were done as part of routine clinical care, and many patients were excluded from this analysis because of inadequate MRI data. Finally, due to the retrospective and cross-sectional nature of our study we were not able to determine the prognostic significance of EPVS in this cohort.
In summary, we found that EPVS are present in almost all patients with spontaneous ICH, but with evidence for different underlying mechanisms according to their distribution. Basal ganglia EPVS severity is associated with markers of hypertensive arteriopathy including white-matter changes and deep CMBs, while centrum semiovale EPVS are associated with age and are more often severe in patients with strictly lobar ICH attributed to CAA. A predilection of severe EPVS for the centrum semiovale rather than the basal ganglia may, therefore, be secondary to, and indicative of, CAA. Further studies with pathological verification are needed to determine the relevance of EPVS for improving the sensitivity of CAA diagnostic criteria. Longitudinal studies are required to explore whether EPVS are an early feature of the small vessel disease underlying ICH, their change over time, and prognostic implications for clinical outcome.12 18
Supplementary Material
Acknowledgments
Dr Andreas Charidimou receives research support from the Greek State Scholarship Foundation, the Stroke Association and the British Heart Foundation. Dr Rolf Hans Lager receives support by the Samantha Dickson Brain Tumour Trust and the Brain Research Trust. Dr David J Werring is supported by the Department of Health/Higher Education Funding Council for England (Clinical Senior Lectureship Award), the Stroke Association and the British Heart Foundation. Part of this work was undertaken at UCLH/UCL who received a proportion of funding from the Department of Health's NIHR Biomedical Research Centres funding scheme.
Footnotes
Contributors: AC: project design, data collection, data analysis, write up; RM: data collection, data analysis; ZF: data analysis, data interpretation, critical revisions; AP: data collection, critical revisions; YV: data collection, critical revisions; PL: data collection, critical revisions; JCB: data collection, critical revisions; HRJ: imaging analysis advice, critical revisions; DJW: project design, supervision, write up; Statistical analysis was conducted by AC and ZF.
Competing interests: None.
Ethics approval: The study received ethical approval by the National Hospital for Neurology and Neurosurgery and Institute of Neurology Joint Research Ethics Committee, the Commission d'Ethique Biomedicale Hospitalo Facultaire of the Faculte de Medicine (Universite Catholique de Louvain), and the Comite d'ethique medicale of the Cliniques Universitaires UCL de Mont Godinne.
Provenance and peer review: Not commissioned; externally peer reviewed.
References
- 1.Qureshi AI, Mendelow AD, Hanley DF. Intracerebral haemorrhage. Lancet 2009;373:1632–44 [DOI] [PMC free article] [PubMed] [Google Scholar]
- 2.Charidimou A, Gang Q, Werring DJ. Sporadic cerebral amyloid angiopathy revisited: recent insights into pathophysiology and clinical spectrum. J Neurol Neurosurg Psychiatry 2012;83:124–37 [DOI] [PubMed] [Google Scholar]
- 3.Ozturk MH, Aydingoz U. Comparison of MR signal intensities of cerebral perivascular (Virchow-Robin) and subarachnoid spaces. J Comput Assist Tomogr 2002;26:902–4 [DOI] [PubMed] [Google Scholar]
- 4.Marin-Padilla M, Knopman DS. Developmental aspects of the intracerebral microvasculature and perivascular spaces: insights into brain response to late-life diseases. J Neuropathol Exp Neurol 2011;70:1060–9 [DOI] [PMC free article] [PubMed] [Google Scholar]
- 5.Wardlaw JM. Blood-brain barrier and cerebral small vessel disease. J Neurol Sci 2010;299:66–71 [DOI] [PubMed] [Google Scholar]
- 6.Doubal FN, MacLullich AM, Ferguson KJ, et al. Enlarged perivascular spaces on MRI are a feature of cerebral small vessel disease. Stroke 2010;41:450–4 [DOI] [PubMed] [Google Scholar]
- 7.Zhu YC, Dufouil C, Mazoyer B, et al. Frequency and location of dilated Virchow-Robin spaces in elderly people: a population-based 3D MR imaging study. AJNR Am J Neuroradiol 2011;32:709–13 [DOI] [PMC free article] [PubMed] [Google Scholar]
- 8.Barkhof F. Enlarged Virchow-Robin spaces: do they matter? J Neurol Neurosurg Psychiatry 2004;75:1516–17 [DOI] [PMC free article] [PubMed] [Google Scholar]
- 9.Knudsen KA, Rosand J, Karluk D, et al. Clinical diagnosis of cerebral amyloid angiopathy: validation of the Boston criteria. Neurology 2001;56:537–9 [DOI] [PubMed] [Google Scholar]
- 10.Gregoire SM, Chaudhary UJ, Brown MM, et al. The Microbleed Anatomical Rating Scale (MARS): reliability of a tool to map brain microbleeds. Neurology 2009;73:1759–66 [DOI] [PubMed] [Google Scholar]
- 11.Wahlund LO, Barkhof F, Fazekas F, et al. A new rating scale for age-related white matter changes applicable to MRI and CT. Stroke 2001;32:1318–22 [DOI] [PubMed] [Google Scholar]
- 12.Maclullich AM, Wardlaw JM, Ferguson KJ, et al. Enlarged perivascular spaces are associated with cognitive function in healthy elderly men. J Neurol Neurosurg Psychiatry 2004;75:1519–23 [DOI] [PMC free article] [PubMed] [Google Scholar]
- 13.Gouw AA, Seewann A, van der Flier WM, et al. Heterogeneity of small vessel disease: a systematic review of MRI and histopathology correlations. J Neurol Neurosurg Psychiatry 2011;82:126–35 [DOI] [PubMed] [Google Scholar]
- 14.Bokura H, Kobayashi S, Yamaguchi S. Distinguishing silent lacunar infarction from enlarged Virchow-Robin spaces: a magnetic resonance imaging and pathological study. J Neurol 1998;245:116–22 [DOI] [PubMed] [Google Scholar]
- 15.Patankar TF, Mitra D, Varma A, et al. Dilatation of the Virchow-Robin space is a sensitive indicator of cerebral microvascular disease: study in elderly patients with dementia. AJNR Am J Neuroradiol 2005;26:1512–20 [PMC free article] [PubMed] [Google Scholar]
- 16.Zhu YC, Tzourio C, Soumare A, et al. Severity of dilated Virchow-Robin spaces is associated with age, blood pressure, and MRI markers of small vessel disease: a population-based study. Stroke 2010;41:2483–90 [DOI] [PubMed] [Google Scholar]
- 17.van Rooden S, van der Grond J, van den Boom R, et al. Descriptive analysis of the Boston criteria applied to a Dutch-type cerebral amyloid angiopathy population. Stroke 2009;40:3022–7 [DOI] [PubMed] [Google Scholar]
- 18.Zhu YC, Dufouil C, Soumare A, et al. High degree of dilated Virchow-Robin spaces on MRI is associated with increased risk of dementia. J Alzheimers Dis 2010;22:663–72 [DOI] [PubMed] [Google Scholar]
Associated Data
This section collects any data citations, data availability statements, or supplementary materials included in this article.