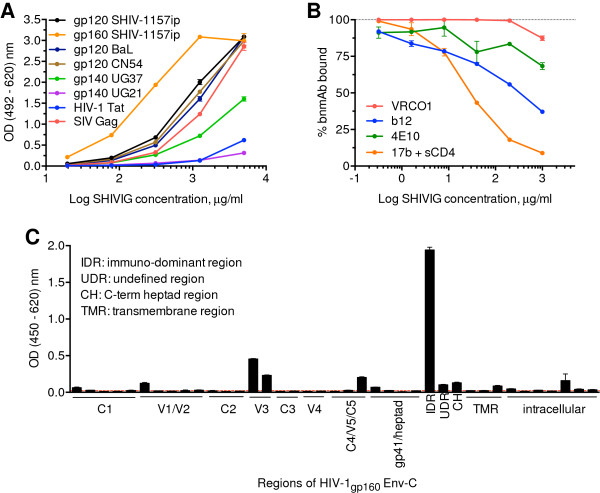
Figure 1.
SHIVIG characterization. A. SHIVIG binding to soluble HIV and SIV proteins was tested by ELISA. Proteins were captured on the plates and probed with serial dilutions of SHIVIG. Binding was detected as described in Methods. Each data point represents the mean ± SEM (n = 3). Env proteins were derived from the following HIV or SHIV strains: clade A, UG37; B, BaL; C, CN54 and SHIV-1157ip; D, UG21. B. Competitive ELISA with the CD4-binding site-specific bnmAbs b12 and VRC01; gp41 MPER-specific bnmAb 4E10; and CD4-inducible site-specific bnmAb 17b. Plates were coated with HIV-1CN54 gp120 for b12 and VRC01 analysis or SHIV-1157i gp160 for 4E10 and further incubated with 0.5 μg/ml of the bnmAb indicated along with different concentrations of SHIVIG in duplicates or triplicates. For 17b mAb, HIV-1CN54 gp120 was captured by polyclonal sheep anti-gp120 Abs coated on the plate and the assay was continued as described in Methods. The y-axis indicates OD percentage of maximal binding, which is determined as the reading without SHIVIG (100% binding is marked by dashed line). The irrelevant mAb Fm-6 (anti-SARS virus) and naïve RM IgG were used as negative controls (not depicted). C. ELISA of SHIVIG with consensus clade C Env peptides. The x-axis designates pools of peptides assigned to HIV-1 Env regions. Dotted line represents background. IDR, immunodominant region; UDR, undefined region in gp41; CH, C-terminal heptad region; TMR, transmembrane region. Each data point represents the mean ± SEM (n = 3). All experiments were repeated at least twice.

