Abstract
Huntington’s disease has been associated with a failure in energy metabolism and oxidative damage. Ascorbic acid is a powerful antioxidant highly concentrated in the brain where it acts as a messenger, modulating neuronal metabolism. Using an electrophysiological approach in R6/2 HD slices, we observe an abnormal ascorbic acid flux from astrocytes to neurons, which is responsible for alterations in neuronal metabolic substrate preferences. Here using striatal neurons derived from knock-in mice expressing mutant huntingtin (STHdhQ cells), we study ascorbic acid transport. When extracellular ascorbic acid concentration increases, as occurs during synaptic activity, ascorbic acid transporter 2 (SVCT2) translocates to the plasma membrane, ensuring optimal ascorbic acid uptake for neurons. In contrast, SVCT2 from cells that mimic HD symptoms (dubbed HD cells) fails to reach the plasma membrane under the same conditions. We reason that an early impairment of ascorbic acid uptake in HD neurons could lead to early metabolic failure promoting neuronal death.
 Defective ascorbic acid flux is a sign of metabolic failure associated with Huntington’s disease. Here, Acuña et al. show that reduction in ascorbic acid flux from astrocytes precedes the symptoms of Huntington’s disease in mice and impairs ascorbic acid uptake in neurons.
Huntington’s disease (HD) is a progressive, autosomal dominant, neurodegenerative disorder1. The disease is caused by an expanded polyglutamine (polyQ) stretch in the IT15 gene, resulting in major cell loss in the striatum2. The IT15 gene codes for a protein called huntingtin (Htt). Wild-type (WT) Htt has an important role in the intracellular transport of vesicles, organelles and trafficking of proteins to the cell surface3,4. Expansion of a glutamine stretch within the Htt protein to >40 repeats (mHtt) appears to confer a dominant toxic property that is deleterious to neurons and detrimental to normal Htt biological activities.
Defects in energy metabolism have been observed in presymptomatic and symptomatic subjects5,6,7,8,9. This deregulation in brain energy metabolism makes it reasonable to suspect the presence of increased amounts of oxidative species. Indeed, oxidative damage is evident, as well as impaired superoxide dismutase (SOD) activity8 and a decrease in ascorbic acid levels10,11. Ascorbic acid is an important antioxidant that is concentrated in the brain12. It plays a fundamental role in the modulation of neuronal metabolism (for reviews, refer to the studies by Castro et al.13 and Beltrán et al.14). During synaptic activity, ascorbic acid is released into the extracellular space15,16,17,18 and is taken up by neuronal cells19. This uptake of ascorbic acid occurs via a specific neuronal ascorbic acid transporter, the sodium-dependent vitamin C transporter, SVCT220. Intracellular ascorbic acid is able to sustain an adequate energy supply that induces uptake of monocarboxylates such as pyruvate and lactate21. It is also used to maintain redox balance in the cell12.
R6/2 is a transgenic mouse model that expresses exon 1 protein of human Htt, which contains ~150 CAG repeats. These mice develop a neurological phenotype that mimics the disease characteristics including many of the motor-control deficits that are characteristic of HD22,23 and show a pronounced and sustained loss of ascorbic acid in the extracellular fluid. This only occurs during periods of behavioural activation. Rather than demonstrating a deficit in brain ascorbic acid, these mice seem unable to maintain adequate levels of ascorbic acid during behavioural activation. Thus, a failure in ascorbic acid uptake may be closely linked with metabolic failure and redox imbalance in HD.
In this study, we demonstrate that a failure in ascorbic acid flux from astrocytes to neuronal cells occurs and that this phenomenon precedes the onset of HD-like symptoms in mice. The failure is accompanied by an alteration in neuronal metabolic energy substrate preferences. We also show a failure in neuronal ascorbic acid uptake in an HD mouse and cellular models. In cells that express mutant Htt (mHtt), Huntingtin-associated protein 1-SVCT2 (HAP1-SVCT2) colocalization is decreased and the neuronal ascorbic acid transporter, SVCT2, fails to reach the plasma membrane. Ascorbic acid is an essential protector against oxidative damage in brain neurons and modulates neuronal metabolism during synaptic activity. Therefore, early failure in ascorbic acid release could lead to metabolic failure and early impairment in the maintenance of synaptic transmission in basal ganglia. Such a failure in ascorbic acid uptake in symptomatic HD subjects could promote neuronal death.
Results
Glial-neuron ascorbic acid flux is impaired in R6/2 mice
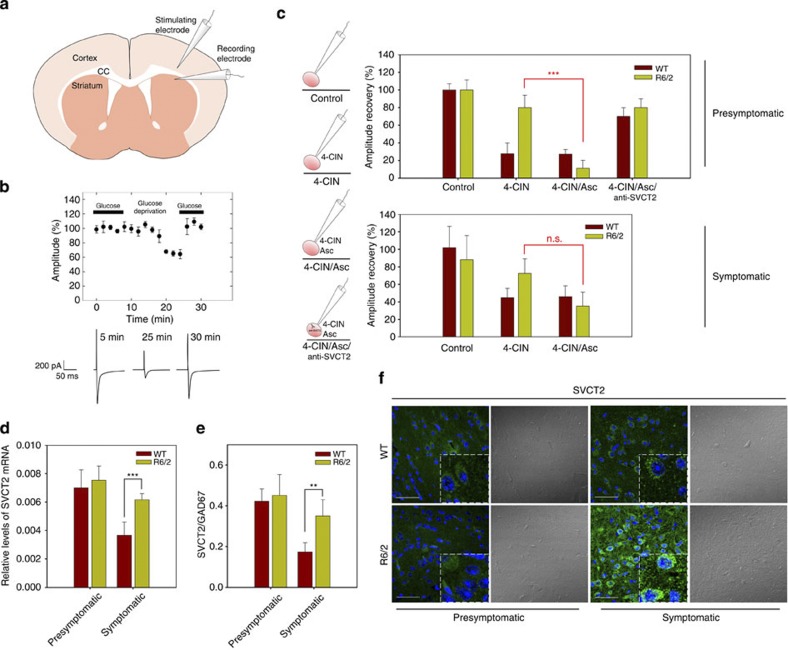
Ascorbic acid flux from astrocytes to neurons during synaptic activity is essential to protect neurons against oxidative damage and for modulation of neuronal metabolism, thus permitting optimal ATP production. According to our previous data, ascorbic acid inhibits glucose consumption and stimulates lactate uptake during glutamatergic synaptic activity (ascorbic acid metabolic switch19,21). We were interested in determining whether the ascorbic acid metabolic switch functions in R6/2 transgenic mice that carry HD gene, as HD mice have been shown to be unable to maintain adequate levels of ascorbic acid during behavioural activation22,24 and HD has also been associated with a failure in brain energy metabolism. In our studies of mice striatal slices, we have shown that intracellular ascorbic acid inhibits the ability of glucose to sustain excitatory postsynaptic currents (EPSCs) when neuronal lactate uptake is inhibited (Fig. 1, Table 1). EPSCs were evoked by stimulating the corticostriatal pathway (Fig. 1a). After glucose deprivation, glucose application produced a fast recovery of synaptic responses (Fig. 1b), as much in WT mice as in both presymptomatic and symptomatic R6/2 mice (Fig. 1c, control). In the presence of external 100 μM alpha-cyano-4-hydroxycinnamic acid (4-CIN), an inhibitor of the neuronal monocarboxylate transporter MCT2, glucose was able to restore EPSCs only in presymptomatic (80.0±14.1%) and symptomatic (72.3±16.4%) R6/2 mice (Fig. 1c, 4-CIN). Thus, in WT mice, glucose is not able to sustain neural function when monocarboxylate uptake is inhibited (27.8±12.0% and 44.8±10.6% for EPSC amplitudes after a period of glucose deprivation in presymptomatic and symptomatic WT slices, respectively). In presymptomatic and symptomatic R6/2 mice, 4-CIN did not affect the ability of glucose to sustain EPSCs. Given these findings, our experiments strongly suggest that the ANLS (astrocyte-neuron lactate shuttle) is necessary to maintain adequate ATP levels in healthy cells, a normal mechanism that is impaired in HD neurons. When extracellular ascorbic acid was applied, we observed a strong decrease in the amplitude of the EPSCs after a period of glucose deprivation in presymptomatic R6/2 slices (Fig. 1c, 4-CIN/Asc). In symptomatic R6/2 slices, we saw no significant decrease in the amplitude of EPSCs after glucose deprivation (Fig. 1c, 4-CIN/Asc). So, ANLS would seem to function in presymptomatic R6/2 slices by over-supplementation of extracellular ascorbic acid. This effect was reversed when ascorbic acid uptake was inhibited (by including an anti-SVCT2 antibody in the recording pipette; Fig. 1c, 4-CIN/Asc/anti-SVCT2). This antibody inhibits ascorbic acid uptake by binding to the endofacial side of SVCT219. In conclusion, the ANLS and the ascorbic acid metabolic switch do not function in the striatum of presymptomatic R6/2 mice due to the fact that ascorbic acid release from glial cells seems to be decreased in these mice. The ANLS and ascorbic acid metabolic switch is also impaired in symptomatic R6/2 mice, though in these mice, this dysfunction appears to arise from a failure in ascorbic acid uptake rather than from a decreased release of ascorbic acid from glial cells.
Figure 1. Ascorbic acid flux from glial cells to neurons is impaired in R6/2 mice.
(a) Schematic drawing of the experimental set-up showing positions of the stimulating electrode at corpus callosum (CC) and the recording electrode at dorsolateral striatum. (b) Time course of EPSC amplitudes in control experiment (with and without glucose). Representative EPSCs for a glucose-deprived slice (presymptomatic, WT). Calibration bar: 200 pA, 50 ms. (c) Schematic representation of experiments using the whole-cell patch-clamp configuration. Bar plots for EPSC amplitudes after glucose deprivation (amplitude recovery) with the treatments indicated in presymptomatic (3–4 weeks old) and symptomatic (10–12 weeks old) mice. Complete statistical analysis is shown in Table 1, n=5 for every condition, ***P<0.001. (d,e) qPCR assay for SVCT2 from mRNA extracts of striatum of presymptomatic (R6/2) and symptomatic (R6/2) mice. Striatum samples from littermate controls (WT) were used as controls. The results were normalized using specific primers to amplify mRNAs coding for β-actin and for GAD67, a 67-kDa isoform of glutamic acid decarboxylase, a marker for striatal neurons. Student’s t-test, n=4 for every condition, ***P<0.001. (f) Immunofluorescence analyses for SVCT2 (green, left side) in the striatum of R6/2 (showing HD symptoms) and WT mice. To the right are images produced with transmitted light DIC microscopy. Scale bars are 50 μm.
Table 1. Statistical analyses for amplitude recovery of EPSCs after glucose deprivation in striatal slices of R6/2 mice.
| Comparison | Significant | |
|---|---|---|
| Presymptomatic | ||
| Control WT versus Control HD | No | ns |
| Control WT versus 4-CIN WT | Yes | *** |
| Control WT versus 4-CIN HD | No | ns |
| Control WT versus Asc 4-CIN WT | Yes | *** |
| Control WT versus Asc 4-CIN HD | Yes | *** |
| Control WT versus Asc/anti-SVCT2/4-CIN WT | No | ns |
| Control WT versus Asc/anti-SVCT2/4-CIN HD | No | ns |
| Control HD versus 4-CIN WT | Yes | *** |
| Control HD versus 4-CIN HD | No | ns |
| Control HD versus 4-CIN/Asc WT | Yes | *** |
| Control HD versus 4-CIN/Asc HD | Yes | *** |
| Control HD versus Asc/anti-SVCT2/4-CIN WT | No | ns |
| Control HD versus Asc/anti-SVCT2/4-CIN HD | No | ns |
| 4-CIN WT versus 4-CIN HD | Yes | *** |
| 4-CIN WT versus 4-CIN/Asc WT | No | ns |
| 4-CIN WT versus 4-CIN/Asc HD | No | ns |
| 4-CIN WT versus Asc/anti-SVCT2/4-CIN WT | Yes | *** |
| 4-CIN WT versus Asc/anti-SVCT2/4-CIN HD | Yes | *** |
| 4-CIN HD versus 4-CIN/Asc WT | Yes | *** |
| 4-CIN HD versus 4-CIN/Asc HD | Yes | *** |
| 4-CIN HD versus Asc/anti-SVCT2/4-CIN WT | No | ns |
| 4-CIN HD versus Asc/anti-SVCT2/4-CIN HD | No | ns |
| 4-CIN/Asc WT versus 4-CIN/Asc HD | No | ns |
| 4-CIN/Asc WT versus Asc/anti-SVCT2/4-CIN WT | Yes | *** |
| 4-CIN/Asc WT versus Asc/anti-SVCT2/4-CIN HD | Yes | *** |
| 4-CIN/Asc HD versus Asc/anti-SVCT2/4-CIN WT | Yes | *** |
| 4-CIN/Asc HD versus Asc/anti-SVCT2/4-CIN HD | Yes | *** |
| Asc/anti-SVCT2/4-CIN WT versus Asc/anti-SVCT2/4-CIN HD | No | ns |
| Symptomatic | ||
| Control WT versus Control HD | No | ns |
| Control WT versus 4-CIN WT | Yes | * |
| Control WT versus 4-CIN HD | No | ns |
| Control WT versus 4-CIN/Asc WT | Yes | * |
| Control WT versus 4-CIN/Asc HD | Yes | * |
| Control HD versus 4-CIN WT | Yes | * |
| Control HD versus 4-CIN HD | No | ns |
| Control HD versus 4-CIN/Asc WT | Yes | * |
| Control HD versus 4-CIN/Asc HD | Yes | * |
| 4-CIN WT versus 4-CIN HD | No | ns |
| 4-CIN WT versus 4-CIN/Asc WT | No | ns |
| 4-CIN WT versus 4-CIN/Asc HD | No | ns |
| 4-CIN HD versus 4-CIN/Asc WT | No | ns |
| 4-CIN HD versus 4-CIN/Asc HD | No | ns |
| 4-CIN/Asc WT versus 4-CIN/Asc HD | No | ns |
Analysis of variance (ANOVA) followed by the Bonferroni post-test, n=5, ***P<0.001, *P<0.05.
To investigate whether the failure in ascorbic acid uptake may be related to a deficiency in SVCT2 expression, we analysed mRNA and protein levels in samples obtained from mice striata. RT–qPCR analyses showed increased levels of mRNA coding for SVCT2 in symptomatic R6/2 mice, while mRNA levels were not affected in presymptomatic R6/2 mice (Fig. 1d,e). Relative levels of SVCT2 were also increased in symptomatic R6/2 mice as seen by immunofluorescence analysis (Fig. 1f). In presymptomatic R6/2 mice, SVCT2 expression did not seem to be altered (Fig. 1d–f). Thus, before the onset of HD-like symptoms, SVCT2 expression and function should be normal. After the onset of HD-like symptoms, ascorbic acid uptake seems to be impaired, although SVCT2 expression is increased.
Ascorbic acid transport in cellular model of HD is impaired
To visualize the possibility that neuronal ascorbic acid transport is impaired in a cellular model of HD, we studied SVCT2 expression and function in STHdhQ7 and STHdhQ111 cell lines. Obtained from huntingtin (Htt) mouse knock-in embryos, STHdhQ is a cell line of immortalized striatal neurons that accurately express endogenous levels of normal and mutant huntingtin (Htt), and are so dubbed HD cells. WT STHdhQ7 cells express Htt containing 7 glutamine repeats, while mutant STHdhQ111 cells express Htt containing 109 glutamine repeats25. To simplify, we can refer to WT and mutant cells as Q7 and Q111 cells respectively.
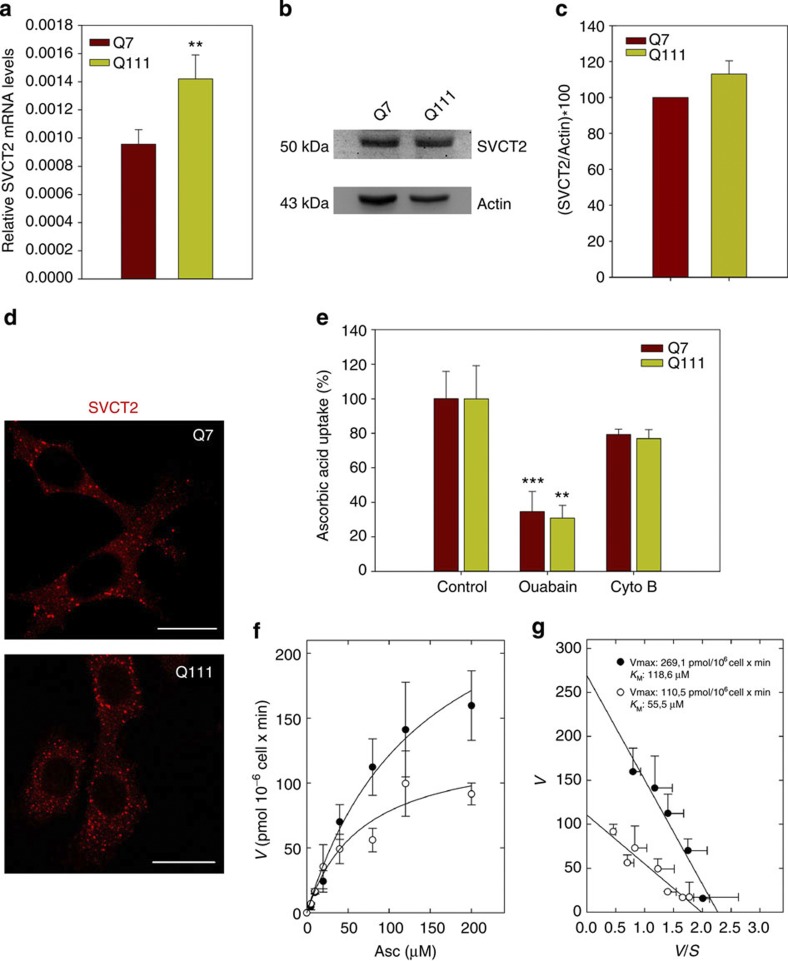
As for symptomatic R6/2 mice, qPCR analyses showed an increased mRNA coding for SVCT2 in Q111 cells (Fig. 2a). We apparently found increased SVCT2 levels with western blot analysis (Fig. 2b,c, Supplementary Figs S1 and S2); however, this was not significant. Immunofluorescence analyses showed strong immunoreactive spots throughout the cell body (Fig. 2d). Immunoreactivity seemed to be more abundant in Q111 than Q7 cells. Both Q7 and Q111 cells showed ascorbic acid uptake. To demonstrate that ascorbic acid transport was specific, we investigated the sodium dependence of uptake. Ascorbic acid transport was measured using 1 min uptake assays in the presence of the Na+,K+-ATPase inhibitor, ouabain and the non-related inhibitor cytochalasin B (Cyto B, Fig. 2e). Incubation with ouabain decreased ascorbic acid uptake by 65.4 and 69.1% in Q7 and Q111 cells, respectively. Additional assays were performed to determine kinetic parameters (Fig. 2f,g). Q7 cells showed an apparent Km of 118.6 μM, a value comparable to the Km described for SVCT220,26,27. Surprisingly, the apparent Km for Q111 cells (55.5 μM) was lower than that for Q7 cells, implying an increased affinity for ascorbic acid in HD cells. The higher affinity for ascorbic acid in Q111 cells was negatively compensated with a low Vmax (Vmax=269.1 pmoles per 106 cells × min for Q7 cells and 110.5 pmoles/106cell × min for Q111 cells). A decrease in Vmax could be interpreted as a decrease in the number of transporters at the plasma membrane or as a decrease in the efficiency of the transporter (kcat). With biotinylation assays, no changes were seen in SVCT2 levels at the plasma membrane on comparing Q7 and Q111 cells (Fig. 4e,f). Therefore, SVCT2 expression is increased in Q111 cells, but the number of transporters at the plasma membrane remains the same as for Q7 cells, implying a decrease in SVCT2 efficiency.
Figure 2. Ascorbic acid transport in HD cells is impaired.
(a) qPCR analyses for mRNA coding for SVCT2 in Q7 and Q111 cells. Student’s t-test, n=4, **P<0.01. (b,c) Western blot assay for SVCT2 of total protein extracts from Q7 and Q111 cells. Full unedited blot including molecular weight markers is shown in Supplementary Figs S1 and S2. Bar plots show quantification of SVCT2 western blot by densitometric scanning analysis. (d) Immunofluorescence analyses for SVCT2 (red) in Q7 and Q111 cells. Scale bars are 20 μm. (e) 14C-ascorbic acid transport analysis using a 1-min uptake assay (37 °C) in Q7 and Q111 cells. Inhibitors were preincubated for periods of 15 min (cytochalasin B, Cyto B) or 60 min (Ouabain) before performing the transport experiment. The absolute values of 14C-ascorbic acid uptake in controls were 157.1±19.2 (Q7 cells) and 70.0±11.1 (Q111 cells) pmol min−1 × 10⁶ cells. Student’s t-test, n=4, **P<0.01, ***P<0.001. (f) Dose–response curve of 14C-ascorbic acid, transport using a 1-min uptake assay at 37 °C in Q7 and Q111 cells. (g) Eadie–Hofstee plot. Data represent the mean±s.d. of four experiments. Single rectangular hyperbolae and lines were fitted using nonlinear regression (e) and linear regression (f). Linear and non-linear regressions were calculated using SigmaPlot v9.0 software (only correlations >0.9 were accepted).
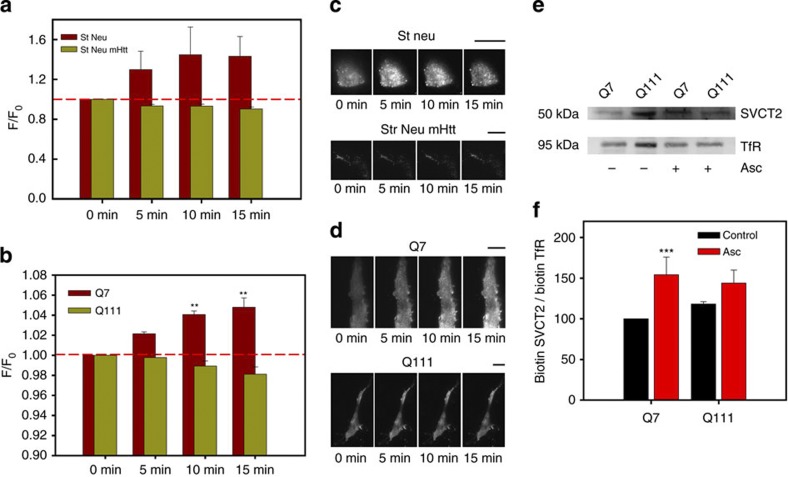
Figure 4. Extracellular ascorbic acid preincubation induces translocation of SVCT2 to the plasma membrane.
(a,b) Bar plots for normalized fluorescence intensity obtained from TIRF microscopy images in primary cultures of striatal neurons expressing SVCT2-EGFP (St Neu), mHtt-DsRED (St Neu mHtt), Q7 and Q111 cells expressing SVCT2-EGFP. Analysis of variance (ANOVA) followed by the Bonferroni post-test, n=4 (Q cells, eight cells for every condition), n=3 (striatal neurons, six cells for every condition), **P<0.01. (c,d) TIRF microscopy images for SVCT2-EGFP showing a representative striatal neuron or Q cell. Data represent the mean±s.d. of eight cells. Scale bars are 10 μm. (e) Western blot analyses of biotinylated proteins from Q7 and Q111 cells. Where indicated, cells were preincubated with 1 mM ascorbic acid for 10 min prior to the biotinylation assay. Full unedited blot including molecular weight markers is shown in Supplementary Figs S3 and S4. (f) Bar plots for densitometric scanning analysis of the SVCT2 western blot. Student’s t-test, n=4, ***P<0.001.
Mutant Huntingtin impairs SVCT2 translocation
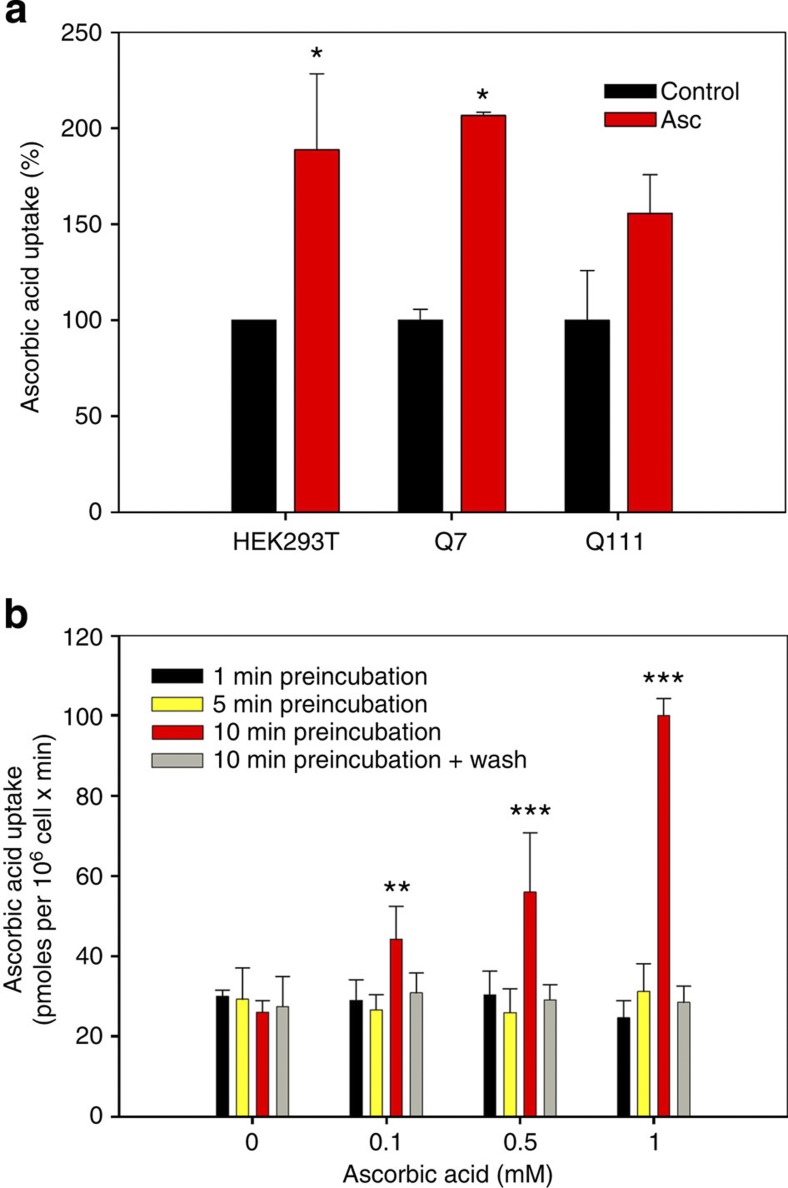
Synaptic activity is expensive in energetic terms. The continual production of energy and the metabolism of neurotransmitters require antioxidants to maintain redox balance. As synaptic activity is known to induce an increase in extracellular ascorbic acid concentration, we measured 14C-ascorbic acid uptake in Q cells preincubated with non-radioactive ascorbic acid (Fig. 3). 14C-ascorbic acid uptake in preincubated Q7 cells increased by ~200% (Fig. 3a). This effect was not significant for Q111 cells, with an increased uptake of ~150% (Fig. 3a). We also studied 14C-ascorbic acid uptake stimulation induced by preincubation with non-radioactive ascorbic acid in the non-neuronal cell line, HEK293, which expresses endogenous SVCT2 (ref. 21). The effect of preincubating with ascorbic acid was dose- and time-dependent and was reversible (Fig. 3b). We reasoned that an increase in 14C-ascorbic acid uptake is possible due to an increased number of transporters at the plasma membrane or an increase in uptake efficiency. We tested the first hypothesis using total internal reflection fluorescence (TIRF) microscopy in both Q cells and cultured striatal neurons expressing SVCT2-EGFP. We observed a significant increase in fluorescence corresponding to SVCT2-EGFP at the plasma membrane after preincubation with ascorbic acid in Q7 cells (Fig. 4b,d) and in cultured striatal neurons (Fig. 4a,c). However, no changes were observed in fluorescence intensity for Q111 cells (Fig. 4b,d) and cultured striatal neurons that expressed mHtt-DsRED (Fig. 4a,c). TIRF results were supported by biotinylation (Fig. 4e,f, Supplementary Figs S3 and S4) and immunofluorescence assays (Fig. 5a). It would seem therefore that SVCT2 is translocated to the plasma membrane in response to an increase in extracellular ascorbic acid concentration. SVCT2-plasma membrane colocalization is weakly observed in cells expressing mtHtt, implying that SVCT2 translocation is Htt-dependent.
Figure 3. Extracellular ascorbic acid preincubation stimulates ascorbic acid transport.
(a) Bar plots for 14C-ascorbic acid transport analysis using a 1-min uptake assay (37 °C) in Q7, Q111 and HEK293T cells. Cells were pretreated with 1 mM non-radioactive ascorbic acid for 5 min (HEK293T cells) or 10 min (Q cells) prior to performing the uptake assay. (b) Bar plots for 14C-ascorbic acid transport analysis using a 1-min uptake assay (37 °C) in HEK293T cells. Cells were preincubated with non-radioactive ascorbic acid at the concentrations indicated, for the times indicated. Analysis of variance (ANOVA) followed by the Bonferroni post-test, n=4, ***P<0.001, **P<0.01, *P<0.05.
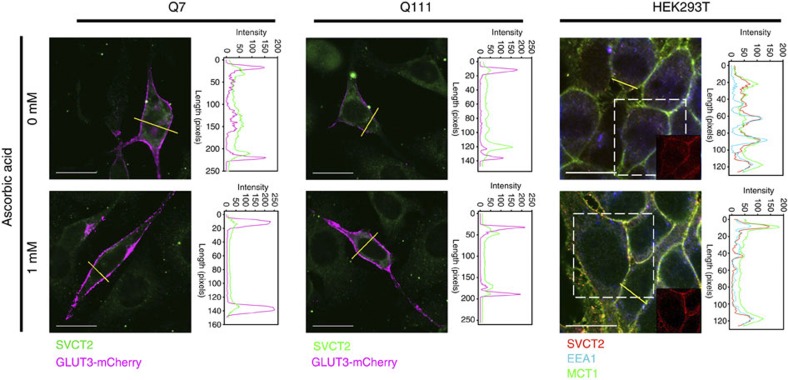
Figure 5. Intracellular SVCT2 moves from early endosomes to the plasma membrane in response to extracellular ascorbic acid.
Immunofluorescence analyses for SVCT2 (green) Q cells expressing the plasma membrane marker, glucose transporter type 3-mCherry (GLUT3-mCherry, magenta) pretreated with ascorbic acid for 10 min at the given concentrations. Immunofluorescence analyses for SVCT2 (red), early endosome-associated protein 1 (EEA1, early endosome marker, blue) and the plasma membrane marker (monocarboxylate transporter 1, MCT1, green) in HEK293T cells pretreated with ascorbic acid for 10 min at the concentrations indicated. Line-scan data for yellow lines drawn across cells is shown next to each picture. Scale bars are 20 μm.
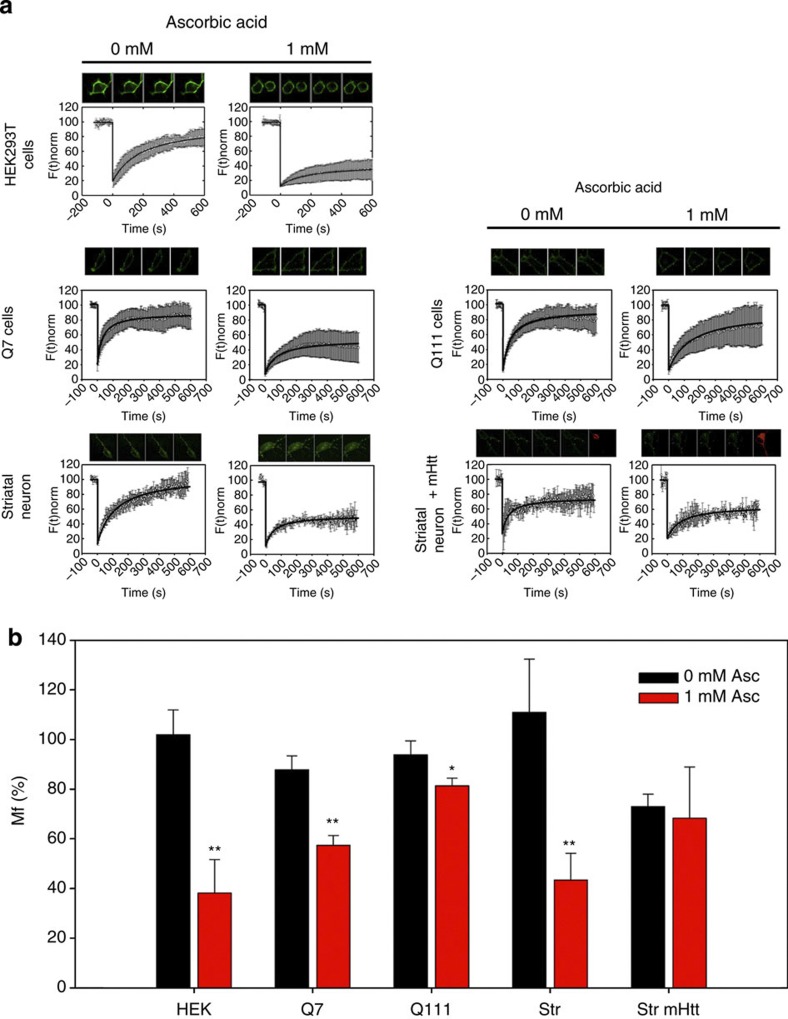
Under resting conditions (in which the extracellular ascorbic acid concentration is 0–200 μM) SVCT2 is located mainly at intracellular compartments and shows colocalization with early endosome markers (Fig. 5). We measured the mobile fraction (Mf) of SVCT2-EGFP with fluorescence recovery after photobleaching (FRAP) experiments in Q cells, striatal neurons and in HEK293 cells. Mf is represented by molecules that contribute to the fluorescence recovery. The FRAP recovery curve does not always reach the original level of fluorescence intensity. The plateau level is often lower than the original fluorescence intensity because some bleached molecules at the region of interest are immobile and they do not contribute to the fluorescence recovery. SVCT2 present in vesicles should be more mobile than SVCT2 present at the plasma membrane. Indeed, after preincubation with ascorbic acid, the Mf for SVCT2 decreases in Q7, in cultured striatal neurons and in HEK293 cells (Fig. 6). Less significant changes in Mf were observed in Q111 cells, while no changes in Mf were observed in cultured striatal neurons expressing mHtt (Fig. 6), which suggests that SVCT2 remains contained within vesicular intracellular compartments. The weaker effect observed in Q111 cells could be due to differences in mHtt expression. Q111 cells are derived from knock-in embryos, while neuronal cells are overexpressing mHtt.
Figure 6. SVCT2 moves to a less mobile compartment after extracellular ascorbic acid incubation.
(a) Recovery curves for FRAP experiments in cells pretreated with ascorbic acid. Left: FRAP experiments for SVCT2-EGFP in HEK293T cells, Q7 cells and primary cultures of striatal neurons. Right: FRAP experiments for SVCT2-EGFP in Q111 cells and primary cultures of striatal neurons expressing mHtt-DsRED (mHtt). (b) Bar plots for Mf calculated from FRAP experiments in HEK293T cells, Q cells, cultured striatal neurons and cultured striatal neurons expressing mHtt-DsRED. Cells were pretreated with 0 or 1 mM ascorbic acid for 10 min at 37 °C. Student’s t-test, n=6 (HEK293 cells, 12 cells for every condition), n=4 (Q cells, 8 cells for every condition), n=3 (striatal neurons, 6 cells for every condition) **P<0.01, *P<0.05.
Cycling of SVCT2 is altered in cells expressing mHtt
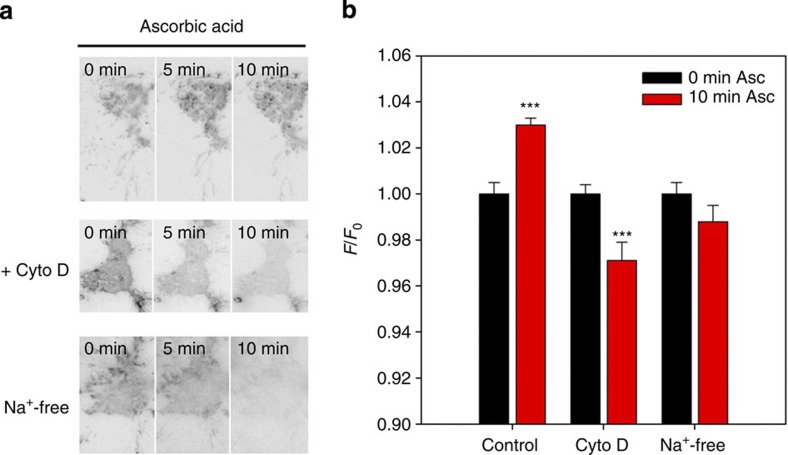
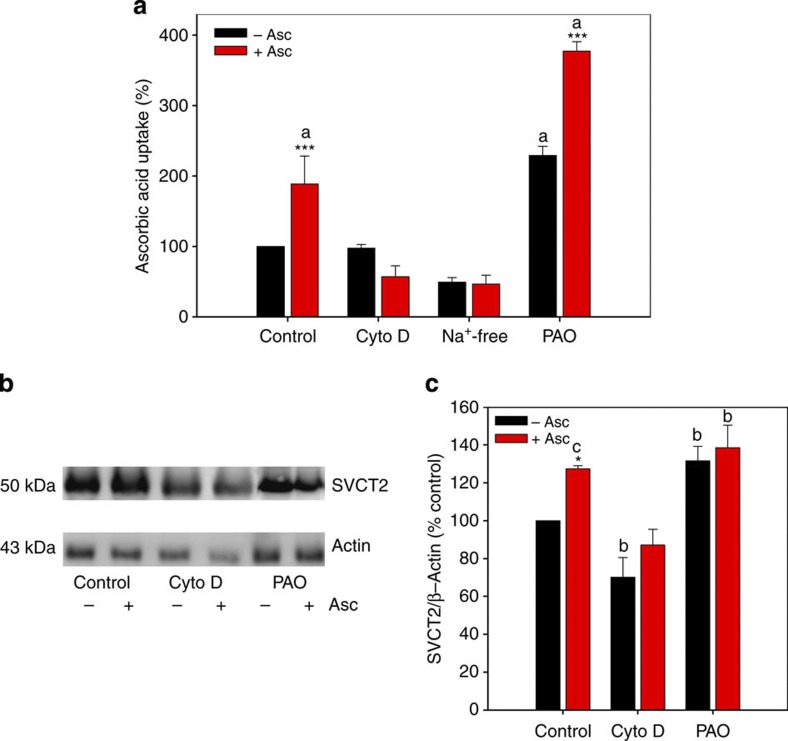
The idea that transporters revolve in a cycle to and from the plasma membrane is not new. Constitutive endocytosis and recycling of the glutamate transporter EAAC1 occurs to and from the plasma membrane28. It is thus possible that SVCT2 may be cycling to and from the plasma membrane so that when extracellular ascorbic acid concentration increases, SVCT2 becomes ‘trapped’ at the cell surface. If our idea is true, we reason that if we are able to manipulate the rates of endocytosis and exocytosis, then we might be able to manipulate the amount of SVCT2 at the plasma membrane. In other words, if we decrease the rate of endocytosis or increase the rate of exocytosis we should see an increase in the amount of SVCT2 at the plasma membrane. To try and confirm this, we used TIRF microscopy in conjunction with biotinylation and kinetic assays using cytochalasin D (Cyto D) and phenylarsine oxide (PAO). Cyto D inhibits actin polymerization and in this way is known to inhibit clathrin-independent endocytosis29 and exocytosis30. PAO is known to inhibit clathrin-dependent endocytosis by reacting with vicinal sulfhydryls to form stable ring structures31. TIRF microscopy (TIRFM) experiments in the presence of Cyto D (1 μg ml−1) and ascorbic acid (1 mM) gave no indication of an increased amount of SVCT2-EGFP at the plasma membrane (Fig. 7). A similar negative result was observed for endogenous SVCT2 using immunofluorescence assays and biotinylation assays (Fig. 8b,c). Treatment with Cyto D alone revealed a decreased amount of SVCT2 at the cell surface (Fig. 8b,c). This decrease in SVCT2 was accompanied by a decrease in ascorbic acid uptake (Fig. 8a). Preincubation with extracellular ascorbic acid did not reverse the effects of Cyto D (Fig. 8a). Cells treated with PAO (50 μM) showed an increased amount of SVCT2 at the plasma membrane (Fig. 8b,c, Supplementary Figs S5 and S6) and increased ascorbic acid uptake (Fig. 8a). Treatment with extracellular ascorbic acid and PAO showed an increase in ascorbic acid uptake without significant changes in the amount of SVCT2 at the plasma membrane. As SVCT2 is a sodium-dependent transporter (co-transport of ascorbate and Na+), we were curious to see whether the ascorbic acid effect was dependent on the presence of the ascorbate anion or the sodium cation. To do this, we performed experiments in Na+-free buffers, replacing Na+ with choline, an inert cation. TIRFM assays were suggestive of a slight decrease in SVCT2 at the plasma membrane in the presence of ascorbic acid in Na+-free buffer (Fig. 7, Na+-free). This observation was supported by uptake analyses that showed a decrease in 14C-ascorbic acid uptake in control cells and in cells pretreated with extracellular non-radioactive ascorbic acid (Fig. 8a, Na+-free). Therefore, our results suggest that SVCT2 is constitutively cycling between the plasma membrane and endocytic compartments (early endosomes) and that extracellular ascorbic acid ‘traps’ SVCT2 at the plasma membrane (by a decrease in the rate of clathrin-dependent endocytosis). Ascorbic acid may also induce translocation of SVCT2 to the plasma membrane (by an increase in the rate of exocytosis) as observed in 14C-ascorbic acid uptake experiments in the presence of PAO and extracellular non-radioactive ascorbic acid (Fig. 8a, PAO).
Figure 7. Endo and exocytosis inhibition induce a decrease of SVCT2 in the plasma membrane.
(a) TIRF microscopy images for NG108 cells expressing SVCT2-EGFP. Images show a representative cell incubated with 1 mM ascorbic acid. Where indicated, cells were additionally treated with 1 μg ml−1 cytochalasin D (Cyto D) or with Na+-free buffer. (b) Bar plots for normalized fluorescence intensity in NG108 cells using TIRF microscopy. Cells were pretreated with 0 or 1 mM ascorbic acid for 10 min at 37 °C in the presence of cytochalasin D or in the absence of Na+. Student’s t-test, n=5 (8 cells for every condition), ***P<0.001.
Figure 8. Cycling of SVCT2 to and from the plasma membrane.
(a) Bar plots for 14C-ascorbic acid transport analysis using a 1-min uptake assay (37 °C) in HEK293T cells. Cells were pretreated with 1mM non-radioactive ascorbic acid for 10 min prior to performing the uptake assay. Where indicated, cells were pretreated with cytochalasin D (1 μg ml−1, CytoD), phenylarsine oxide (50 μM, PAO) for 15 min at 37 °C. Na+-free: ascorbic acid preincubation was performed in a Na+-free solution. (b) Western blot analyses of biotinylated proteins from HEK293T cells. Cells were preincubated with 1 mM ascorbic acid for 10 min prior to the biotinylation assay. Where indicated, cells were pretreated with cytochalasin D (1 μg ml−1, Cyto D), phenylarsine oxide (50 μM, PAO) for 15 min at 37 °C. Na+-free: ascorbic acid preincubation was performed in a Na+-free solution. Full unedited blot including molecular weight markers is shown in Supplementary Figs S5 and S6. (c) Bar plots for densitometric scanning analysis of the SVCT2 western blot. Analysis of variance (ANOVA) followed by the Bonferroni post-test, n=4. Comparison between pretreatment with 0 and 1 mM ascorbic acid for each experimental condition, ***P<0.001, *P<0.05. Comparison between experimental conditions versus control cells pretreated with 0 mM ascorbic acid. aP<0.001, bP<0.01, cP<0.05.
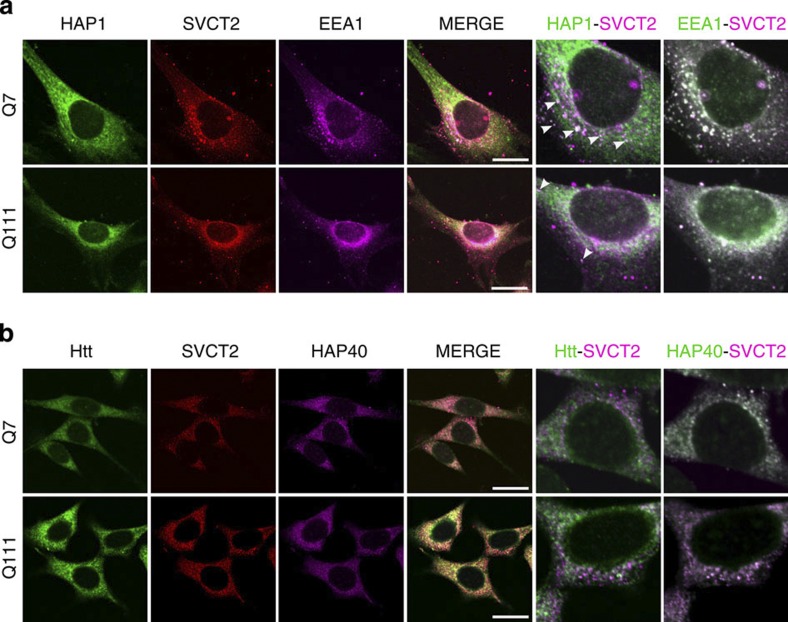
SVCT2 translocation to the plasma membrane was altered in cells expressing mHtt, as shown by immunofluorescence imaging in Q7 and Q111 cells, with GLUT3-mCherry as a plasma membrane marker (Fig. 5). In the absence of extracellular ascorbic acid, SVCT2 is mainly located at early endosomes (Figs 5 and 9). Htt is an essential integrator of vesicular trafficking, in which several Htt-binding partners (Htt-associated proteins) are involved3. Considering that Htt is determinant in the positioning of endosomes32, we studied SVCT2 colocalization with early endosomes, Htt, HAP1 (Fig. 9a) and Htt-associated protein 40 (HAP40, Fig. 9b). In Q7 cells, SVCT2 colocalizes with HAP1 and early endosomes (using EEA1 as early endosome marker) into subcellular structures that are similar to vesicles or endosomes (Fig. 9a). However, cells expressing mHtt (Q111 cells) show a decrease in SVCT2-HAP1 colocalization with no apparent change in SVCT2-EEA1 colocalization (Fig. 9a). We saw no apparent change in SVCT2-HAP40 and SVCT-Htt (Fig. 9b) colocalization when we compared Q7 with Q111 cells. HAP1 has been linked to microtubule-associated vesicular trafficking3 and to delivery of plasma membrane proteins to the cell surface4. Our results suggest that SVCT2 is being recycled constitutively. The loss of Htt function induces a decrease in vesicular motility and SVCT2-HAP1 mislocalization, thus disrupting SVCT2 translocation to the plasma membrane.
Figure 9. Colocalization of HAP1 and SVCT2 is disrupted in cells expressing mHtt.
(a) Immunofluorescence analyses in Q7 and Q111 cells for HAP1 (green), SVCT2 (red) and EEA1 (magenta). To best appreciate colocalization of HAP1-SVCT2 and EEA1-SVCT2, images to the right are shown in magenta and green. (b) Immunofluorescence analyses in Q7 and Q111 cells for Htt (green), SVCT2 (red) and HAP40 (magenta). To best appreciate colocalization of Htt-SVCT2 and HAP40-SVCT2, images to the right are shown in magenta and green. Arrowheads indicate areas of colocalization. Scale bars are 20 μm.
Discussion
The brain is an expensive organ in energetic terms. Monocarboxylates are essential for sustaining neuronal energy metabolism during synaptic activity33,34. HD is characterized by a failure in brain energy metabolism. Positron emission tomography studies have demonstrated marked reductions in metabolic rates in the basal ganglia8 and in the cerebral cortex of symptomatic HD patients7,35. In the present study, we have shown that an alteration in neuronal substrate energetic preferences occurs in presymptomatic and symptomatic brain slices from R6/2 mice. The observed alteration seems to be related to a deficiency in ascorbic acid flux between astrocytes and neurons and to a deficiency in the ascorbic acid metabolic switch13. According to the ascorbic acid metabolic switch, astrocytes release ascorbic acid in response to glutamatergic activity. Ascorbic acid is taken up by neurons via the SVCT2. Neuronal intracellular ascorbic acid modulates energetic substrate preferences, favouring lactate consumption as well as contributing to the antioxidant capacity of these cells. The failure we observe in R6/2 slices may be associated with a failure to obtain neuronal energetic substrate and thus to an inability to adequately sustain synaptic activity, which may produce a decrease in striatum output that alters the function and integration capacity in the circuitry of basal ganglia. The observed failure was reversed by the addition of exogenous ascorbic acid in brain slices from presymptomatic mice. These findings are consistent with observations made by Rebec et al.10,22. HD models, R6/2 and knock-in mice, show a pronounced and sustained loss of extracellular fluid that appears only during periods of behavioural activation. Both models show an inability to maintain adequate levels of ascorbic acid during behavioural activation. Treatment with ascorbic acid has been shown to significantly attenuate the neurological motor signs of HD in R6/2 mice24. The upregulation of SVCT2 expression we observed in symptomatic mice may be an adaptive mechanism to compensate for decreased extracellular ascorbic acid levels during brain activation.
STHdhQ cells are a good model for the studying the cellular and molecular mechanisms of HD. With respect to ascorbic acid transporters, Q111 cells show an increase in SVCT2 expression, as do symptomatic R6/2 mice. Neuronal SVCT2 has an apparent Km of 103 μM (ref. 20) comparable to that observed here for ascorbic acid transport in Q7 cells. The observed great affinity for ascorbic acid transport in Q111 cells may be an adaptive response mechanism when transporter trafficking is impaired. Extracellular ascorbic acid concentration under resting conditions has been shown to be in the order of 200–300 μM. Thus, considering the Km for SVCT2 ascorbic acid, transporters should be saturated and insensitive to changes in extracellular substrate concentrations. SVCT2 translocation to the plasma membrane in response to an increase in extracellular ascorbic acid concentration explains how ascorbic acid flux from astrocytes to neurons is successful during brain activation. According to our data, under resting conditions, SVCT2 should be located mainly in intracellular compartments that colocalize with early endosome markers. So, SVCT2 should be continually cycling between the plasma membrane and intracellular compartments. The idea of a transporter cycling to and from the plasma membrane and with trafficking modulated by its substrate is not a new idea. Such a mechanism has been described for the glutamate transporter, EAAC1 (ref. 28), the dopamine transporter, DAT (ref. 36), the GABA transporter, GAT137 and the siderophore iron transporter, Sit1 (ref. 38).
If SVCT2 is cycling constantly, translocation of SVCT2 to the plasma membrane may arise as a result of changes in the rate of transporter exocytosis and endocytosis. We proposed that extracellular ascorbic acid ‘traps’ SVCT2 at the plasma membrane, such that an increase of SVCT2 at the cell surface may result from a decreased rate of endocytosis or an increased rate of exocytosis. Our experiments with PAO strongly support this hypothesis. We found no significant change on comparing experiments with PAO and with PAO plus ascorbic acid, implying that SVCT2 is constitutively internalized in a clathrin- and dynamin-dependent manner. A similar internalization method has been described for the glutamate transporter, EAAC1 (ref. 28). However, we should not overlook the fact that extracellular ascorbic acid induces an intrinsic activation of the transporter (for example, altering kcat by inducing conformational changes). In Q7 cells, we observed a 200% increase in 14C-ascorbic acid uptake after preincubation with non-radioactive ascorbic acid, while Q111 cells showed a 150% increase. These data are not consistent however with the results obtained from TIRF microscopy. This discrepancy may be attributed to the fact that radioactive assays are more sensitive than imaging methods. Nevertheless, we must not discount the possibility that intrinsic activation may be occurring.
Expression of mHtt induces a decrease in SVCT2-HAP1 colocalization. HAP1 facilitates molecular interactions with microtubule motor proteins such as kinesin39,40. HAP1 interacts with the p150glued subunit of dynactin, associated with dynein molecular motor proteins that confer movement of vesicles through microtubules41. Alterations in trafficking of proteins to neuronal membranes are common in HD and other neurological and psychiatric disorders4,42. Indeed, GABAA receptor delivery to synapses is Htt- and HAP-1-dependent and occurs with the participation of the HAP-1-KIF5 complex4. Furthermore, regarding the association between Htt and actin filaments, HAP40, an effector of Rab5, has been reported to form a complex with huntingtin, thus favouring an association between endosomes and actin filaments43. We saw no apparent change in SVCT2-HAP40 colocalization in Q7 compared with Q111 cells. In fact, only slight colocalization was seen in all cases. However, the possibility that a SVCT2–HAP40 interaction may exist should not be discounted.
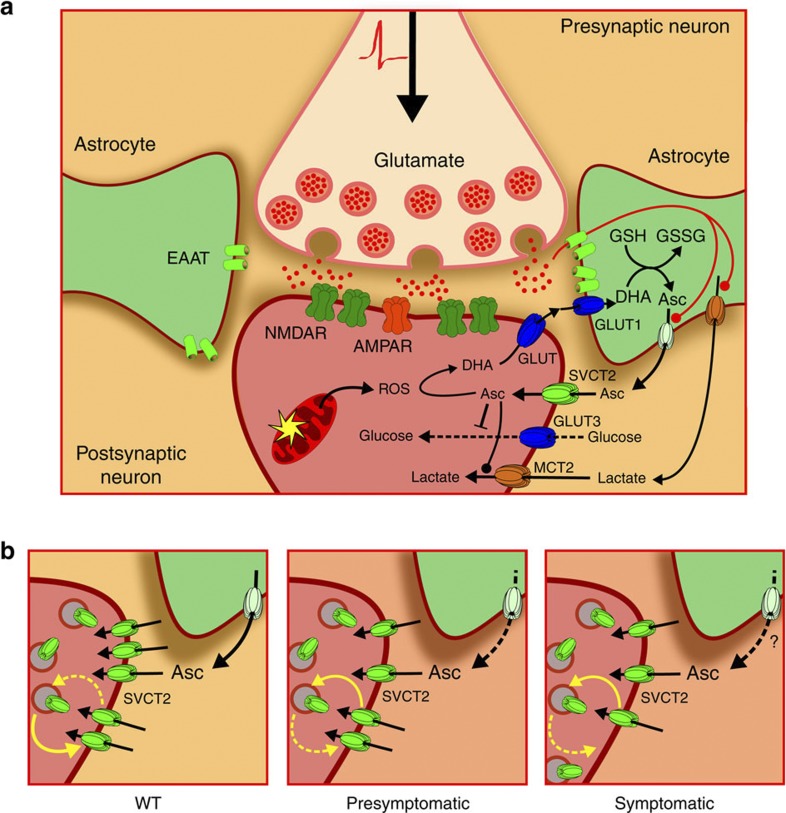
We conclude that neuronal ascorbic acid uptake is impaired in a mouse model of HD. When the glutamatergic corticostriatal pathway is activated, astrocytes remove glutamate from the synaptic cleft (Fig. 10a). Glutamate uptake in astrocytes stimulates lactate and ascorbic acid release from these cells. The increase in extracellular ascorbic acid induces SVCT2 translocation to the plasma membrane by inhibiting endocytosis. Thus, neuronal cells can efficiently uptake ascorbic acid through SVCT2. Neuronal intracellular ascorbic acid stimulates lactate uptake favouring optimal energy production and maintaining redox balance. Synaptic activity produces oxidant species that oxidize ascorbic acid to dehydroascorbic acid (DHA). DHA is released from neurons and taken up by astrocytes. Astrocytes reduce DHA to ascorbic acid through glutathione-dependent reductases. In the presymptomatic stages of HD-like disease in mice, astrocytes do not release ascorbic acid efficiently (Fig. 10b). In fact, over-supplementation with exogenous ascorbic acid is enough to produce an adequate ascorbic acid uptake. During the symptomatic stages of HD-like disease in mice, exogenous ascorbic acid is not able to induce SVCT2 translocation to the plasma membrane as this process is Htt-dependent (Fig. 10b). Our results thus demonstrate that ascorbic acid homeostasis is altered before the onset of overt HD-like behavioural symptoms in an HD mouse model.
Figure 10. Ascorbic acid flux between astrocytes and neurons is impaired in mouse model of HD.
(a) During corticostriatal pathway activation glutamate is released into the synaptic cleft. Astrocytes take up glutamate, which stimulates lactate efflux and ascorbic acid release from these cells. Ascorbic acid enters neurons through SVCT2. Intracellular ascorbic acid inhibits glucose consumption via specific GLUT3 inhibition and stimulates lactate uptake in neurons. Synaptic activity produces reactive oxidant species (ROS) that oxidize ascorbic acid to dehydroascorbic acid (DHA). DHA is released from neurons and is taken up by astrocytes through glucose transporters. Astrocytes can reduce oxidized ascorbic acid because they express specific glutathione-dependent reductases. (b) SVCT2 constantly cycles to and from the plasma membrane. When astrocytes release ascorbic acid, the increase in extracellular ascorbic acid concentration induces a decrease in the rate of SVCT2 endocytosis, which in turn increases SVCT2 at the cell surface. In presymptomatic stages of HD-like disease in mice, a failure in ascorbic acid release from glial cells can be observed. In contrast, in symptomatic stages of HD-like disease in mice, a failure in SVCT2 translocation to the plasma membrane is observed. AMPAR, (2-amino-3-(3-hydroxy-5-methyl-isoxazol-4-yl)propanoic acid receptor; Asc, ascorbic acid; DHA, dehydroascorbic acid, oxidized ascorbic acid; EAAT, excitatory amino acid transporter; GLUT3, glucose transporter isoform 3; GSH, reduced gluthatione; GSSG, oxidized gluthatione; NMDAR, N-methyl-D-aspartate receptor; MCT, monocarboxylate transporter; ROS, reactive oxygen species; SVCT2, sodium-vitamin C transporter isoform 2.
Methods
Animals
All Wistar rats (females, 6–12 weeks old) were obtained from the Biosecurity Laboratory Facility for Animal Experimentation, Veterinary Science Faculty, Universidad Austral de Chile, Valdivia, Chile). All experiments were conducted in accordance with the Chilean Government’s Manual of Bioethics and Biosafety (CONICYT: The Chilean Commission of Scientific and Technological Research, Santiago, Chile) and according to the guidelines established by the Animal Protection Committee of the Universidad Austral de Chile. All R6/2 mice (male and female, 3–4 and 6–8 weeks old) used were obtained from the breeding colony maintained at the University of California, Los Angeles (UCLA). Offspring were obtained from mouse pairings consisting of either male R6/2 hemizygote × female WT (strain B6CBAF1) or male WT × female WT with an ovarian transplant from a R6/2 hemizygote (obtained from the Jackson Laboratory, Bar Harbor, ME). All experimental procedures were carried out in accordance with the National Institutes of Health Guide for the Care and Use of Laboratory Animals and were approved by the Institutional Animal Care and Use Committee at UCLA. Animals were maintained in a 12:12 light:dark cycle environment and supplied with commercial food pellets and water ad libitum. Studies were performed on two age groups of R6/2 mice and with age-matched WT control mice based on development of the overt motor phenotype. The first group of animals was tested before the appearance of overt behavioural symptoms at 3–4 weeks23. The second group was tested after the appearance of the full behavioural phenotype at 8–12 weeks23. Efforts were made to minimize the number of animals used for experimental purposes.
Slice preparation
Mice were anaesthetized with isoflurane (1-chloro-2,2,2-trifluoroethyl difluoromethyl ether) for decapitation. Brains were removed into ice-cold low-Ca2 oxygenated artificial cerebrospinal fluid (ACSF: 130 mM NaCl, 5 mM MgCl2, 1 mM CaCl2, 3 mM KC, 1.25 mM NaH2PO4, 26 mM NaHCO3 and 10 mM glucose) and coronal slices (350 μm) were prepared using a microslicer. Slices containing striatum and overlying cortex were maintained at room temperature in an incubation chamber filled with ACSF that was bubbled continuously with 95% O2—5% CO2 for 1 h before being transferred to a laminar flow, thin-layer submersion recording chamber44,45.
Electrophysiological assays
Recordings were made from medium-sized spiny neurons from the striatum using the whole-cell patch-clamp configuration in voltage-clamp. Medium-sized spiny neuronss were visualized in the dorsolateral striatum using infrared illumination with differential interference contrast optics (IR-DIC microscopy) and identified by their somatic size and basic membrane properties. A −70 mV holding potential was maintained during the experiment. Electrophysiological data were acquired at 10 KHz. Recording electrodes consisting of borosilicate glass had an impedance of 5–7 MΩ. The pipette internal solution was: 131 mmol l−1 potassium gluconate, 1 mmol l−1 EGTA, 1 mmol l−1 MgCl2, 2 mmol l−1 ATP-K2, 0.3 mmol l−1 NMDAGTP-Na, 6 mmol l−1 KCl, 1 mmol l−1 NaCl and 5 mmol/l HEPES (pH 7.3) osmolarity 290 mOsm l−1. Postsynaptic currents were evoked by a tungsten electrode placed into the corpus callosum to stimulate the corticostriatal pathway. Stimulation pulses were 0.1–0.2 ms in duration of varying amplitude and were applied every 200 ms. pCLAMP 8 software (Axon Instruments) was used to generate stimuli and for data display, acquisition and storage19,46. Drugs were superfused with gassed ACSF (extracellular substances) or were included within the patch pipette (intracellular substances).
Uptake assays
Uptake assays were performed in 400 μl of incubation buffer (IB contains 15 mM hepes (pH 7.4), 135 mM NaCl, 5 mM KCl, 1.8 mM CaCl2, 0.8 mM MgCl2) containing 0.1±0.4 μCi of 1±14C-L-ascorbic acid (8.2 mCi mmol−1, Dupont NEN). Uptake was halted by washing cells with ice-cold IB containing 0.2 mM HgCl2. Cells were dissolved in 200 μl of lysis buffer (10 mM Tris–HCl (pH 8.0), 0.2% SDS) and the incorporated radioactivity was measured by liquid scintillation spectrometry47.
Live cell imaging analysis
For imaging studies, cells were grown on coverslips coated with poly-L-lysine (Sigma). The cells were transfected using Lipofectamine 2000 (Invitrogen). Lipofectamine–DNA complexes were made by incubating DNA plasmids and cationic lipids in Opti-MEM Reduced-Serum Medium (Invitrogen) at room temperature.
TIRF microscopy analysis: cells expressing SVCT2-EGFP were visualized using an objective-based TIRF microscope. A 473-nm solid-state diode laser was focused onto a single-mode optical fibre and transmitted via the rear illumination port of an Olympus IX70 inverted microscope. Laser light was reflected from a double dichroic mirror (Z488/532rpc; Chroma Technology), passed through a high-numerical aperture objective ( × 60, NA 1.45 (oil immersion) Olympus) and was totally internally reflected by the glass–water interface. Under these experimental conditions, fluorescent objects were within 150 nm of the glass–water interface48.
Fluorescence recovery after photobleaching: cells expressing SVCT2-EGFP were visualized with an Olympus Fluoview 1,000 confocal microscope. Spot areas of 0.18±0.06 μm2 were bleached using argon-ion gas lasers, at wavelengths of 488 and 515 nm at 100%. The experimental data was corrected for any bleaching that may occur during recording, normalized to a pre-bleach fluorescence intensity Fi=1, and fitted to the equation:
 |
In this equation, F0 is the fluorescence intensity immediately after photobleaching and F∞ is the intensity at the asymptote of the fluorescence recovery after bleaching. The theoretical fit is adjusted to the characteristic recovery time, the post-bleach fluorescence intensity immediately after photobleaching, F0, and the fluorescence intensity at time infinity, F∞, after photobleaching49. Mf is defined as the fraction of molecules that recover during the time-course of the experiment. Mf was calculated from data obtained from the normalized recovery curves:
 |
Biotinylation of surface proteins
Biotinylation assays were performed as described by Zambrano et al.50 Briefly, cells (1 × 10⁸) were photolabelled with Sulfo-NHS-SS-Biotin (Thermo Fisher Scientific, Rockford, IL, USA). Cells were washed three times in ice-cold PBS (pH 8.0) to remove any contaminating proteins and were resuspended at a concentration of 20 × 106 cells per ml in PBS (pH 8.0), with the addition of 80 μl of 10 mM Sulfo-NHS-SS-Biotin per ml of reaction volume. Cells were incubated at room temperature for 30 min and again washed three times with ice-cold PBS (pH 8.0). The labelled cells were homogenized in 200 μl of buffer A (0.3 mmol l−1 sucrose, 3 mmol l−1 dithiothreitol (DTT), 1 mmol l−1 EDTA, 100 μg ml−1 phenylmethylsulfonyl fluoride (PMSF) with Triton X-100 and then precipitated by continuous mixing with 40 μl of Immobilized NeutrAvidin Protein (Thermo Fisher Scientific, Rockford, IL, USA) for 2 hours at room temperature. The precipitates were washed four times in 0.3% (w/v) Triton X-100 and twice in PBS. The resin-bound complex was boiled in SDS–PAGE sample buffer. Samples were resolved in 10% (w/v) SDS–polyacrylamide gels and western blot analysis was performed.
Quantitative reverse transcription real-time PCR
The total RNA of the samples was extracted with the EZNA Total RNA Kit II (Omega Bio-Tek, Norcross, GA, USA) according to the manufacturer’s protocol. RNA quantification and purity were analysed with a spectrophotometer. cDNA was synthesized using the Maxima Universal First Strand cDNA Synthesis Kit (Thermo Fisher Scientific, Rockford, IL, USA) and PCR was performed using the Maxima SYBR Green qPCR Master Mix (Thermo Fisher Scientific). The following primers were used to analyse SVCT2 expression, sense: 5′-ATGATGGGTATCGGCAAGAACA-3′ and antisense: 5′-GCTCCGTGTCCTCGTTGTC-3′ (expected product size: 166 bp).
Western blot analysis
Total protein extracts were obtained from R6/2 mice striatum or cell cultures. Biotinylated proteins were obtained from cell cultures (see below). Dissected striata were homogenized in buffer A, 2 μg ml−1 pepstatin A, 2 μg ml−1 leupeptin and 2 μg ml−1 aprotinin) and sonicated three to five times for 10 s at 4 °C. Proteins were resolved by SDS–PAGE (70 μg per lane for total protein extract) in a 10% (w/v) polyacrylamide gel, transferred to polyvinylidene difluoride membranes (0.45-μm pore; Amersham Pharmacia Biotech., Piscataway, NJ, USA) and probed with anti-SVCT2 (1:1,000, SC-9927, Santa Cruz Biotechnology, Santa Cruz, CA, USA), anti-TfR (1:1,000, 13-6800, Invitrogen, Carlsbad, CA, USA) and anti-b actin antibodies (1:1,000, sc-81178, Santa Cruz Biotechnology, Santa Cruz, CA, USA). The reaction was developed using anti-goat, anti-mouse HRP conjugated antibodies (1:10,000, PA1-86326 and 31430, Thermo Scientific, Rockford, IL, USA) and the enhanced chemiluminescence western blot method50 (Amersham Biosciences, Pittsburgh, PA, USA).
Immunofluorescence analysis
Cells grown on poly-L-lysine-coated coverslips were fixed with HistoChoice Tissue Fixative (Sigma-Aldrich). Mice brains were dissected and fixed immediately by immersion in 4% paraformaldehyde in 0.1 M phosphate buffer (pH 7.4). Samples were dehydrated in graded alcohol solutions, embedded in paraffin and incubated overnight with anti-SVCT2 antibodies (1:100, SC-9927, Santa Cruz Biotechnology), anti-MCT1 (1:100, AB1286, Chemicon International, Inc., Temecula, CA, USA), anti-HAP1 (1:100, MAB5516, Chemicon International, Inc., Temecula, CA, USA), anti-HAP40 (1:100, AB5872, Chemicon International, Inc), anti-Htt (1:100, MAB2166, Chemicon International, Inc.) and/or anti-EEA1 (1:100, sc-33585, Santa Cruz Biotechnology). Samples were washed and incubated with anti-rabbit, anti-goat, anti-mouse or anti-chicken IgG-Alexa Fluor 488, IgG-Alexa Fluor 568 or IgG-Alexa Fluor 633 (1:300, A-11055, A-21202, A-11039, A11057, A21070, Invitrogen) and propidium iodide (1.7 μg ml−1, Sigma-Aldrich) and then subsequently washed and mounted. An inverted Olympus FluoView 1000 confocal microscope was used to examine the samples47.
Cell cultures
Cell lines: The hybridoma cell line (NG108, ATCC Number: HB-12317™) was grown in DMEM-F12 (United States Biological, Swampscott, MA, USA) containing 10% foetal bovine serum (FBS: Hyclone, Logan, UT, USA) with HAT media supplement (final concentration: 0.1 mM hypoxanthine, 400 nM aminopterin, 0.016 mM thymidine; Invitrogen), 50 U ml−1 penicillin, 50 mg ml−1 streptomycin, 50 ng ml−1 amphotericin B and 2 mM L-glutamine (Nalgene, Rochester, NY, USA). The human embryonic kidney cell line (HEK293, ATCC number: CRL-1573) and mouse striatal STHdhQ7 and STHdhQ111 cells (Q7 and Q111 cells; Trettel et al.25) were grown using DMEM (United States Biological) containing 10% fetal bovine serum (FBS: Hyclone, Logan, UT, USA), 50 U ml−1 penicillin, 50 mg ml−1 streptomycin, 50 ng ml−1 amphotericin B and 2 mM L-glutamine (Nalgene, Rochester, NY, USA).
Primary cultures: Striatal neurons were obtained from 17-day-old embryos of Wistar rats, as described previously19. Adult female rats were anaesthetized using isoflurane (1-chloro-2,2,2-trifluoroethyl difluoromethyl ether), embryo forebrains were removed and the striatum dissected. Tissue was digested with 0.12% trypsin (w/v, Gibco Co., Rockville, MD, USA) in 0.1 M phosphate buffer (PBS: pH 7.4, osmolarity 320 mOsm) and mechanically disrupted with a fire-polished Pasteur pipette. Cells were plated at 0.3 × 10⁶ cells per cm2 in plates onto coverslips coated with poly-L-lysine (mol. wt>350 kDa, Sigma-Aldrich Corp. St Louis, MO, USA). After 20 min, floating cells were removed and attached cells were cultured for 5–7 days in neurobasal medium (Gibco) supplemented with B27 (Gibco), 50 U ml−1 penicillin, 50 mg ml−1 streptomycin, 50 ng ml−1 amphotericin B and 2 mM L-glutamine (Nalgene).
Plasmids
Plasmid constructs, SVCT2-EGFP, encoding full-length SVCT2 fused at the C termini to EGFP (enhanced green fluorescent protein, Godoy et al., 2007)52 were kindly provided by Dr J.C. Vera (Departamento de Fisiopatología, Universidad de Concepción, Concepción, Chile). Plasmid constructs, mHtt-DsRED, encoding Htt amino acids 1–588 containing 138 glutamine repeats fused to DsRED51 were kindly provided by Dr C. Hetz (Instituto de Ciencias Biomédicas, Universidad de Chile, Santiago, Chile).
Statistical analyses
Statistical comparison between two or more groups of data was respectively performed using Student’s t-test or analysis of variance (ANOVA) followed by the Bonferroni post-test. Linear and non-linear regressions were calculated using SigmaPlot v9.0 software (only correlations >0.9 were accepted).
Author contributions
The work presented here was carried out in collaboration between all authors. A.I.A performed FRAP and TIRFM experiments in HEK293 cells, analysed the data, interpreted the results and helped in the manuscript preparation. M.E. carried out experiments in HEK293 cells (uptake, biotinylation and colocalization assays). C.K. performed FRAP, TIRFM and colocalization assays in Q cells. F.A.B. carried out sample collection from R6/2 mice and performed qPCR and histological experiments using samples from R6/2 mice. A.P. carried out biotinylation and western blot assays using proteins from Q cells and R6/2 mice. C.C. and M.S.L. supervised and helped in data interpretation of electrophysiological experiments. C.C and M.A.C. performed electrophysiological experiments. C.T. and S.B. supervised and helped in data interpretation and design of TIRFM experiments. R.V. and C.H. supervised and helped in all experiments using STHdhQ cells. S.B. and I.I.C. co-designed and discussed analyses. M.A.C. carried out kinetic analyses, designed the project, organized the entire research and wrote the manuscript.
Additional information
How to cite this article: Acuña, A.I. et al. A failure in energy metabolism and antioxidant uptake precede symptoms of Huntington’s disease in mice. Nat. Commun. 4:2917 doi: 10.1038/ncomms3917 (2013).
Supplementary Material
Supplementary Figures S1-S6
Acknowledgments
We gratefully acknowledge the technical assistance of A. Riveros. This work was supported by Chilean FONDECYT grants 1110571 (M.A.C.), 1110906 (S.B.) and 1110508 (I.I.C.), Chilean FONDEF grant D111I1007 (C.H.), Chilean Ring Initiative ACT1109 (C.H.), Millenium Institute P09-015-F (C.H.), CONICYT interantional grant USA2013-0003 (C.H.), CONICYT grant 7912010006 (R.L.V.), international SfA grant (M.A.C.), DID-UACh Research Grant from the Universidad.
References
- Vonsattel J. P. & DiFiglia M. Huntington disease. J. Neuropathol. Exp. Neurol. 57, 369–384 (1998). [DOI] [PubMed] [Google Scholar]
- The Huntington’s Disease Collaborative Research Group. A novel gene containing a trinucleotide repeat that is expanded and unstable on Huntington’s disease chromosomes. Cell 72, 971–983 (1993). [DOI] [PubMed] [Google Scholar]
- Twelvetrees A. E. et al. Delivery of GABAARs to synapses is mediated by HAP1-KIF5 and disrupted by mutant huntingtin. Neuron 65, 53–65 (2010). [DOI] [PMC free article] [PubMed] [Google Scholar]
- Caviston J. P. & Holzbaur E. L. Huntingtin as an essential integrator of intracellular vesicular trafficking. Trends Cell Biol. 19, 147–155 (2009). [DOI] [PMC free article] [PubMed] [Google Scholar]
- Gines S. et al. Specific progressive cAMP reduction implicates energy deficit in presymptomatic Huntington's disease knock-in mice. Hum. Mol. Genet. 12, 497–508 (2003). [DOI] [PubMed] [Google Scholar]
- Kuwert T. et al. Striatal glucose consumption in chorea-free subjects at risk of Huntington's disease. J. Neurol. 241, 31–36 (1993). [DOI] [PubMed] [Google Scholar]
- Leenders K. L., Frackowiak R. S., Quinn N. & Marsden C. D. Brain energy metabolism and dopaminergic function in Huntington's disease measured in vivo using positron emission tomography. Mov. Disord. 1, 69–77 (1986). [DOI] [PubMed] [Google Scholar]
- Mazziotta J. C. et al. Reduced cerebral glucose metabolism in asymptomatic subjects at risk for Huntington's disease. N. Engl. J. Med. 316, 357–362 (1987). [DOI] [PubMed] [Google Scholar]
- Powers W. J. et al. Selective defect of in vivo glycolysis in early Huntington's disease striatum. Proc. Natl Acad. Sci. USA 104, 2945–2949 (2007). [DOI] [PMC free article] [PubMed] [Google Scholar]
- Rebec G. V., Barton S. J., Marseilles A. M. & Collins K. Ascorbate treatment attenuates the Huntington behavioral phenotype in mice. Neuroreport 14, 1263–1265 (2003). [DOI] [PubMed] [Google Scholar]
- Dorner J. L. et al. Corticostriatal dysfunction underlies diminished striatal ascorbate release in the R6/2 mouse model of Huntington's disease. Brain Res. 1290, 111–120 (2009). [DOI] [PMC free article] [PubMed] [Google Scholar]
- May J. M., Qu Z. C. & Mendiratta S. Protection and recycling of alpha-tocopherol in human erythrocytes by intracellular ascorbic acid. Arch. Biochem. Biophys. 349, 281–289 (1998). [DOI] [PubMed] [Google Scholar]
- Castro M. A., Beltran F. A. & Brauchi S. Concha, II. A metabolic switch in brain: glucose and lactate metabolism modulation by ascorbic acid. J. Neurochem. 110, 423–440 (2009). [DOI] [PubMed] [Google Scholar]
- Beltran F. A., Acuña A. I., Miró M. P. & Castro M. Brain Energy Metabolism in Health and Disease. In:Neuroscience—Dealing With Frontiers eds Contreras C. M. InTech (2012). [Google Scholar]
- Boutelle M. G., Svensson L. & Fillenz M. Rapid changes in striatal ascorbate in response to tail-pinch monitored by constant potential voltammetry. Neuroscience 30, 11–17 (1989). [DOI] [PubMed] [Google Scholar]
- Basse-Tomusk A. & Rebec G. V. Regional distribution of ascorbate and 3,4-dihydroxyphenylacetic acid (DOPAC) in rat striatum. Brain Res. 538, 29–35 (1991). [DOI] [PubMed] [Google Scholar]
- Ghasemzadeh B., Cammack J. & Adams R. N. Dynamic changes in extracellular fluid ascorbic acid monitored by in vivo electrochemistry. Brain Res. 547, 162–166 (1991). [PubMed] [Google Scholar]
- Wilson J. X., Peters C. E., Sitar S. M., Daoust P. & Gelb A. W. Glutamate stimulates ascorbate transport by astrocytes. Brain Res. 858, 61–66 (2000). [DOI] [PubMed] [Google Scholar]
- Castro M. A. et al. Intracellular ascorbic acid inhibits transport of glucose by neurons, but not by astrocytes. J. Neurochem. 102, 773–782 (2007). [DOI] [PubMed] [Google Scholar]
- Castro M. et al. High-affinity sodium-vitamin C co-transporters (SVCT) expression in embryonic mouse neurons. J. Neurochem. 78, 815–823 (2001). [DOI] [PubMed] [Google Scholar]
- Castro M. A., Angulo C., Brauchi S., Nualart F. & Concha I. I. Ascorbic acid participates in a general mechanism for concerted glucose transport inhibition and lactate transport stimulation. Pflugers Arch. 457, 519–528 (2008). [DOI] [PubMed] [Google Scholar]
- Rebec G. V., Barton S. J. & Ennis M. D. Dysregulation of ascorbate release in the striatum of behaving mice expressing the Huntington's disease gene. J. Neurosci. 22, RC202 (2002). [DOI] [PMC free article] [PubMed] [Google Scholar]
- Carter R. J. et al. Characterization of progressive motor deficits in mice transgenic for the human Huntington's disease mutation. J. Neurosci. 19, 3248–3257 (1999). [DOI] [PMC free article] [PubMed] [Google Scholar]
- Dorner J. L., Miller B. R., Barton S. J., Brock T. J. & Rebec G. V. Sex differences in behavior and striatal ascorbate release in the 140 CAG knock-in mouse model of Huntington's disease. Behav. Brain Res. 178, 90–97 (2007). [DOI] [PMC free article] [PubMed] [Google Scholar]
- Trettel F. et al. Dominant phenotypes produced by the HD mutation in STHdh(Q111) striatal cells. Hum. Mol. Genet. 9, 2799–2809 (2000). [DOI] [PubMed] [Google Scholar]
- Angulo C. et al. Molecular identification and functional characterization of the vitamin C transporters expressed by Sertoli cells. J. Cell Physiol. 217, 708–716 (2008). [DOI] [PubMed] [Google Scholar]
- Astuya A. et al. Vitamin C uptake and recycling among normal and tumor cells from the central nervous system. J. Neurosci. Res. 79, 146–156 (2005). [DOI] [PubMed] [Google Scholar]
- Gonzalez M. I., Susarla B. T., Fournier K. M., Sheldon A. L. & Robinson M. B. Constitutive endocytosis and recycling of the neuronal glutamate transporter, excitatory amino acid carrier 1. J. Neurochem. 103, 1917–1931 (2007). [DOI] [PubMed] [Google Scholar]
- Torgersen M. L., Skretting G., van Deurs B. & Sandvig K. Internalization of cholera toxin by different endocytic mechanisms. J. Cell Sci. 114, 3737–3747 (2001). [DOI] [PubMed] [Google Scholar]
- Valentijn K. M., Gumkowski F. D. & Jamieson J. D. The subapical actin cytoskeleton regulates secretion and membrane retrieval in pancreatic acinar cells. J. Cell Sci. 112, (Pt 1): 81–96 (1999). [DOI] [PubMed] [Google Scholar]
- Hertel C., Coulter S. J. & Perkins J. P. A comparison of catecholamine-induced internalization of beta-adrenergic receptors and receptor-mediated endocytosis of epidermal growth factor in human astrocytoma cells. Inhibition by phenylarsine oxide. J. Biol. Chem. 260, 12547–12553 (1985). [PubMed] [Google Scholar]
- Caviston J. P., Zajac A. L., Tokito M. & Holzbaur E. L. Huntingtin coordinates the dynein-mediated dynamic positioning of endosomes and lysosomes. Mol. Biol. Cell 22, 478–492 (2011). [DOI] [PMC free article] [PubMed] [Google Scholar]
- Allaman I., Belanger M. & Magistretti P. J. Astrocyte-neuron metabolic relationships: for better and for worse. Trends Neurosci. 34, 76–87 (2011). [DOI] [PubMed] [Google Scholar]
- Belanger M., Allaman I. & Magistretti P. J. Brain energy metabolism: focus on astrocyte-neuron metabolic cooperation. Cell Metab. 14, 724–738 (2011). [DOI] [PubMed] [Google Scholar]
- Kuwert T., Lange H. W., Langen K. J., Herzog H., Aulich A. & Feinendegen L. E. Cortical and subcortical glucose consumption measured by PET in patients with Huntington's disease. Brain 113, (Pt 5): 1405–1423 (1990). [DOI] [PubMed] [Google Scholar]
- Chen R., Furman C. A. & Gnegy M. E. Dopamine transporter trafficking: rapid response on demand. Future Neurol. 5, 123 (2010). [DOI] [PMC free article] [PubMed] [Google Scholar]
- Bernstein E. M. & Quick M. W. Regulation of gamma-aminobutyric acid (GABA) transporters by extracellular GABA. J. Biol. Chem. 274, 889–895 (1999). [DOI] [PubMed] [Google Scholar]
- Erpapazoglou Z., Froissard M., Nondier I., Lesuisse E., Haguenauer-Tsapis R. & Belgareh-Touze N. Substrate- and ubiquitin-dependent trafficking of the yeast siderophore transporter Sit1. Traffic 9, 1372–1391 (2008). [DOI] [PubMed] [Google Scholar]
- Colin E. et al. Huntingtin phosphorylation acts as a molecular switch for anterograde/retrograde transport in neurons. EMBO J. 27, 2124–2134 (2008). [DOI] [PMC free article] [PubMed] [Google Scholar]
- McGuire J. R., Rong J., Li S. H. & Li X. J. Interaction of Huntingtin-associated protein-1 with kinesin light chain: implications in intracellular trafficking in neurons. J. Biol. Chem. 281, 3552–3559 (2006). [DOI] [PubMed] [Google Scholar]
- Caviston J. P., Ross J. L., Antony S. M., Tokito M. & Holzbaur E. L. Huntingtin facilitates dynein/dynactin-mediated vesicle transport. Proc. Natl Acad. Sci. USA 104, 10045–10050 (2007). [DOI] [PMC free article] [PubMed] [Google Scholar]
- Olkkonen V. M. & Ikonen E. When intracellular logistics fails—genetic defects in membrane trafficking. J. Cell Sci. 15, 15 (2006). [DOI] [PubMed] [Google Scholar]
- Pal A., Severin F., Lommer B., Shevchenko A. & Zerial M. Huntingtin-HAP40 complex is a novel Rab5 effector that regulates early endosome motility and is up-regulated in Huntington's disease. J. Cell Biol. 172, 605–618 (2006). [DOI] [PMC free article] [PubMed] [Google Scholar]
- Cepeda C. et al. Transient and progressive electrophysiological alterations in the corticostriatal pathway in a mouse model of Huntington's disease. J. Neurosci. 23, 961–969 (2003). [DOI] [PMC free article] [PubMed] [Google Scholar]
- Andre V. M. et al. Dopamine modulation of excitatory currents in the striatum is dictated by the expression of D1 or D2 receptors and modified by endocannabinoids. Eur. J. Neurosci. 31, 14–28 (2010). [DOI] [PubMed] [Google Scholar]
- Cummings D. M. et al. A critical window of CAG repeat-length correlates with phenotype severity in the R6/2 mouse model of Huntington's disease. J. Neurophysiol. 107, 677–691 (2012). [DOI] [PMC free article] [PubMed] [Google Scholar]
- Beltran F. A., Acuna A. I., Miro M. P., Angulo C., Concha I. I. & Castro M. A. Ascorbic acid-dependent GLUT3 inhibition is a critical step for switching neuronal metabolism. J. Cell Physiol. 226, 3286–3294 (2011). [DOI] [PubMed] [Google Scholar]
- Veliz L. A. et al. Near-membrane dynamics and capture of TRPM8 channels within transient confinement domains. PLoS One 5, e13290 (2010). [DOI] [PMC free article] [PubMed] [Google Scholar]
- Kenworthy A. K. Fluorescence recovery after photobleaching studies of lipid rafts. Methods Mol. Biol. 398, 179–192 (2007). [DOI] [PubMed] [Google Scholar]
- Zambrano A. et al. Cytokine stimulation promotes increased glucose uptake via translocation at the plasma membrane of GLUT1 in HEK293 cells. J. Cell Biochem. 110, 1471–1480 (2010). [DOI] [PubMed] [Google Scholar]
- Vidal R. L. et al. Targeting the UPR transcription factor XBP1 protects against Huntington's disease through the regulation of FoxO1 and autophagy. Hum. Mol. Genet. 21, 2245–2262 (2012). [DOI] [PMC free article] [PubMed] [Google Scholar]
- Godoy A. et al. Mechanistic insights and functional determinants of the transport cycle of the ascorbic acid transporter SVCT2. Activation by sodium and absolute dependence on bivalent cations. J. Biol. Chem. 282, 615–624 (2007). [DOI] [PubMed] [Google Scholar]
Associated Data
This section collects any data citations, data availability statements, or supplementary materials included in this article.
Supplementary Materials
Supplementary Figures S1-S6


