

Abstract
Dendritic cells (DC) are professional antigen-presenting cells that have a role in the initiation of adaptive immune responses and tolerance. Among the tolerogenic mechanisms, the expression of the enzyme indoleamine 2,3-dioxygenase (IDO1) represents an effective tool to generate T regulatory cells (Treg). In humans, different DC subsets express IDO1, but less is known about the IDO1-related enzyme, IDO2. Here, we found a different pattern of expression and regulation between IDO1 and IDO2 in human circulating DC. At the protein level, IDO1 is expressed only in circulating myeloid DC (mDC) and is modulated by PGE2, whereas IDO2 is expressed in both mDC and plasmacytoid DC (pDC) and is not modulated by PGE2. In healthy subjects, IDO1 expression requires the presence of PGE2 and needs continuous transcription and translation, whereas IDO2 expression is constitutive, independent from SOCS3 activity. Conversely, in patients suffering from inflammatory arthritis, circulating DC express both IDO1 and IDO2. At the functional level, both mDC and pDC generate Treg through an IDO1/IDO2-dependent mechanism. We conclude that, in humans, while IDO1 provides an additional mechanism of tolerance induced by proinflammatory mediators, IDO2 is stably expressed in steady-state conditions and may contribute to the homeostatic tolerogenic capacity of DC.
Keywords: Human Dendritic Cells, IDO1, IDO2, Inflammation, Tolerance/Suppression/Anergy
Introduction
Human blood dendritic cells (DC) represent 0.1–1% of total circulating peripheral blood mononuclear cells (PBMC) and can be divided into two major subsets: myeloid DC (mDC), expressing either BDCA1 (CD1c) or BDCA3 (CD141), and plasmacytoid DC (pDC).1 Because of their rarity, studies of human DC functionality were difficult before the availability of protocols for DC differentiation from CD34+ stem/progenitor cells2 and monocytes.3 Both circulating and in vitro differentiated DC share the main functional properties of antigen presenting cells (APC), by priming naïve T cells and inducing immune tolerance.4 The expression of the immunosuppressive enzyme indoleamine 2,3-dioxygenase (IDO1) is one of the DC tolerogenic mechanisms. IDO1 catalyzes tryptophan degradation along the kynurenine pathway,5 resulting in the inhibition of T-cell activation6 and in the expansion of regulatory T cells (Treg).7 The tolerogenic role of IDO1 has been described during maternal tolerance toward the allogeneic fetus,8 regulation of autoimmune disorders,9 suppression of transplant rejection10 and tumor immune escape.11,12
Recently, it has been shown that the first and rate limiting step of tryptophan degradation is catalyzed not only by IDO1, but also by IDO2.13,14 IDO2 is expressed in human pancreatic, colon, gastric, renal cancer and cell lines. In pancreatic cancer cell lines, IDO2 protein expression is inducible after exposure with IFN-γ.15,16 However, it is not clear whether IDO2 is functional in cancer cells. While the functional expression of IDO2 in mouse DC has been described,14 it is not yet established whether different subsets of human DC express IDO2, whether that expression is functional and how IDO2 is regulated. To address these questions, we analyzed the two main subsets of circulating DC from healthy donors for IDO1 and IDO2 expression and compared their induction, degradation and function. Then, we assessed the expression of IDO1 and IDO2 in blood DC of patients suffering from inflammatory arthritis. Taken together, our results suggest that, at variance with inducible IDO1, IDO2 is a functional immunosuppressive enzyme that may contribute to human DC constitutive tolerance in homeostatic conditions.
Materials and Methods
Blood samples
Cells were obtained from healthy donor buffy coats. PBMC were separated by density gradient centrifugation (Ficoll-Hypaque; Amersham Bioscience, Piscataway, NJ). Cells were cultured in RPMI 1640 medium (Lonza, Milan, Italy) supplemented with 10% heat-inactivated fetal bovine serum (FBS) (Gibco-Invitrogen, Carlsbad, CA, USA), 2 mM L-glutamine, 100 U/ml penicillin, and 100 µg/ml streptomycin (MP Biomedicals, Verona, Italy) at 37°C in 5% CO2. CD14+, CD3+ and CD4+CD25+ cells were purified by magnetic separation column (Miltenyi Biotec, Bergisch Gladbach, Germany) according to manufacturer’s instructions.
Patients
Cells were obtained from patients suffering either from rheumatoid arthritis (RA), psoriatic arthritis (Pso AR) or ankylosing spondylitis (Ank Spo). All patients were in active disease and signed an informed consent. PBMC were separated by density gradient centrifugation (Ficoll-Hypaque) and used for the purification of circulating DC.
DC enrichment and DC generation
Circulating DC were enriched from PBMCs using specific immunomagnetic DC isolation kit (Milteny Biotec), following the manufacturer’s instructions. For purifying mDC we used the “CD1c (BDCA-1)+ Dendritic Cell Isolation Kit”; for purifying pDC we used the “Plasmacytoid Dendritic Cell Isolation Kit”; for purifying all circulating DC we used the “Blood Dendritic Cell Isolation Kit II”. Where indicated, mDC and pDC were cultured overnight in complete medium in the absence or presence of IL-1β, TNF-α, and IL-6 with or without PGE2.
Due to the low frequency of circulating DC, monocyte-derived dendritic cells (Mo-DC) or bone-marrow-derived dendritic cells (BMDC) are often used as a model of DC. Indeed, Mo-DC/BMDC were used to achieve high levels of infection17 or of enzymes’ expression in DC.18
Mo-DC were generated by a 5-days culture of CD14+ cells in complete medium supplemented with 50 ng/ml granulocyte-macrophage colony-stimulation factor (GM-CSF) (Endogen, Woburn, MA) and 800 U/ml IL-4 (Endogen), at 37°C in 5% CO2, as previously described.19 For maturation, day 5-Mo-DC were cultured with GM-CSF and IL-4 and incubated for 48 hours in presence of a) complete medium, b) 1 µg/ml CD40L (Biolegend, San Diego, CA), c) 1 µg/ml LPS (Sigma-Aldrich, St. Louise, MO), d) 1 µg/ml LPS with 100 U/ml IFN-γ (Endogen), c) combinations of a cocktail of cytokines made of 10 ng/ml TNFα (Endogen), 10 ng/ml IL-6 (Endogen), 10 ng/ml IL-1β (Endogen), 1 µg/ml PGE2 (Endogen). Where indicated, protein transcription, protein translation and proteasome activity were inhibited by the addition of actinomycin-D (1 µg/ml), cycloheximide (10 µg/ml, both from Sigma-Aldirch) or Velcade (Millennium Pharmaceuticals, Cambridge, MA); 3 µM for immature DC, 20 µM for DC matured without PGE2 and 30 µM for DC matured with PGE2 1 h before DC maturation.20
DC immunophenotype
Dual-color immunofluorescence was performed to characterize Mo-DC, using the following panel of mAbs: PE- or FITC-conjugated anti-human HLA-DR (clone L242, BD Pharmingen); PE- or FITC-conjugated anti-human CD1a (clone HI149, Biolegend); PE- or FITC-conjugated anti-human CD86 (clone IT2.2, Biolegend); FITC-conjugated anti-human CD40 (clone HB14, Biolegend); PE-conjugated anti-human CD80 (clone 2D10, Biolegend); FITC-conjugated anti-human CD83 (clone HB15e, Biolegend); PE-conjugated anti-human CCR7 (clone 150503, BD Pharmingen). Negative controls were isotype-matched irrelevant mAbs (BD Pharmingen, Biolegend). Cells were analyzed by using FACScan equipment (Becton Dickinson). A minimum of 10000 events was collected in list mode on FACScan software.
IDO1 and IDO2 expression
Total RNA was reverse transcribed using Promega Improm II kit and random hexamers in a 20 µl final volume according to manufacturer’s instruction (Promega Corporation, Madison, WI, USA). Quantitative real-time PCR (qRT-PCR) was performed using ABI-PRISM 7900 Sequence Detection System (Applied Biosystems, Foster City, CA). qRT-PCR data were analyzed using the 2−ΔΔCt method. The relative level of a specific mRNA for IDO1 and IDO2 was calculated by subtracting Ct values of the control gene (GAPDH) from the Ct values of the specific gene. Universal human RNA (Stratagene, Agilent Technologies, Santa Clara, CA) was used as reference and taken as value of 1. IDO1 Assay ID Hs00158027_m1; IDO2 Assay ID Hs00401201_m1 or Hs01589373_m1; GAPDH Assay ID Hs00266705_g1.
Western blot analysis
Cell lysates or IP products were separated by SDS gel electrophoresis, transferred onto nitrocellulose membrane (GE Healthcare UK, Buckinghamshire, England) and subjected to Western blotting. Membranes were saturated for 1 h at RT in blocking buffer (1X PBS, 0.1% Tween 20, 5% non-fat milk), then incubated overnight at 4°C with the specific primary antibodies as described.15 The specificity of either the anti-IDO1 and the anti-IDO2 antibody was guaranteed by the method used to develop them. Briefly, IDO1 and IDO2 antiserum were raised with a mixture of recombinant murine and human polypeptides. Antibodies were screened for reactivity against the immunizing antigen by enzyme-linked immunosorbent assay and Western blotting. Samples with the highest titers were purified by affinity chromatography: the glutathione S-transferase (GST)-unbound fraction was passed over a GST-IDO1 (or GST-IDO2) column. Then, the unbound material collected from this column was affinity purified on a GST-IDO2 (or GST-IDO1) column, containing both human and mouse recombinant polypeptide. The resulting affinity-purified polyclonal antibodies were analyzed by Western blotting and confirmed to be IDO2 specific with no cross-reactivity to IDO1 and IDO1 specific with no cross-reactivity to IDO2.21 The specificity of the two antibodies was also confirmed on human cells as shown in Figure S1.
After 3 washes, blots were incubated for 1 h at RT with peroxidase-conjugated secondary antibody (1:10000, Amersham Biosciences, Sweden) and washed as above. Signal intensities in single blots from at least three separate experiments were measured by means of ChemiDoc-It instrument equipped with a dedicated software (Launch VIsionWorksLS, Euroclone). Protein expression was quantified by band densitometric analysis using IMAGEJ 1.44p Launcher software (National Institutes of Health, Bethesda, MD, USA). Statistical analysis of differences among densitometric band intensities was performed on at least 3 separate experiments.
SOCS3 immunoprecipitation
For IP, Protein 4B-Sepharose beads (GE Healthcare UK) were coated with SOCS3 antibody (Santa Cruz Biotechnology, Heidelberg, Germany) and incubated with 500 µg of whole-cell lysate overnight at 4°C. Beads were washed three times and centrifuged at 12000 × g for 10 min.
siRNA transfection of DC
Immature DC were transfected with 250 nM control siRNA (CTR siRNA), 250 nM IDO1-specific siRNA (IDO1 siRNA), or 125 nM IDO2-specific siRNA (IDO2 siRNA) using standard nucleofection.22 Briefly, 2 × 10⁶ DC were transfected for each condition, by using the U02 program. A mixture of 4 gene-specific siRNA were used to silence IDO1 and IDO2 (ON-TARGETplus SMART pool by Dharmacon, Lafayette, CO). For IDO1, the target sequences were: i) UCACCAAAUCCACGAUCAU, ii) UUUCAGUGUUCUUCGCAUA, iii) GUAUGAAGGGUUCUGGGAA, iiii) GAACGGGACACUUUGCUAA; for IDO2: i) CAAACUUCCUCAAUUGAUU, ii) UUGGAAAGCUAUCACAUAU, iii) GAGUAUGGCUUUCUUCUUC, iiii) GCACCCAGUUGAAGUUUAA. Non-Targeting pool siRNAs designed and tested for minimal targeting of human genes was used as negative control (by Dharmacon, Lafayette, CO). After an overnight incubation, DC were matured for 48 h.
Enzyme activity of IDO isoforms
The amount of L-kynurenine in culture supernatants was measured with a spectrophotometric analysis, as previously described.23 Briefly, Mo-DC were washed, resuspended in Hanks buffered saline solution supplemented with 500 µM L-tryptophan (Sigma-Aldrich) and incubated (where indicated) with or without the IDO inhibitors 1-MT-D or –L (1 mM, Sigma-Aldrich). Supernatants were harvested after 4 h and mixed with 30% trichloroacetic acid (2:1), vortexed and centrifugated at 8000 g for 5 min. Subsequently, this solution was added to Ehrlich reagent (1:1, Sigma-Aldrich) in a 96-well plate. Triplicate samples were run against a standard curve of defined kynurenine concentrations (0–100 µM; Sigma-Aldrich). Optical density was measured at 490 nm, using a Multiskan EX microplate reader (Thermo Electron Corporation, Vantaa, Finland).
Induction of Treg by DC
DC were cultured with autologous CD3+ T cells (1:10) for 1 day, with or without the IDO inhibitors 1-MT-D or –L (1 mM, Sigma-Aldrich), where indicated. For immunophenotype studies, tri-color immunofluorescence was performed using fluorescein isotiocyanate (FITC)-conjugated anti-human CD4 (clone RPA-T4), phycoerytrin (PE)-conjugated anti-human Foxp3 (clone 206D) and allophycocyanin (APC)-conjugated anti-human CD25 (clone BC96, Biolegend, San Diego, CA). For cell-surface staining, 1×10⁵ cells/100 µl were incubated in the dark for 20 min at 4°C with mAbs in phosphate-buffered saline (PBS)-1% bovine serum albumine. Subsequently, for Foxp3 intracellular staining, cells were incubated at room temperature in the dark for 20 min with fix/perm buffer followed by 15 min with perm solution and additional 30 min with the mAb. After 2 washes, samples were analyzed using BD FACSCanto™II equipment (BD Biosciences). A minimum of 10,000 events was collected in list mode on FACSDiva software. To test their suppressive activity, purified CD4+CD25+ T cells (104/well) were irradiated and added to cultures consisting of CFSE-labeled CD3+ T cells (105/well) as responders, stimulated by 1 µg/ml PHA (Sigma-Aldrich). After 5 days, cultures were analyzed using BD FACSCanto™II equipment (BD Biosciences) and the proliferation index was calculated using FCSExpress4 software.24
Statistical analysis
Results are expressed as mean ± SEM. Where indicated, differences were compared using Student’s t-test (* = p<0.05; ** = p<0.01).
Results
Myeloid and plasmacytoid DC differentially express IDO enzymes
First, we asked whether IDO enzymes are expressed in human circulating DC and how the inflammatory mediator PGE2 regulates IDO1 and IDO2 mRNA and protein expression. PGE2 is known to confer to DC both immunogenic and tolerogenic features25 and to regulate IDO1 expression.26,27 Thus, we isolated CD1c+ mDC and CD303+ pDC and evaluated IDO1 and IDO2 expression in steady-state condition (i.e. immediately after purification) and after overnight incubation in absence of exogenous stimuli, or in the presence of a cytokine cocktail including IL-1β, IL-6, TNF-α, commonly used to mature DC, with or without PGE2.28
As shown in Figure 1A, at the mRNA level, PGE2 enhanced both IDO1 and IDO2 expression in mDC. On the contrary, in pDC PGE2 had no effect on either IDO1 and IDO2 mRNA expression (Figure 1B). At the protein level, after overnight incubation, only mDC expressed IDO1 protein and this expression was dependent from PGE2 (Figure 1C–F). Conversely, IDO2 protein was expressed in both mDC and pDC, either in steady-state conditions and after incubation with inflammatory stimuli, and its expression was PGE2-independent (Figure 1C–F).
Figure 1. Expression of IDO1 and IDO2 in blood DC.

Human mDC and pDC were isolated from healthy donors’ PBMC by using magnetic beads. DC were tested freshly purified or after an over-night (o.n.) incubation in RPMI 1640 alone or in presence of IL-1β (10 ng/ml), IL-6 (10 ng/ml) and TNF-α (10 ng/ml) with or without (w/o in figure) PGE2 (1 µg/ml). Cells were lysed and RNA and protein were extracted. mRNA expression of IDO1 and IDO2 (normalized to GAPDH) was evaluated by real-time RT-PCR in mDC (A) and pDC (B). Universal human RNA was used as reference and taken as value of 1. Data are expressed as the mean ± SEM of 12 independent experiments.* p<0.05, ** p<0.01 vs. o.n. or versus o.n. w/o PGE2, where indicated. (C–F) IDO1, IDO2 and β-actin (βACT in figure) protein expression in fresh or cultured mDC (C, E) and pDC (D, F) was determined by Western blotting. (C, D) Data shown are representative results from 1 of 4 independent experiments, each performed by bulking protein lysate of either mDC or pDC of the same three donors. (E, F) Protein expression was quantified by band densitometric analysis and expressed as the ratio between IDO1 (or IDO2) on β-actin band intensity. Data are expressed as the mean ± SEM of 4 independent experiments.* p<0.05, ** p<0.01 vs. o.n. or versus o.n. w/o PGE2, where indicated.
We concluded that, in contrast to IDO1, IDO2 protein is expressed by both mDC and pDC and that its expression does not correlate with its mRNA level in a PGE2-independent manner.
The role of PGE2 in regulating IDO1 and IDO2 expression in Mo-DC
To better investigate the mechanism(s) underlying IDO1 and IDO2 expression in human DC during maturation with inflammatory cytokines/mediators, we used monocyte-derived DC (Mo-DC) as a model.17,18 In particular, we analyzed IDO1 and IDO2 expression before and after DC maturation with combinations of three out of four cytokines of the cocktail. As expected, we found that in absence of TNF-α and of PGE2, DC were not induced to full maturation as evaluated phenotypically (Figure 2A). Immature DC were always taken as control samples and expressed HLA-DR: 71.5 ± 5.8%, CD1a: 74.5 ± 4.9%, CD86: 29.5 ± 6.2%, CD40: 56.3 ± 5.1%, CD80: 53.7 ± 5.8%, CD83: 4.5 ± 3.2%, CCR7: 11.2 ± 3.2% (data not shown). At the mRNA level, TNF-α and, more significantly, PGE2, contributed to IDO1 upregulation, and only PGE2 was required for IDO2 upregulation (Figure 2B). As shown in Figure 2C, the effect of PGE2 on IDO1 and IDO2 induction was dose-dependent. Similar to circulating DC (see Figure 1C–F), IDO1 protein level followed its transcriptional level, whereas IDO2 protein expression was independent from any stimuli and did not parallel its transcriptional level (Figure 2D–G). In fact, while the removal of PGE2 inhibited also the upregulation of IDO1 protein (Figure 2D–F), that was PGE2 dose-dependent (Figure 2E–G), the expression level of IDO2 protein remained unchanged also in absence of PGE2 (Figure 2D–G).
Figure 2. Expression of IDO1 and IDO2 in Mo-DC.

Human CD14+ monocytes were purified form healthy donors’ PBMC by using magnetic beads and cultured 5 days with 50 ng/ml GM-CSF and 800U/ml IL-4 to obtain immature Mo-DC. DC phenotype, mRNA expression of IDO1 and IDO2 (normalized to GAPDH) and protein expression of IDO1, IDO2 and β-actin (βACT in figure) were evaluated by flow cytometry, real-time RT-PCR and Western blotting, respectively. (A, B, D and F) Immature Mo-DC were cultured for 48h with the complete cocktail or with combinations of 3 out of 4 cytokines of the cocktail (in figure w/o means without) and evaluated for phenotype (A) and IDO1 and IDO2 expression (B, D and F); (C, E and G) Mo-DC were matured with 10 ng/ml IL-1β, 10 ng/ml IL-6, 10 ng/ml TNF-α in presence of decreasing doses of PGE2 : 1 µg/ml (the normal concentration in the cocktail), 0.02 µg/ml (1:50 of the normal concentration), 0.002 µg/ml (1:500 of the normal concentration), 0.0004 µg/ml (1:2500 of the normal concentration) or 0 µg/ml (without (w/o) PGE2) and evaluated for IDO1 and IDO2 expression. Universal human RNA was used as reference and taken as value of 1. Data are expressed as the mean ± SEM of 12 independent experiments.* p<0.05, ** p<0.01 vs Mo-DC matured with the complete cocktail. (D, E) Western blotting data are representative results from 5 independent experiments and (F, G) protein expression was quantified by band densitometric analysis and expressed as the ratio between IDO1 (or IDO2) on β-actin band intensity. Data are expressed as the mean ± SEM of 5 independent experiments.* p<0.05, ** p<0.01 vs. complete cocktail.
Taken together, these data indicate that PGE2 upregulates both IDO1 and IDO2 transcription but not IDO2 protein expression also in Mo-DC experimental model. Therefore, Mo-DC were found suitable for further investigating IDO1 and IDO2 regulation.
In human DC IDO2 is differentially regulated than IDO1
To further elucidate how IDO2 and IDO1 are regulated in human DC, we added either actinomycin D or cycloheximide as specific inhibitors of protein transcription or translation, respectively, before DC maturation was induced with or without PGE2. As shown in Figure 3A and B, both inhibitors were effective in blocking the expression of IDO1, but not IDO2. These results indicate that the expression of IDO1 protein, but not IDO2, relies upon its continuous synthesis, thereby suggesting that only IDO1 is continuously transcribed, translated and degraded, in contrast to IDO2 which, once synthesized, appears to be stable. We then asked if IDO2 has a different regulation of protein degradation in comparison to IDO1. It is known that IDO1 contains two tyrosines within two canonical immunoreceptor tyrosine-based inhibition motif (ITIM) sequences that direct protein turnover through SOCS3-mediated ubiquitination and proteasomal degradation.29 Thus we asked whether human IDO2 could bind SOCS3 like IDO1. Immature DC and DC matured with or without PGE2 were lysed and SOCS3 was immunoprecipitated with an anti-SOCS3 antibody, followed by sequential immunoblotting with either IDO1 and IDO2 specific antibodies. As shown in Figure 4A, (left panel) and B (white bars), after SOCS3 immunoprecipitation, IDO1 protein was detectable only in PGE2-treated DC, while IDO2 protein was always absent. Since we previously observed that the highest expression of IDO1 occurred in the presence of PGE2 (see Figure 2B–G), the finding that, under this condition, IDO1 bound to SOCS3 was unexpected, since this would drive IDO1 to proteasomal degradation. Therefore, we hypothesized that in absence of inflammatory stimuli, such as PGE2, IDO1 turnover would be so rapid that we could not find IDO1 bound to SOCS3 since it would be already degraded by the proteasome. To confirm this hypothesis, we used bortezomib (Velcade) as specific proteasome inhibitor before DC maturation.20 As shown in Figure 4A (right panel) and B (black bars), after SOCS3 immunoprecipitation, IDO1 was detectable in immature DC or DC matured in the absence of PGE2, but its expression increased after exposure to PGE2. On the contrary, IDO2 protein was not detectable. Since also SOCS3 is subjected to proteasomal degradation, we verified the effective enhancement of IDO1 –and not IDO2-expression, after proteasome inhibition, by quantifying IDO1 (Figure 4C) and IDO2 (Figure 4Ci) protein expression in whole cell lysates, before SOCS3 immunoprecipitation.
Figure 3. IDO1 and IDO2 regulation in Mo-DC.
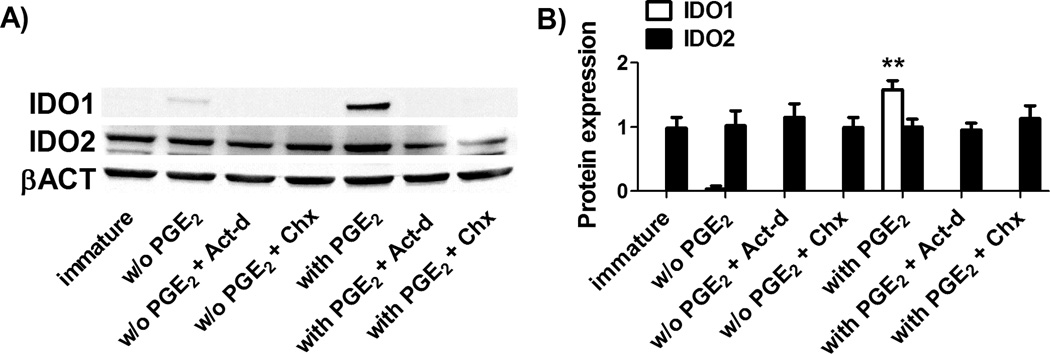
IDO1, IDO2 and β-actin (βACT in figure) protein expression was evaluated by Western blotting (A) and quantified by densitometric analysis (B) in immature Mo-DC and in Mo-DC treated with 1 µg/ml actinomycin d (Act-d in figure), to inhibit gene transcription, or 10 µg/ml cycloheximide (Chx in figure), to inhibit protein translation, 30 min before maturation with the cytockine cocktail either without (w/o in figure) or with PGE2 (1 µg/ml). (B) Protein expression was quantified by band densitometric analysis and expressed as the ratio between IDO1 (or IDO2) on β-actin band intensity. Data are expressed as the mean ± SEM of 4 independent experiments.** p<0.01 vs. immature.
Figure 4. IDO1 and IDO2 degradation in Mo-DC.

(A and B) IDO1, IDO2 and SOCS3 protein expression was evaluated by Western blotting after SOCS3 immunoprecipitation. (A) Immature Mo-DC were treated for 24 h with RPMI 1640 (immature in figure) or with the cytokine cocktail either with or without PGE2, then DC were lysed and SOCS3 was immunoprecipitated with an anti-SOCS3 antibody; (A right) 1 h before that treatment, Velcade (3 µM for immature DC, 20 µM for DC matured without PGE2 and 30 µM for DC matured with PGE2) was added to immature Mo-DC cultures to inhibit proteasomal activity, then DC were treated as above (i.e. cultured 24 h either with RPMI 1640, or the cytokine cocktail either with or without PGE2), lysed and SOCS3 was immunoprecipitated with an anti-SOCS3 antibody. Data shown are representative results from 1 of 3 independent experiments. (B) Protein expression was quantified by band densitometric analysis and expressed as the ratio between IDO1 (or IDO2) on SOCS3 band intensity. Before SOCS3 immunoprecipitation, IDO1 (C) and IDO2 (Ci) protein expression was quantified by band densitometric analysis in whole cell lysates and expressed as the ratio between IDO1 (or IDO2) on β-actin band intensity. Data are expressed as the mean ± SEM of 3 independent experiments.** p<0.01 vs. w/o Velcade.
Taken together, these results indicated that human IDO1, but not IDO2, is degraded by proteasome as a result of the targeting by SOCS3.
Human blood DC generate a population of Tregs by means of IDO enzymes
Given the stable expression of IDO2 under homeostatic conditions, we hypothesized a stable functionality for IDO2 expression in DC tolerance. To test this hypothesis, we co-cultured mDC and pDC with T cells, in the presence or absence of either L- or D- isoform of the IDO-specific inhibitor 1-methyltryptophan (1-MT). Co-culture of T cells with blood DC expressing both IDO isoforms increased the percentage of CD4+CD25+Foxp3+ cells, as compared to baseline (Figure 5A–B). The addition of 1-MT to these co-cultures decreased the population of CD4+CD25+Foxp3+ cells to basal level (Figure 5A–B). The 1-MT-dependent induction of this phenotypic pattern suggested that, CD4+ T cells, by means of IDO enzyme expression in blood DC, acquire a CD4+CD25+Foxp3+ Treg cells phenotype. In order to validate their Treg nature, they were cocultured with T cells stimulated by PHA. As shown in Figure 5C, T-cell proliferation was significantly reduced when either mDC or pDC-obtained CD4+CD25+ T cells were added to cell cultures. These data support the hypothesis that CD4+CD25+Foxp3+ T cells induced by blood DC expressing both IDO isoforms can retain their immunosuppressive activity and be considered bona fide Treg. Since the L-isoform and the D-isoform of the compound 1-MT preferentially block IDO1 and IDO2,14,30,31 respectively, our findings confirm the role of IDO1 in Treg induction by human DC,32 but they also strongly suggest, for the first time, a similar role for IDO2. However, since 1-MT-L inhibited the capacity to generate Treg also in the absence of IDO1, we tested the specificity of its inhibition in absence of IDO1 expression (and the specificity of 1-MT-D in absence of IDO2 expression), such as after its silencing by a specific siRNA. We found that, in absence of one of the two IDO enzymes, the inhibition caused by 1-MT acted indifferently on the only enzyme expressed (Figure S2).
Figure 5. Treg generation by blood DC.

Circulating mDC and pDC were cultured with autologous CD3+ T cells (1:10) for 24 h in the presence or absence of 1-MT-L or 1-MT-D (1 mM). At the end of culture, cells were stained for CD4, CD25 and Foxp3. Foxp3+ T cells were gated as CD4+CD25+. (A) Representative results for Foxp3+ T cells after coculture with myeloid (upper) or plasmacytoid (lower) DC in the presence or absence of 1-MT-L or 1-MT-D. (B) Histograms represent the mean ± SEM of the percentage of T cells coexpressing CD4, CD25 and Foxp3 of 3 independent experiments. * p<0.05 vs. the percentage of CD4+CD25+Foxp3+ cultured without DC (CD3 alone), and vs. RPMI 1640 within the condition mDC or pDC. (C) To test their immunosuppressive activity, CD4+CD25+ T cells obtained at the end of the coculture with mDC or pDC were purified by using magnetic beads and added (1:10) to CD3+ T cells stimulated with PHA (1 µg/ml). Histograms represent the mean ± SEM of 3 independent experiments. * p<0.05 vs. CD3+ T cells alone (CD3).
Also IDO2 is functionally active in DC
To obtain further evidence of IDO2 functionality in Treg induction by human DC, a further set of experiments was performed with Mo-DC. First of all, we assessed if the addition of 1-MT-L or –D had an effect on IDO1 or IDO2 activity. As shown in Figure 6A and 6B, either the enzymatic activity (Figure 6A) and the capacity of generating CD4+CD25+Foxp3+ T cells (Figure 6B), were affected by the addition of 1-MT-L and –D suggesting, also in Mo-DC, an active role for IDO2 in kynurenine formation and Treg generation. Thus, to deeply investigate the activity of IDO2, since Mo-DC, differently from circulating DC, allow the introduction of siRNAs through nucleofetion, we silenced IDO1 and IDO2 by siRNAs for the second set of experiments. Before maturation with PGE2, DC were treated with siRNA specific for IDO1 or IDO2 and then tested for kynurenine production and Treg generation. Our results showed that these targeted siRNAs strongly downregulated IDO1 and IDO2 mRNA and protein, as expected (Figure 6C–E). Accordingly, kynurenine concentration decreased after silencing either enzyme as compared to the control CTR siRNA (Figure 6F), thus demonstrating the active function of both IDO1 and IDO2 in this setting. Moreover, silencing these enzymes reduced number of CD4+CD25highFoxp3+ T cells after culture of DC with CD3+ T cells (Figure 6G–H). However, the obtained CD4+CD25highFoxp3+ T cells, purified and cocultured with T cells stimulated by PHA, retained their capacity to suppress T-cell proliferation (Figure 6I), thus validating their Treg nature and demonstrating for the first time a role not only for IDO1 but also for IDO2 in Treg generation.
Figure 6. IDO1 and IDO2 activity in Mo-DC.

(A–B) DC were matured with the cytokine cocktail and cultured with or without 1-MT-L or –D (1 mM) (A) in presence of 500 µM L-tryptophan for 4 h or (B) with CD3+ T cells (1:10) for 24 h. (A) IDO1 and IDO2 enzymatic activity was evaluated with a spectrophotometric analysis as the production of kynurenine in the supernatants. Data are expressed as the mean ± SEM of 7 independent experiments.* p<0.05, ** p<0.01 vs. RPMI 1640. (B) IDO1 and IDO2 biologic activity was evaluated by quantifying the percentage of T cells coexpressing CD4, CD25 and Foxp3 of 7 independent experiments. * p<0.05, ** p<0.01 vs. RPMI 1640.
To directly inhibit IDO1 or IDO2 expression, immature DC were nucleofected with a CTR-siRNA or with IDO1- or IDO2-specific siRNA and after 24 h matured with the cytokine cocktail for 48 h. (C–E) The expression of IDO1 and IDO2 after siRNA treatment was evaluated by (C) real-time RT-PCR and (D) Western blotting. (E) Histograms represent the mean ± SEM of mRNA expression (n=5) of IDO1 and IDO2 (normalized to GAPDH). Universal human RNA was used as reference and taken as value of 1. ** p<0.01, vs. CTR-siRNA. (D) Western blotting expression of IDO1, IDO2 and β-actin (βACT in figure) is the representative result from 5 independent experiments. (E) Protein expression was quantified by band densitometric analysis and expressed as the ratio between IDO1 (or IDO2) on β-actin band intensity. Data are expressed as the mean ± SEM of 5 independent experiments.** p<0.01 vs. siRNA CTR. (F) DC were cultured in presence of 500 µM L-tryptophan for 4 h and supernatants were collected. IDO1 and IDO2 enzymatic activity was evaluated with a spectrophotometric analysis as the production of kynurenine in the supernatants. Data are expressed as the mean ± SEM of 3 independent experiments.* p<0.05, ** p<0.01 vs. siRNA CTR. (G and H) DC were cultured with CD3+ T cells (1:10) for 24 h. At the end of culture, cells were stained for CD4, CD25 and Foxp3. Foxp3+ T cells were gated as CD4+CD25+. (G) Representative results for Foxp3+ T cells after coculture with DC treated with CTR-siRNA or IDO1- or IDO2-specific siRNA; (H) Histograms represent the mean ± SEM of the percentage of T cells coexpressing CD4, CD25 and Foxp3 of 3 independent experiments. * p<0.05, ** p<0.01 vs. siRNA CTR. (I) To validate their immunosuppressive activity, CD4+CD25+ T cells obtained at the end of the coculture with DC treated with CTR-siRNA (Treg siRNA CTR), IDO1-specific (Treg siRNA IDO1) or IDO2-specific siRNA (Treg siRNA IDO2) were purified by using magnetic beads and added (1:10) to CD3+ T cells stimulated with PHA (1 µg/ml). Histograms represent the mean ± SEM of 3 independent experiments. * p<0.05 vs. CD3+ T cells alone (CD3).
Taken together, our findings show that, in addition to IDO1, also IDO2 is enzymatically and biologically active in DC.
IDO1 and IDO2 are expressed during in vivo inflammation
Since our data indicated that IDO2 is present in homeostatic conditions, while IDO1 expression requires the addition, in vitro, of pro-inflammatory mediators, we hypothesized that IDO2 is a mechanism always active in DC to maintain a basal level of tolerance, while IDO1 is a further mechanism induced by inflammation. To demonstrate our hypothesis we purified blood DC from healthy subjects and from subjects suffering from inflammatory arthritis and evaluated IDO1 and IDO2 expression. As shown in Figure 7A, at mRNA level, the addition of pro-inflammatory mediators to healthy blood DC resulted in the upregulation of either IDO1 and IDO2. Patients suffering from inflammatory arthritis, specifically rheumatoid arthritis (RA), psoriatic arthritis (Pso AR) or ankylosing spondylitis (Ank Spo), expressed higher mRNA level of both IDO1 and IDO2 in comparison to healthy subjects (Figure 7B), strongly suggesting that the in vitro manipulation of DC with pro-inflammatory mediators, actually mimics the in vivo situation during inflammatory diseases. However, despite in vivo inflammation enhanced both IDO1 and IDO2 mRNA with respect to steady-state conditions (Figure 7B), the protein analysis revealed that IDO2 protein expression did not follow its transcriptional level both in vitro and, more importantly, in vivo (Figure 7C–D). Indeed, IDO2 protein is expressed at the same level in healthy subjects and in arthritis patients (Figure 7C–D), who may be considered a patient population with significantly increased inflammatory conditions. Moreover, at the protein level, IDO2 is expressed in healthy subjects and its expression persists at the same level in arthritis patients, while IDO1 is absent in steady state condition (i.e. in healthy subjects), but is expressed during an inflammatory disease (Figure 7C–D).
Figure 7. Expression of IDO1 and IDO2 in blood DC of inflammatory arthritis.
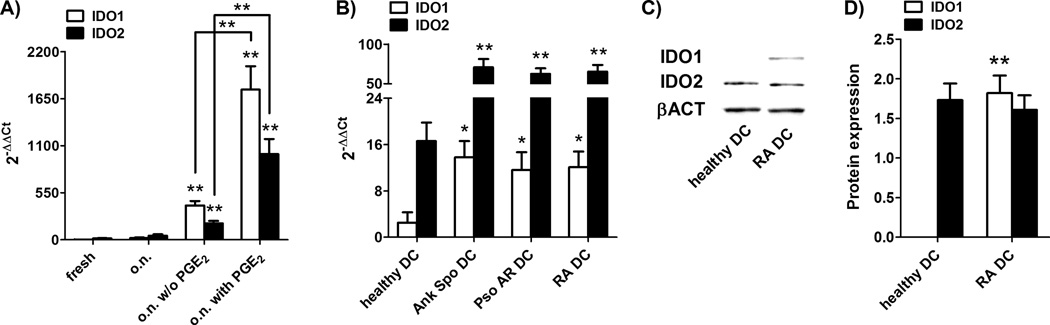
Human total blood DC were isolated from healthy donors’ PBMC and from PBMC of patients suffering from rheumatoid arthritis (RA), psoriatic arthritis (Pso AR) or ankylosing spondylitis (Ank Spo) by using magnetic beads. Healthy DC were tested freshly purified or after an over-night (o.n.) incubation in RPMI 1640 alone or in presence of IL-1β (10 ng/ml), IL-6 (10 ng/ml) and TNF-α (10 ng/ml) with or without (w/o in figure) PGE2 (1 µg/ml); patients’ DC were tested freshly purified. Cells were lysed and RNA and protein were extracted. mRNA expression of IDO1 and IDO2 (normalized to GAPDH) was evaluated by real-time RT-PCR in healthy DC (A) and patients’ DC (B). Universal human RNA was used as reference and taken as value of 1. Data are expressed as the mean ± SEM of 8 independent experiments.* p<0.05, ** p<0.01 vs. o.n., versus o.n. w/o PGE2 where indicated (A) or versus healthy DC (B). (C and D) IDO1, IDO2 and β-actin (βACT in figure) protein expression in freshly purified DC of an healthy subject and of a patient suffering from rheumatoid arthritis was determined by Western blotting. Data shown are representative results from 1 of 4 independent experiments. Rheumatoid arthritis was chosen as representative of the three inflammatory arthritis. (D) Protein expression was quantified by band densitometric analysis and expressed as the ratio between IDO1 (or IDO2) on β-actin band intensity. Data are expressed as the mean ± SEM of 4 independent experiments.** p<0.01 vs. healthy.
Taken together, our data suggest that in humans IDO2 protein may represent a constitutive mechanism of DC tolerance, which is active both under steady-state and inflammatory conditions, while IDO1 is an inducible mechanism of DC tolerance, absent in healthy condition, but elicitable by inflammation.
Discussion
The main finding of the present study is that IDO2 is stably expressed and functionally active in human DC. IDO2 expression confers to DC tolerogenic features, such as the capacity of starving kynurenine and of generating Tregs.
A large body of evidence shows that IDO1-expressing DCs mediate immune tolerance mainly by degrading tryptophan, inhibiting T-cell proliferation and inducing a Treg population.23,33 However, IDO1 expression is not a constitutive feature of human DCs under homeostatic immunologic conditions, but requires induction. Among the multiple mediators of IDO1 induction, PGE2 plays a prominent role.26,27 Indeed, PGE2 has generally been considered a proinflammatory mediator that enhances the migration towards lymph nodes, the capacity to prime naïve T cells and improves DC maturation.34,35 On the contrary, PGE2 is also required to prevent hyper-inflammation, by enhancing the release of IL-10 and the recruitment of Tregs, beside IDO1 expression.25,36 In fact, PGE2 has a dual, either activatory and/or tolerogenic, activity also depending on different DC subsets.37–39
In DC, it is well known that IDO1 expression parallels with specific maturation markers, such as CD83, and costimulatory molecules, such as CD80 and CD86.40,41 Our data confirm these findings on IDO1 expression (see Figure 2A–B). However, we observed a different expression pattern of IDO2 protein, which is independent from the maturation status of DC. Indeed, while pro-inflammatory stimuli, that are strictly required for complete maturation of DC, did enhance both IDO1 and IDO2 transcription, only IDO1, but not IDO2, protein expression was inducible by the presence of such stimuli in the culture medium. Thus, our data in humans support the notion that IDO1 expression may represent a dynamic mechanism of tolerance induced by environmental factors,42 whereas IDO2 may act as a mechanism of intrinsic immune privilege causing a non-immunogenic response to antigenic stimuli.43,44 Indeed, effector signaling experiments conducted with IDO1 and IDO2 support the concept that IDO2 induction is associated with a stable rather than transient effector signals.14 Moreover, a large body of evidence from studies of infectious disease indicates that IDO1 acts as a potent regulatory mechanism. Such a mechanism is known to act by counteracting hyperinflammation, which is likely to produce an unacceptable level of tissue damage and by preventing the complete elimination of pathogens, which would impair immune memory.45,46 These findings support our data about IDO1 and IDO2 expression in patients suffering from inflammatory arthritis versus healthy subjects. In these patients, IDO1 expression is probably due to the inflammatory environment.47 However, despite an in vivo inflammatory milieu modulates IDO1 expression, IDO2 protein expression is independent from those mediators and it is expressed as in healthy subjects (see Figure 7C–D). From this viewpoint, the homeostatic expression rather than the inducible expression of IDO2 may be an important part of immunological tolerance. Indeed, the generation and initial characterization of mice genetically deficient in IDO2 suggest that IDO2 acts downstream or in parallel to IDO1 in Treg control (George C. Prendergast, personal communication).
Moreover, our data show that IDO2 is independent non only from inflammatory stimuli and from DC maturation, but also from continuous transcription and translation, since we show no proteasomal degradation through SOCS3 (see Figure 4). Consistent with these findings, analysis of the IDO2 protein sequence revealed only one putative ITIM (http://prosite.expasy.org),48 which was not expected to act as a docking site for SOCS3. Indeed, IDO2 was not shown to bind to SOCS3, even after proteasome inhibition. This finding was in contrast with the appearance in the human IDO1 protein sequence of at least three consensus degradation sites, allowing for proteasome targeting and subsequent protein degradation in a cell cycle-dependent manner, compared to the human IDO2 protein sequence which did not contain any degradation sequence (http://prosite.expasy.org). Thus, although IDO2 protein may be targeted by other protein degradation systems, the turnover of IDO2 protein appears to be mechanistically distinct from IDO1. In fact, also IDO2 mRNA may be targeted by system(s) of degradation. Indeed, the Targetscan analysis showed that IDO2 has a conserved site in 3’UTR, that may be bound by the small noncoding RNA-(miR-)590-3p. As recently reported, this bound can turn on negative feedback loops49 that might limit IDO2 expression in stimulated DC. Anyway, our results on protein expression and degradation (see Figure 3 and 4) support the concept that IDO1 is a readily tuned system to generate tolerance, since it is transcriptionally induced by inflammatory stimuli and then promptly degraded to avoid dangerous effects, in contrast to IDO2 which is a very stable protein perhaps maintaining steady-state tolerance. By analogy, IDO1 and IDO2 expression may be similar to other modifier systems (e.g. heat shock protein 90α and 90β)50 where one isoform is inducible upon exposure to stress and the other isoform is constitutively active and employed as a housekeeping mechanism.
In conclusion, our results strongly suggest that IDO2 protein expression by human DC is not influenced by inflammatory stimuli and may have, therefore, a tolerogenic role under steady-state conditions. Of note, our data show a lower activity of IDO2 in respect of IDO1, which may be important if, as we suggest, IDO2 is the key enzyme for supporting a tolerance homeostasis. In such a scenario, IDO2 may represent an ancestral conserved mechanism of tolerance, while IDO1 may represent a refined mechanism for dynamic control that was acquired later during evolution. Phylogenetic analysis of IDO genes in lower vertebrates (chicken, frog and fish) lend support to this hypothesis.51 From this perspective, it would not be surprising that an ancestral mechanism of homeostatic tolerance might be important to organismal health, such that the absence or abnormal accumulation of either IDO isoform might affect pathological conditions or viability. While 1-MT can trigger T-cell mediated rejection of allogeneic fetus,8 IDO1 deficient mice undergo successful pregnancy, pointing to alternative redundant mechanisms in the protection of the fetus from maternal immune attack.52 Evidence that 1-MT inhibits both IDO1 and IDO2 may indicate that IDO1 deficiency is insufficient for fetal rejection, if this relies upon the inactivation of both IDO1 and IDO2. In summary, by showing direct evidence that IDO2 is required for Treg generation and is expressed either in healthy and in inflammatory conditions, our work provides the first functional definition of a role for IDO2 in tolerance, possibly in the setting of cancer and pregnancy, where tryptophan catabolism is critical.
Supplementary Material
Footnotes
Funded by: Italian Leukemia Association (BolognAIL) and NIH grants CA109542 and CA159337.
Contributions: S.T. designed and performed the experiments, analyzed the data and wrote the paper; D.O. performed flow cytometry and functional tests; M.C. performed Western Blot assay; V.S. performed nucleofection; M.L. performed DC purification of healthy subjects; C.J. performed DC purification of patients; R.M. developed anti-IDO1 and anti-IDO2 antibodies and reviewed the manuscript; C.E. performed IDO1 real time PCR; L.L. developed anti-IDO1 and anti-IDO2 antibodies; P.R. provided patients’ samples and critically reviewed the manuscript; G.C.P. critically reviewed the manuscript; A.C. and R.M.L. designed the experiments, supervised the study, critically reviewed the manuscript and gave the final approval for submission of the manuscript.
Conflict-of-interest disclosure: All the Authors of this research have no conflict of interest to disclose, except for R. Metz and G.C. Prendergast. R.M. and G.C.P. declare a conflict of interest with regard to employer/consultancy roles with New Link Genetics Corporation, which is engaged in the clinical development of IDO inhibitors.
References
- 1.MacDonald KP, Munster DJ, Clark GJ, Dzionek A, Schmitz J, Hart DN. Characterization of human blood dendritic cell subsets. Blood. 2002;100:4512–1520. doi: 10.1182/blood-2001-11-0097. [DOI] [PubMed] [Google Scholar]
- 2.Caux C, Vanbervliet B, Massacrier C, Dezutter-Dambuyant C, de Saint-Vis B, Jacquet C, Yoneda K, Imamura S, Schmitt D, Banchereau J. CD34+ hematopoietic progenitors from human cord blood differentiate along two independent dendritic cell pathways in response to GM-CSF+TNF alpha. J. Exp. Med. 1996;184:695–706. doi: 10.1084/jem.184.2.695. [DOI] [PMC free article] [PubMed] [Google Scholar]
- 3.Sallusto F, Lanzavecchia A. Efficient presentation of soluble antigen by cultured human dendritic cells is maintained by granulocyte/macrophage colony–stimulating factor plus interleukin 4 and downregulated by tumor necrosis factor alpha. J. Exp. Med. 1994;179:1109–1118. doi: 10.1084/jem.179.4.1109. [DOI] [PMC free article] [PubMed] [Google Scholar]
- 4.Finkelman FD, Lees A, Birnbaum R, Gause WC, Morris SC. Dendritic cells can present antigen in vivo in a tolerogenic or immunogenic fashion. J. Immunol. 1996;157:1406–1414. [PubMed] [Google Scholar]
- 5.Mellor AL, Munn DH. Tryptophan catabolism and T-cell tolerance: immunosuppression by starvation? Immunol. Today. 1999;20:469–473. doi: 10.1016/s0167-5699(99)01520-0. [DOI] [PubMed] [Google Scholar]
- 6.Frumento G, Rotondo R, Tonetti M, Damonte G, Benatti U, Ferrara GB. Tryptophan-derived catabolites are responsible for inhibition of T and natural killer cell proliferation induced by indoleamine 2,3-dioxygenase. J. Exp. Med. 2002;196:459–468. doi: 10.1084/jem.20020121. [DOI] [PMC free article] [PubMed] [Google Scholar]
- 7.Curti A, Pandolfi S, Valzasina B, Aluigi M, Isidori A, Ferri E, Salvestrini V, Bonanno G, Rutella S, Durelli I, Horenstein AL, Fiore F, Massaia M, Colombo MP, Baccarani M, Lemoli RM. Modulation of tryptophan catabolism by human leukemic cells results in the conversion of CD25− into CD25+ T regulatory cells. Blood. 2007;109:2871–2877. doi: 10.1182/blood-2006-07-036863. [DOI] [PubMed] [Google Scholar]
- 8.Munn DH, Zhou M, Attwood JT, Bondarev I, Conway SJ, Marshall B, Brown C, Mellor AL. Prevention of allogeneic fetal rejection by tryptophan catabolism. Science. 1998;281:1191–1193. doi: 10.1126/science.281.5380.1191. [DOI] [PubMed] [Google Scholar]
- 9.Catani L, Sollazzo D, Trabanelli S, Curti A, Evangelisti C, Polverelli N, Palandri F, Baccarani M, Vianelli N, Lemoli RM. Decreased expression of indoleamine 2,3-dioxygenase 1 in dendritic cells contributes to impaired regulatory T cell development in immune thrombocytopenia. Ann. Hematol. 2013;92:67–78. doi: 10.1007/s00277-012-1556-5. [DOI] [PubMed] [Google Scholar]
- 10.Guillonneau C, Hill M, Hubert FX, Chiffoleau E, Hervé C, Li XL, Heslan M, Usal C, Tesson L, Ménoret S, Saoudi A, Le Mauff B, Josien R, Cuturi MC, Anegon I. CD40Ig treatment results in allograft acceptance mediated by CD8CD45RC T cells, IFN-gamma, and indoleamine 2,3-dioxygenase. J Clin Invest. 2007;117:1096–1106. doi: 10.1172/JCI28801. [DOI] [PMC free article] [PubMed] [Google Scholar]
- 11.Prendergast GC. Immune escape as a fundamental trait of cancer: focus on IDO. Oncogene. 2008;27:3889–3900. doi: 10.1038/onc.2008.35. [DOI] [PubMed] [Google Scholar]
- 12.Curti A, Trabanelli S, Salvestrini V, Baccarani M, Lemoli RM. The role of indoleamine 2,3-dioxygenase in the induction of immune tolerance: focus on hematology. Blood. 2009;113:2394–2401. doi: 10.1182/blood-2008-07-144485. [DOI] [PubMed] [Google Scholar]
- 13.Ball HJ, Sanchez-Perez A, Weiser S, Austin CJ, Astelbauer F, Miu J, McQuillan JA, Stocker R, Jermiin LS, Hunt NH. Characterization of an indoleamine 2,3-dioxygenase-like protein found in humans and mice. Gene. 2007;396:203–213. doi: 10.1016/j.gene.2007.04.010. [DOI] [PubMed] [Google Scholar]
- 14.Metz R, Duhadaway JB, Kamasani U, Laury-Kleintop L, Muller AJ, Prendergast GC. Novel tryptophan catabolic enzyme IDO2 is the preferred biochemical target of the antitumor indoleamine 2,3-dioxygenase inhibitory compound D-1-methyl-tryptophan. Cancer Res. 2007;67:7082–7087. doi: 10.1158/0008-5472.CAN-07-1872. [DOI] [PubMed] [Google Scholar]
- 15.Witkiewicz AK, Costantino CL, Richard M, Muller AJ, Prendergast GC, Yeo CJ, Brody JR. Genotyping and expression analysis of IDO2 in human pancreatic cancer: a novel, active target. J. Am. Coll. Surg. 2009;208:781–787. doi: 10.1016/j.jamcollsurg.2008.12.018. [DOI] [PMC free article] [PubMed] [Google Scholar]
- 16.Löb S, Königsrainer A, Zieker D, Brücher BLDM, Rammensee HG, Opelz G, Terness P. IDO1 and IDO2 are expressed in human tumors: levo- but not dextro-1-methyl tryptophan inhibits tryptophan catabolism. Cancer Immunol. Immunother. 2009;58:153–157. doi: 10.1007/s00262-008-0513-6. [DOI] [PMC free article] [PubMed] [Google Scholar]
- 17.Presicce P, Moreno-Fernandez ME, Rusie LK, Fichtenbaum C, Chougnet CA. In vitro HIV infection impairs the capacity of myeloid dendritic cells to induce regulatory T cells. PLoS One. 2012;7:e42802. doi: 10.1371/journal.pone.0042802. [DOI] [PMC free article] [PubMed] [Google Scholar]
- 18.Sepulveda FE, Maschalidi S, Colisson R, Heslop L, Ghirelli C, Sakka E, Lennon-Duménil A-M, Amigorena S, Cabanie L, Manoury B. Critical role for asparagine endopeptidase in endocytic toll-like receptor signaling in dendritic cells. Immunity. 2009;31:737–748. doi: 10.1016/j.immuni.2009.09.013. [DOI] [PubMed] [Google Scholar]
- 19.Motta MR, Castellani S, Rizzi S, Curti A, Gubinelli F, Fogli M, Ferri E, Cellini C, Baccarani M, Lemoli RM. Generation of dendritic cells from CD14+ monocytes positively selected by immunomagnetic adsorption for multiple myeloma patients enrolled in a clinical trial of anti-idiotype vaccination. Br. J. Haematol. 2003;121:240–250. doi: 10.1046/j.1365-2141.2003.04270.x. [DOI] [PubMed] [Google Scholar]
- 20.Arpinati M, Chirumbolo G, Nicolini B, Agostinelli C, Rondelli D. Selective apoptosis of monocytes and monocyte-derived DC induced by bortezomib (Velcade) Bone Marrow Transplant. 2009;43:253–259. doi: 10.1038/bmt.2008.312. [DOI] [PubMed] [Google Scholar]
- 21.Metz R, Duhadaway JB, Rust S, Munn DH, Muller AJ, Mautino M, Prendergast GC. Zinc protoporphyrin IX stimulates tumor immunity by disrupting the immunosuppressive enzyme indoleamine 2,3-dioxygenase. Mol. Cancer Ther. 2010;9:1864–1871. doi: 10.1158/1535-7163.MCT-10-0185. [DOI] [PMC free article] [PubMed] [Google Scholar]
- 22.Aluigi M, Fogli M, Curti A, Isidori A, Gruppioni E, Chiodoni C, Colombo MP, Versura P, D'Errico-Grigioni A, Ferri E, Baccarani M, Lemoli RM. Nucleofection is an efficient nonviral transfection technique for human bone marrow-derived mesenchymal stem cells. Stem cells. 2006;24:454–461. doi: 10.1634/stemcells.2005-0198. [DOI] [PubMed] [Google Scholar]
- 23.Chung DJ, Rossi M, Romano E, Ghith J, Yuan J, Munn DH, Young JW. Indoleamine 2,3-dioxygenase-expressing mature human monocyte-derived dendritic cells expand potent autologous regulatory T cells. Blood. 2009;114:555–563. doi: 10.1182/blood-2008-11-191197. [DOI] [PMC free article] [PubMed] [Google Scholar]
- 24.Trabanelli S, Očadlíková D, Gulinelli S, Curti A, Salvestrini V, de Paula Vieira R, Idzko M, Di Virgilio F, Ferrari D, Lemoli RM. Extracellular ATP exerts opposite effects on activated and regulatory CD4+ T cells via P2Rs activation. J. Immunol. 2012;189:1303–1310. doi: 10.4049/jimmunol.1103800. [DOI] [PubMed] [Google Scholar]
- 25.Harizi H, Norbert G. Inhibition of IL-6, TNF-alpha, and cyclooxygenase-2 protein expression by prostaglandin E2-induced IL-10 in bone marrow-derived dendritic cells. Cell. Immunol. 2004;228:99–109. doi: 10.1016/j.cellimm.2004.04.003. [DOI] [PubMed] [Google Scholar]
- 26.Braun D, Longman RS, Albert ML. A two-step induction of indoleamine 2,3 dioxygenase (IDO) activity during dendritic-cell maturation. Blood. 2005;106:2375–2381. doi: 10.1182/blood-2005-03-0979. [DOI] [PMC free article] [PubMed] [Google Scholar]
- 27.Krause P, Singer E, Darley PI, Klebensberger J, Groettrup M, Legler DF. Prostaglandin E2 is a key factor for monocyte-derived dendritic cell maturation: enhanced T cell stimulatory capacity despite IDO. J. Leukoc. Biol. 2007;82:1106–1114. doi: 10.1189/jlb.0905519. [DOI] [PubMed] [Google Scholar]
- 28.Curti A, Tosi P, Comoli P, Terragna C, Ferri E, Cellini C, Massaia M, D'Addio A, Giudice V, Di Bello C, Cavo M, Conte R, Gugliotta G, Baccarani M, Lemoli RM. Phase I/II clinical trial of sequential subcutaneous and intravenous delivery of dendritic cell vaccination for refractory multiple myeloma using patient-specific tumour idiotype protein or idiotype (VDJ)-derived class I-restricted peptides. Br. J. Haematol. 2007;139:415–424. doi: 10.1111/j.1365-2141.2007.06832.x. [DOI] [PubMed] [Google Scholar]
- 29.Orabona C, Pallotta MT, Volpi C, Fallarino F, Vacca C, Bianchi R, Belladonna ML, Fioretti MC, Grohmann U, Puccetti P P. SOCS3 drives proteasomal degradation of indoleamine 2,3-dioxygenase (IDO) and antagonizes IDO-dependent tolerogenesis. Proc. Natl. Acad. Sci. U S A. 2008;105:20828–20833. doi: 10.1073/pnas.0810278105. [DOI] [PMC free article] [PubMed] [Google Scholar]
- 30.Löb S, Konigsrainer A, Schafer R, Rammensee HG, Opelz G, Terness P. Levo- but not dextro-1-methyl tryptophan abrogates the IDO activity of human dendritic cells. Blood. 2008;111:2152–2154. doi: 10.1182/blood-2007-10-116111. [DOI] [PubMed] [Google Scholar]
- 31.Ball HJ, Yuasa HJ, Austin CJ, Weiser S, Hunt NH. Indoleamine 2,3-dioxygenase-2; a new enzyme in the kynurenine pathway. Int. J. Biochem. Cell. Biol. 2009;41:467–471. doi: 10.1016/j.biocel.2008.01.005. [DOI] [PubMed] [Google Scholar]
- 32.Trabanelli S, Očadlíková D, Evangelisti C, Parisi S, Curti A. Induction of regulatory T cells by dendritic cells through indoleamine 2,3-dioxygenase: a potent mechanism of acquired peripheral tolerance. Curr. Med. Chem. 2011;18:2234–2239. doi: 10.2174/092986711795656054. [DOI] [PubMed] [Google Scholar]
- 33.Grohmann U, Fallarino F, Puccetti P. Tolerance, DCs and tryptophan: much ado about IDO. Trends Immunol. 2003;24:242–248. doi: 10.1016/s1471-4906(03)00072-3. [DOI] [PubMed] [Google Scholar]
- 34.Jonuleit H, Kühn U, Müller G, Steinbrink K, Paragnik L, Schmitt E, Knop J, Enk AH. Pro-inflammatory cytokines and prostaglandins induce maturation of potent immunostimulatory dendritic cells under fetal calf serum-free conditions. Eur. J. Immunol. 1997;27:3135–3142. doi: 10.1002/eji.1830271209. [DOI] [PubMed] [Google Scholar]
- 35.Rieser C, Bock G, Klocker H, Bartsch G, Thurnher M. Prostaglandin E2 and tumor necrosis factor alpha cooperate to activate human dendritic cells: synergistic activation of interleukin 12 production. J Exp Med. 1997;186:1603–1608. doi: 10.1084/jem.186.9.1603. [DOI] [PMC free article] [PubMed] [Google Scholar]
- 36.Muthuswamy R, Urban J, Lee JJ, Reinhart TA, Bartlett D, Kalinski P. Ability of mature dendritic cells to interact with regulatory T cells is imprinted during maturation. Cancer Res. 2008;68:5972–5978. doi: 10.1158/0008-5472.CAN-07-6818. [DOI] [PMC free article] [PubMed] [Google Scholar]
- 37.Kabashima K, Sakata D, Nagamachi M, Miyachi Y, Inaba K, Narumiya S. Prostaglandin E2-EP4 signaling initiates skin immune responses by promoting migration and maturation of Langerhans cells. Nat. Med. 2003;9:744–749. doi: 10.1038/nm872. [DOI] [PubMed] [Google Scholar]
- 38.Son Y, Ito T, Ozaki Y, Tanijiri T, Yokoi T, Nakamura K, Takebayashi M, Amakawa R, Fukuhara S. Prostaglandin E2 is a negative regulator on human plasmacytoid dendritic cells. Immunology. 2006;119:36–42. doi: 10.1111/j.1365-2567.2006.02402.x. [DOI] [PMC free article] [PubMed] [Google Scholar]
- 39.De Keijzer S, Meddens MB, Torensma R, Cambi A. The multiple faces of prostaglandin E2 G-protein coupled receptor signaling during the dendritic cell life cycle. Int. J. Mol. Sci. 2013;14:6542–6555. doi: 10.3390/ijms14046542. [DOI] [PMC free article] [PubMed] [Google Scholar]
- 40.Hill M, Tanguy-Royer S, Royer P, Chauveau C, Asghar K, Tesson L, Lavainne F, Rémy S, Brion R, Hubert FX, Heslan M, Rimbert M, Berthelot L, Moffett JR, Josien R, Grégoire M, Anegon I. IDO expands human CD4+CD25high regulatory T cells by promoting maturation of LPS-treated dendritic cells. Eur J Immunol. 2007;37:3054–3062. doi: 10.1002/eji.200636704. [DOI] [PubMed] [Google Scholar]
- 41.Von Bubnoff D, Scheler M M, Wilms H, Fimmers R, Bieber T. Identification of IDO-positive and IDO-negative human dendritic cells after activation by various proinflammatory stimuli. J Immunol. 2011;186:6701–6709. doi: 10.4049/jimmunol.1003151. [DOI] [PubMed] [Google Scholar]
- 42.Terness P, Chuang JJ, Bauer T, Jiga L, Opelz G. Regulation of human auto- and alloreactive T cells by indoleamine 2,3-dioxygenase (IDO)-producing dendritic cells: too much ado about IDO? Blood. 2005;105:2480–2486. doi: 10.1182/blood-2004-06-2103. [DOI] [PubMed] [Google Scholar]
- 43.Mellor AL, Munn DH. Creating immune privilege: active local suppression that benefits friends, but protects foes. Nat. Rev. Immunol. 2008;8:74–80. doi: 10.1038/nri2233. [DOI] [PubMed] [Google Scholar]
- 44.Niederkorn JY. See no evil, hear no evil, do no evil: the lessons of immune privilege. Nat. Immunol. 2006;7:354–359. doi: 10.1038/ni1328. [DOI] [PubMed] [Google Scholar]
- 45.Romani L. Cell mediated immunity to fungi: a reassessment. Med. Mycol. 2008;46:515–529. doi: 10.1080/13693780801971450. [DOI] [PubMed] [Google Scholar]
- 46.Prendergast GC, Chang MY, Mandik-Nayak L, Metz R, Muller AJ. Indoleamine 2,3-dioxygenase as a modifier of pathogenic inflammation in cancer and other inflammation-associated diseases. Curr Med Chem. 2011;18:2257–2262. doi: 10.2174/092986711795656072. [DOI] [PMC free article] [PubMed] [Google Scholar]
- 47.Van de Loo AAJ, van den Berg WB. Effects of murine recombinant IL-1 on synovial joints in mice: Measurement of patellar cartilage metabolism and joint inflammation. Ann Rheum Dis. 1990;49:238–245. doi: 10.1136/ard.49.4.238. [DOI] [PMC free article] [PubMed] [Google Scholar]
- 48.Orabona C, Pallotta MT, Grohmann U. Different partners, opposite outcomes: a new perspective of the immunobiology of indoleamine 2,3-dioxygenase. Mol. Med. 2012;18:834–842. doi: 10.2119/molmed.2012.00029. [DOI] [PMC free article] [PubMed] [Google Scholar]
- 49.Vinuesa CG, Rigby RJ, Yu D. Logic and extent of miRNA-mediated control of autoimmune gene expression. Int Rev Immunol. 2009;28:112–138. doi: 10.1080/08830180902934909. [DOI] [PubMed] [Google Scholar]
- 50.Peterson LB, J. Blagg BS. To fold or not to fold: modulation and consequences of Hsp90 inhibition. Future Med. Chem. 2009;1:267–283. doi: 10.4155/fmc.09.17. [DOI] [PMC free article] [PubMed] [Google Scholar]
- 51.Yuasa HJ, Ball HJ, Austin CJD, Hunt NH. 1-L-methyltryptophan is a more effective inhibitor of vertebrate IDO2 enzymes than 1-D-methyltryptophan. Comp. Biochem. Physiol. B. Biochem. Mol. Biol. 2010;157:10–15. doi: 10.1016/j.cbpb.2010.04.006. [DOI] [PubMed] [Google Scholar]
- 52.Baban B, Chandler P, McCool D, Marshall B, Munn DH, Mellor AL. Indoleamine 2,3-dioxygenase expression is restricted to fetal trophoblast giant cells during murine gestation and is maternal genome specific. J. Reprod. Immunol. 2004;61:67–77. doi: 10.1016/j.jri.2003.11.003. [DOI] [PubMed] [Google Scholar]
Associated Data
This section collects any data citations, data availability statements, or supplementary materials included in this article.