


Abstract
Engineered metabolic pathways often suffer from flux imbalances that can overburden the cell and accumulate intermediate metabolites, resulting in reduced product titers. One way to alleviate such imbalances is to adjust the expression levels of the constituent enzymes using a combinatorial expression library. Typically, this approach requires high-throughput assays, which are unfortunately unavailable for the vast majority of desirable target compounds. To address this, we applied regression modeling to enable expression optimization using only a small number of measurements. We characterized a set of constitutive promoters in Saccharomyces cerevisiae that spanned a wide range of expression and maintained their relative strengths irrespective of the coding sequence. We used a standardized assembly strategy to construct a combinatorial library and express for the first time in yeast the five-enzyme violacein biosynthetic pathway. We trained a regression model on a random sample comprising 3% of the total library, and then used that model to predict genotypes that would preferentially produce each of the products in this highly branched pathway. This generalizable method should prove useful in engineering new pathways for the sustainable production of small molecules.
INTRODUCTION
Metabolic engineering offers the promise of inexpensive and clean biosynthesis of both high value products, such as pharmaceuticals (1,2), and commodity chemicals, such as transportation fuel replacements (3,4). As noted in a recent review of the field (5), standardized engineering frameworks will be key in enabling faster iteration of the ‘design-build-test’ cycle, leading to more productive strains. Recent advances in DNA assembly (6–12) have dramatically improved our ability to efficiently build multi-gene pathway libraries where we can vary expression levels, enzyme homologs and mutants, and other attributes in a combinatorial fashion. Once assembled, the large size inherent to these combinatorial libraries demands high-throughput analysis to isolate a high-performance strain. However, the majority of target molecules cannot be measured in high-throughput, which places the natural inclination to approach optimization of multiple variables via library screening at odds with the strict requirement to minimize the number of measurements. Here, we describe a strategy that overcomes this limitation by coupling regression modeling with multi-gene combinatorial libraries and show that sparse sampling of those libraries can be sufficient to optimize metabolic pathways.
To achieve efficient bioconversion, it is often crucial to balance the relative activity of each enzyme in a pathway to avoid detrimental effects from accumulated intermediate metabolites (13–15). Additionally, it can be a burden on the cell to support a highly expressed foreign pathway (16,17), and, indeed, in some cases, lowering expression of certain enzymes in a pathway has been shown to increase product titers (2,18), highlighting the importance of determining the right balance (Figure 1A).
Figure 1.
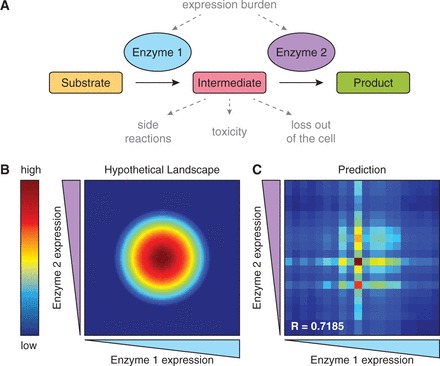
Metabolic enzyme expression balancing and modeling. (A) A hypothetical two-gene metabolic pathway. Overexpression of enzymes may cause a burden to the cell; the intermediate may be non-productive by reacting with alternative enzymes, causing cytotoxicity, or leaving the cell by active or passive transport. (B) The associated production landscape showing that for one or a combination of the above-stated scenarios, moderate gene expression is optimal. (C) An example of the landscape predicted by a regression model trained on 100 randomly sampled points from the true landscape. The correlation coefficient shown is between the predicted and true values in the 20-by-20 discretized space.
Perhaps the most straightforward approach to balancing enzyme expression levels would be to begin at an arbitrary starting expression level and then iteratively adjust expression of each gene to identify its optimum. However, this approach is time-consuming, particularly as the number of genes to balance increases. A more elegant solution is to survey all possible expression levels combinatorially, which has the advantage of not only reducing the time cost but also reveals the overall multi-dimensional production landscape. To date, few production landscapes have been explored owing to the prior difficulties both in building libraries as well as determining enzyme expression levels. Close inspection of two landscapes that have been explored, the isoprenoid pathway for taxadiene production in Escherichia coli (2) and xylose fermentation in Saccharomyces cerevisiae (19), show that iterative expression tuning could potentially fail to identify the true optimum depending on the order in which operons or enzymes were tuned. Although combinatorial libraries enable researchers to avoid these traps, one major difficulty faced is the limited scale that can be practically surveyed. The library diversities in the aforementioned examples were 16 and 8 combinations, respectively, allowing these libraries to be exhaustively sampled. Much larger libraries that include more expression levels, operons or enzymes approach a limit where exhaustive sampling is not feasible.
A notable exception to this limit exists for pathways with a phenotype that can be assayed in high throughput, such as growth rate or production of a colored molecule. Recently, another xylose-using S. cerevisiae strain was isolated from a library of ∼1000 combinations via selection on xylose as the sole carbon source (20). In another study, expression levels of 24 genes involved in lycopene biosynthesis in E. coli were optimized using multiplex automated genome engineering (21). These stunning examples of large-scale optimization demonstrate the power of combinatorial expression libraries; however, harnessing this enormous diversity required a high-throughput screen or selection to efficiently comb through the vast assortment of genetic variants. Unfortunately, the majority of small molecules of interest, including most biofuels and specialty chemicals, must be quantified using analytical methods such as high performance liquid chromatography (HPLC), gas chromatography-mass spectrometry (GC-MS), liquid chromotography-mass spectrometry (LC-MS) and so forth, which provide insufficient throughput to warrant the use of these emerging technologies for constructing massive libraries for combinatorial searches.
We propose that computational modeling can provide the necessary link between large searches and targets that are difficult to screen. If gene expression can be reliably controlled, the production landscape of a molecule can be discretized into a multi-dimensional grid of expression space, and, by sampling this space, we can fit a function that relates gene expression to product titer. To that end, we constructed and characterized an S. cerevisiae promoter set that exhibited robust control over gene expression. We developed a standardized assembly strategy to build combinatorial libraries, as well as a rapid genotyping method to determine the promoter identity for each gene in a given library member. We then used linear regression to fit a model to the genotype and titer measurement data. As a challenging test of this relatively straightforward modeling approach, we examined the highly complex violacein biosynthetic pathway. This pathway exhibited several characteristics that commonly plague metabolic engineers: a branched pathway structure leading to off-target side reactions, both enzymatic and spontaneous; promiscuous enzymes that can recognize multiple intermediates as their substrate; and, being the first report to our knowledge to express the pathway in S. cerevisiae, uncertainty in enzyme activity in the heterologous host. Despite these traits, we successfully produced violacein in yeast, and we used a regression model to predict strains that selectively maximized production of any one of the four primary products in the pathway.
MATERIALS AND METHODS
Strains and growth media
The base S. cerevisiae strain for all experiments in this article was BY4741 (MATa his3Δ1 leu2Δ0 met15Δ0 ura3Δ0). Wild-type yeast cultures were grown in YPD (10 g/l Bacto Yeast Extract; 20 g/l Bacto Peptone; 20 g/l Dextrose). Yeast transformed with plasmids containing the MET15, HIS3, LEU2 or URA3 auxotrophic markers were selected and grown on synthetic complete media (6.7 g/l Difco Yeast Nitrogen Base without amino acids; 2 g/l Drop-out Mix Synthetic Minus appropriate amino acids, without Yeast Nitrogen Base (US Biological); 20 g/l Dextrose).
Yeast expressing the violacein pathway was grown on selective media for 48 h at 30°C. Cells grown on solid media containing 2% agar often took an additional 24–48 h (at 4°C) for color to develop fully.
Restriction cloning reactions were transformed in TG1 and DH10B chemically competent E. coli. Gibson assembly reactions were transformed in TransforMax EPI300 (Epicentre) electrocompetent E. coli. Transformed cells were selected on Lysogeny Broth (LB) containing antibiotics ampicillin or kanamycin.
Standard yeast cloning vectors
Yeast cloning vectors derived from pRS316 were constructed to include unique restriction sites that flank each modular region of an expression cassette as well as allow for BglBrick-style cloning of protein fusions (using BglII, BamHI and XhoI) (22) and BioBrick-style idempotent cloning of entire cassettes (using EcoRI, SpeI, XbaI and PstI) (23). Cloning vectors are listed in Supplementary Table S1.
Yeast fluorescent protein measurement
Yeast transformed with plasmids expressing one or more fluorescent proteins were grown to saturation shaking in 96-deep-well blocks at 30°C. Cell density (OD600) and fluorescence were measured using a TECAN Safire2.
Violacein biosynthetic pathway
Genes for the violacein biosynthetic pathway were amplified from plasmid BBa_K274002 obtained from the Registry of Standard Biological Parts (partsregistry.org). A list of primers used for cloning the violacein genes are listed in Supplementary Table S2, and a list of plasmids expressing those genes are listed in Supplementary Table S1.
One-step isothermal assembly
Standard vectors were constructed, flanked by pairs of homology sequences derived from yeast barcodes (24) at the ends of each expression cassette. We reasoned that as these barcode sequences were designed to be orthogonal, they could serve a dual purpose of reducing the probability of mis-annealing and dictating the assembly order of multiple cassettes. vioA was flanked by an ‘A’ and ‘C’ homology sequence; vioB by ‘A’ and ‘B’; vioC by ‘C’ and ‘D’; vioD by ‘B’ and ‘C’; vioE by ‘C’ and ‘D’; backbone vectors contained ‘A’ and ‘D’ receiving sequences. Entire 5′ homology-promoter-gene-terminator-3′ homology cassettes were amplified by PCR; backbone vectors were also amplified by PCR or double-digested using SpeI/XbaI (n.b., Taq DNA Ligase in the Gibson enzyme mix does not ligate compatible 4 bp overhangs). Thus, vioAC and vioBDE plasmids were assembled using the compatible homology regions as the overlapping sequences for one-step isothermal assembly, which were performed as described in Gibson et al. (6). See Supplementary Tables S1 and S2 for a list of plasmids and amplification primers.
There were some instances of mis-assembly where one or more cassettes may not be incorporated; however, this represented a relatively low percentage in three-gene assemblies (∼25–33%) and even lower for two-genes (∼8%). Additionally, in many of these cases of mis-assembly, homology of the inserts with the middle of the vector backbone resulted in the loss of the yeast replication origin and/or selection marker such that on transformation into yeast, the fraction of correctly assembled constructs that propagated in yeast was considerably higher.
Library plasmid purification
Libraries constructed by restriction or one-step isothermal assembly were transformed and plated on LB-agar plates containing antibiotic. After colonies appeared, plates were scraped, and the pooled collection of colonies was used for plasmid purification.
Extraction of pathway products
Yeast clones were grown in 1 ml of synthetic media split into two wells in a 96-deep-well block in an ATR shaker at 30°C for 48 h. Cultures were recombined and pelleted in a microcentrifuge for 3 min at 14 000 rpm. The pellets were resuspended in 500 µl of methanol and boiled at 95°C for 15 min, vortexing halfway through. Resuspensions were pelleted, and the supernatant (extract) was transferred to new microcentrifuge tubes and pelleted to remove remaining cell debris. Final extracts were transferred to glass vials for analysis on HPLC.
HPLC analysis of pathway products
Ten microliters of extract were run on an Agilent Rapid Resolution SB-C18 column (30 × 2.1 mm, 3.5 µm particle size) on an Agilent 1200 Series LC system with the following method (Solvent A is 0.1% formic acid in water; Solvent B is 0.1% formic acid in acetonitrile): start at 5% B; hold at 5% B for 1.5 min; 16.9%/min to 98% B; hold at 98% B for 2 min; 3.1%/s to 5% B; hold at 5% B for 2.5 min. The column temperature was 30°C, and absorbance was measured with a UV/VIS detector. All measurements presented here reflect the peak area at a specified elution time and wavelength (5.5 min/565 nm for violacein; 5.9 min/565 nm for deoxyviolacein; 5.1 min/600nm for proviolacein; 5.4 min/610 nm for prodeoxyviolacein) (see Supplementary Figure S1 for sample chromatogram and absorbance spectra). Pure standards for our target compounds were commercially unavailable, and therefore absolute mass measurements were not possible; a mixed extract of violacein/deoxyviolacein could be purchased (Sigma-Aldrich), and we estimate that a peak area of 150 au corresponds to ∼10 mg/l violacein.
TaqMan rapid analysis of combinatorial assemblies (TRAC)
A slightly modified version of the TaqMan protocol described in Kong et al. (25) was used to identify each unique promoter. A list of probes and their sequences (labeled oligonucleotides provided by Integrated DNA Technologies) are available in Supplementary Table S3, and a list of amplification primers are listed in Supplementary Table S2. A universal probe mix (2 µM each dye-strand, 2.4 µM each quencher-strand) was prepared in water. Template for PCR was prepared by resuspending a 1 mm-diameter yeast colony in 25 µl of 20 mM NaOH or by pelleting and resuspending a saturated yeast culture in 2.5 volumes of 20 mM NaOH, then boiling for 10 min, pelleting and recovering the supernatant. A 25 µl of a TRAC reaction included: 2.5 µl of 10× PCR buffer [100 mM Tris–HCl, 500 mM KCl, 15 mM MgCl2 (pH 8.3) @ 25°C], 0.5 µl of 10 mM dNTP mix, 1 µl of each 10 µM PCR primer, 0.75 µl of probe mix, 2.5 µl of template, 0.5 µl of Taq DNA polymerase and 16.25 µl of water. PCRs were run as follows: initial denaturing at 94°C for 5 min, 50 amplification cycles (94°C for 10 s, 50°C for 30 s, 68°C for 1 min) and a final elongation at 68°C for 10 min. Twenty microliters of the reaction were diluted with 80 µl of water and loaded onto a Costar 96-well flat bottom polystyrene assay plate and measured for fluorescence using a TECAN Safire2.
For a sufficiently large number of randomly sampled colonies, fluorescence measurements for each channel segregated into two distinct clusters corresponding to background (quenched) and positive hits (released) (Supplementary Figure S2).
RESULTS
Modeling a production landscape using linear regression
Modeling the intricate network of enzymes and metabolites of cell metabolism presents a daunting task. There are many parameters to be considered, such as enzyme kinetics and intracellular metabolite concentrations, but these data are often unavailable, especially for heterologously expressed genes. Additionally, gene clusters taken from exotic organisms may not be fully characterized, and even the order of the reactions and identity of the intermediates of the pathway could be unknown. Therefore, it can be advantageous to take a simpler modeling approach that is somewhat naïve to the complexities of biology.
We chose to use a linear regression model (26) trained on empirical data to relate expression level combinations to product titer. As an initial test, we generated a hypothetical production landscape of a two-gene pathway designed to mimic that of the taxadiene pathway described by Ajikumar et al. (2) where intermediate expression levels were optimal (Figure 1B). We discretized the continuous expression of each gene into 20 levels (e.g. promoter strengths) and sampled 100 random points from the resulting lattice. The model we trained is a categorical model, wherein the presence or absence of each promoter-gene combination is represented as an independent variable, rather than a relative expression level for each gene (see Supplementary Information for more details). A predicted landscape representative of 100 simulations is shown in Figure 1C. Although the model is not perfect in accurately predicting every point, it is certainly able to determine that moderate expression of both enzymes is preferred over high or low expression.
The limitations of the model’s predictive power are a consequence of the assumptions necessary to maintain simplicity. First, we assumed that each enzyme contributes to pathway flux independently. We know that this may be biologically inaccurate, owing to potential interactions between enzymes or regulation that would result in co-dependence of two or more enzymes. However, including these non-linear interactions would greatly increase the amount of data necessary to train the model, a quantity we sought to limit. By extension, we assumed that production landscapes in general are relatively smooth and contain a single peak. Naturally, these assumptions will prevent the model from successfully identifying the optimum for certain outstanding cases, but for most pathways, it should provide an excellent first-pass analysis of how the pathway responds to changing gene expression.
Constitutive promoters provide robust control over protein expression
To implement the modeling approach described earlier in the text, we first needed control over protein expression, which we accomplished by varying promoters. We defined several criteria for designing a promoter library: (i) a wide range of transcriptional strengths that are evenly distributed; (ii) minimal variation in strength with respect to different coding sequences; and (iii) orthogonal DNA sequences to minimize recombination and simplify genotyping. Thus, we avoided promoter mutagenesis, such as the commonly used TEF1 library (27,28), because of the high degree of homology between those promoters and their relatively limited range of 10-fold expression. Instead, we collected a set of sequences taken from upstream of the translational start site of several yeast genes observed to have a broad range of expression levels (29), and we cloned 700 bp as canonical ‘promoters’ in front of three fluorescent reporters, mKate2 (red fluorescent protein, RFP), Venus (yellow fluorescent protein, YFP) and cyan fluorescent protein (CFP), to test against our criteria.
We identified a set of five promoters—pTDH3 (only 680 bp), pTEF1, pRPL18B, pRNR2 and pREV1—that had all of our desired characteristics. The promoters spanned nearly three orders of magnitude in red and yellow fluorescence, with relatively even separation between members on a log-scale (Figure 2A, see Supplementary Figure S3 for all promoters tested). We were concerned that the strength of these promoters would be influenced by the downstream coding sequence, as is often observed in E. coli owing to interactions with the ribosome binding site (30–32). To address this, we cloned our promoter set in front of a random sequence of 24 nucleotides fused to YFP and saw that the relative rank order of promoters was remarkably well maintained (Figure 2B and C). Because we are only controlling transcription, we cannot ensure absolute protein levels, which may be influenced by other factors such as transcript and polypeptide length, folding or translation rate; however, these effects are largely dependent on sequence, not concentration, and so high and low amounts of a given transcript should be affected equally, giving rise to the consistency of relative promoter strengths for a particular coding sequence.
Figure 2.
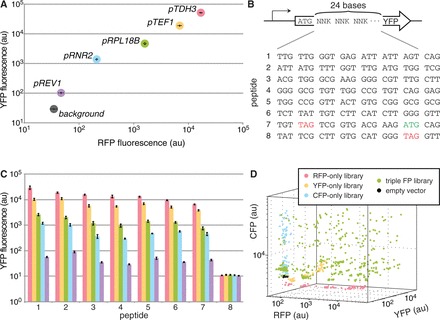
Characterization of yeast constitutive promoters. (A) Five promoter regions cloned from the yeast genome give consistent expression of two fluorescent reporters. (B) Twenty-four random nucleotides are fused to the 5′ end of YFP. Notably, sequence 7 has an in-frame stop codon and a second start codon; sequence 8 has an in-frame stop codon. (C) Random nucleotide sequences do not appreciably alter YFP fluorescence (compare all bars of a single color). Additionally, the rank order of promoter strengths for a given coding sequence is maintained (compare all sets of bars for a given peptide). (D) Combinatorial assembly of promoter libraries: five promoters are combinatorially cloned in front of RFP, YFP and CFP separately (red, yellow and blue); RFP, YFP and CFP libraries are combinatorially assembled (green); empty vector (black). Error bars in panels (A) and (C) indicate s.e.m; n = 8.
In contrast to the simulated scenario, we decided to use these five promoters rather than 20 for practical reasons. First, although having more promoters would provide higher resolution of the landscape, it would also increase the total diversity of the library, thus requiring a higher sampling rate. Second, given the limits on the dynamic range that can be accessed by changing the promoter at single copy (approximately three orders of magnitude), having 20 promoters would means that each promoter resulted in only 50% more protein than the next lowest promoter. It could prove difficult to deconvolve the contributions of these small differences in expression and noise in sample measurement. Rather, the larger, roughly 500% increments from a five-member library are more likely to provide meaningful data.
Although we avoided highly homologous sequences for each promoter, because we intended to use them in long pathways, we were still concerned about recombination, as the same promoter could appear more than once in a single plasmid. Thus, we cloned RFP and YFP onto a single plasmid with both genes driven by the same promoter (e.g. pTDH3-RFP-terminator-pTDH3-YFP-terminator) and used loss of fluorescence as an indicator of homologous recombination between repeated promoter or terminator sequences. We also reversed the order of the genes (YFP-RFP) and included CFP (RFP-YFP-CFP). Only ∼1% of colonies lost a fluorescent reporter (Supplementary Table S4), and in the absence of any selective pressure to recombine, transformants with fully intact plasmids remained stable after subculturing every 24 h for 5 days, with zero clones of 48 losing any of their reporters.
Construction of multi-gene libraries
Using this characterized set of promoter sequences, we sought to generate combinatorial libraries in which we simultaneously titrated the expression of all pathway genes. We designed standardized modular cloning vectors for constructing multi-gene plasmids using Gibson assembly (6,33) (Supplementary Figure S4), which allowed us to combine arbitrary combinations of genes and promoters easily. To test our cloning strategy, we took three separate fluorescent protein libraries (RFP, YFP and CFP) and assembled them into a single plasmid library (complexity of 53 = 125 members). In comparing the fluorescence of colonies picked from the three-fluorescent protein library to that of colonies picked from each of the single fluorescent protein libraries, we saw that the triple-library roughly covered all of the 3D ‘expression space’ spanned by our promoters (Figure 2D and Supplementary Figure S5). As can be seen in Supplementary Figure S5, fluorescence of the triple-library clones clustered around the discrete intervals set by the promoters, occupying a lattice of points. We expect to see a similar pattern of coverage for the n-dimensional expression space of an n-gene system.
TRAC, a rapid genotyping assay
Although the goal of our modeling approach was to reduce the number of sample measurements, our cloning strategy was intended to be unrestrictive in the number of genes that could be expressed. Therefore, we anticipated a need for a rapid and inexpensive method for identifying the unknown promoters driving each gene for a given clone isolated from the library. The turnaround time compared with purification and sequencing of plasmids or PCR products could be considerably reduced with an assay that directly determined promoter identity.
As our promoter sequences were highly orthogonal, we were able to easily adapt the TaqMan method used in quantitative real-time PCR and allelic discrimination. For our assay, TaqMan Rapid Analysis of Combinatorial assemblies (TRAC), we designed five orthogonal DNA oligonucleotide duplex probes (25), specific for each of the five promoter sequences and labeled with spectrally distinct, fluorescent dyes and Förster resonance energy transfer quenchers (Supplementary Table S3). When these probes were included in a PCR reaction with gene-specific primers amplifying an unknown promoter, only one fluorescent dye was released, which corresponded to the promoter present at that locus (Supplementary Figures S2 and S6). This fluorescent signal could be read on a standard plate reader, which simplified the genotyping process by eliminating the need for a downstream gel, purification or sequencing reaction. Not only was the time required for genotype identification low but also the additional cost of oligonucleotide probes added only cents per reaction.
Because the specificity of the gene is determined by the PCR primers and not the fluorescent probes, this genotyping method is scalable to any number of genes. However, we were curious whether we could expand the number of unique sequences that could be identified by TRAC, in case a larger set of promoters were needed for future applications. There is a limit to the number of probes that can be used simultaneously due to overlapping excitation and emission spectra of the dyes. However, by designing sequences that contained either complementary or non-complementary sequences for all five probes in a row, we were able to detect 32 (25) unique ‘TRAC barcodes’ (Supplementary Figure S7 and Supplementary Table S5). A sixth fluorescent dye, Alexa Fluor® 750, available from Integrated DNA Technologies, has excitation and emission spectra that do not overlap with our current set of five, although we have not tested it. If it proved to be compatible, it would enable detection of up to six unique sequences by standard TRAC, or up to 64 (26) unique TRAC barcodes.
Violacein biosynthesis as a model pathway
With the tools in hand to construct and analyze metabolic pathways, we demonstrated our approach using the five-gene violacein biosynthetic pathway (vioABEDC) from Chromobacterium violaceum (34) (Figure 3 and Supplementary Figure S8). The primary reason we chose this pathway as a model system was not for its final product, but rather for the interesting characteristics of the pathway itself. First, the pathway is highly branched, leading to several potential products. This would allow us to raise the question of whether regression modeling can be used to predict strains that preferentially direct flux down a particular branch. Second, the enzyme encoded by vioC is known to act on two pathway intermediates (protoviolaceinic acid and protodeoxyviolaceinic acid) as substrates. Finally, not only had this pathway not been previously expressed in yeast but also much of the pathway was only recently characterized (34,35), and some of the side pathway reactions have yet to be determined. Together, we felt these traits made violacein a challenging pathway for our strategy and one that was representative of many metabolic engineering efforts.
Figure 3.
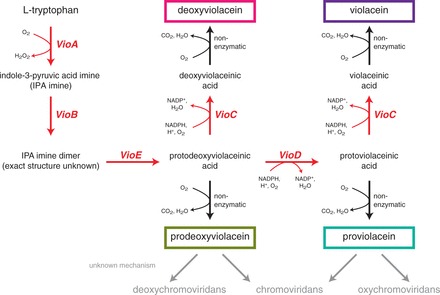
The violacein biosynthetic pathway. Violacein is synthesized through five enzymatic steps and one non-enzymatic reaction from two molecules of tryptophan. Side-products detectable by HPLC after expression in yeast include deoxyviolacein, proviolacein, and prodeoxyviolacein. Additional side-products (in gray) deoxychromoviridans, chromoviridans, and oxychromoviridans are reported in the literature but are not produced in significant quantities in our strain; the precise mechanism of the reaction forming these products is still uncertain. See Supplementary Figure S8 for a detailed pathway with molecule structures.
We transformed yeast with the assembled combinatorial pathway library (55 = 3125 combinations), and the resulting colonies had a wide range of colors and intensities (Supplementary Figure S9). Although the pathway’s products exhibit a color phenotype, we recognized that the majority of chemical compounds are not colored. Therefore, we decided to forego a colorimetric screen in favor of HPLC, a low-throughput analytical method that would be more representative of other pathways of interest (Supplementary Figure S1). HPLC analysis revealed that when the pathway was expressed in yeast, four major compounds—violacein, deoxyviolacein, proviolacein and prodeoxyviolacein—were produced in significant quantities, while only trace amounts of deoxychromoviridans, chromoviridans and oxychromoviridans were detected in some samples. The reaction mechanism for the formation of the chromoviridans compounds has neither been previously determined nor is it clear why that reaction would be inefficient in yeast.
Model predictions of the violacein pathway
We sampled 91 random transformants from our expression library, identified their promoter genotypes using TRAC and measured their production titers for each of the four primary products. Using these data, we trained four models—one for each target—and then tested them against a test set of 96 additional, unique and random clones. Despite the complexities of the pathway, we found the correlation between the models’ predictions, and our empirical measurements were high (Pearson correlation coefficients were 0.80 for violacein, 0.77 for deoxyviolacein, 0.83 for proviolacein and 0.92 for prodeoxyviolacein) (Figure 4). To test the effect of training set size on predictive power, we took random subsets of the original training set and measured correlation between the resulting models’ predictions and the full 96-member test set data (Supplementary Figure S10). We repeated this experiment 100 times for subsets of size: 5, 10, 20 and 50 (and 91). Interestingly, beyond the initial dramatic increase in correlation coefficient, only modest improvements were seen when increasing the training set to 50 or 91 samples. This suggests that a relatively low sampling rate (in this case, between 1 and 2%) may be sufficient for generating a predictive model.
Figure 4.
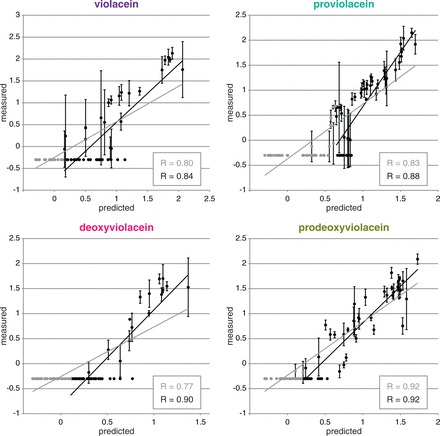
Model predictions. Comparison of model predictions with empirical measurements for a test set of 96 unique combinations. Black circles indicate the upper 48 combinations sorted by predicted titer for each respective product; gray circles indicate the lower 48. The gray lines and correlation constants were calculated using all 96 data points; the black lines and correlation constants were calculated using only the upper 48 data points (i.e. to roughly omit data that could be below the limit of detection). Axes are the logarithm of the titer, where titer is measured by the HPLC peak area in arbitrary units, n.b. negative values indicate a titer less than 1 au, not a net negative production; error bars indicate s.d.; n = 3.
We observed that a large number of samples in both the training and test sets had production levels below the limit of detection of our extraction and measurement protocols. Because of this, the models were trained on inherently flawed data on the low-production end, and therefore could not be expected to be as successful in predicting that range. However, it is encouraging that the models show much better correlation for highly productive strains (Pearson correlation coefficients were 0.84 for violacein, 0.90 for deoxyviolacein, 0.88 for proviolacein and 0.92 for prodeoxyviolacein) (Figure 4), suggesting that the models’ predictive power could be easily improved with higher quality data.
A far more interesting test of a model is whether it can forward-predict strains that would result in a desired phenotype. In this case, we took advantage of the branched nature of the violacein pathway and considered whether the models could predict genotypes that direct flux down any particular branch. We cloned the top five predicted combinations for each of the four products and measured product titers from the resulting strains. We found the models were able to accurately capture the behavior of the pathway and provided predictions that preferentially produced one of the four possible products (Figure 5 and Supplementary Table S6). For a given product queried, the predicted strains produced greater amounts of the desired target while minimizing the amount of off-target production as compared with strains predicted for any of the other three compounds.
Figure 5.
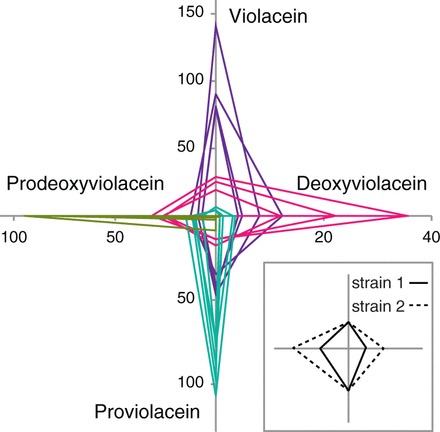
Strains with directed flux. The top five predicted combinations for each product and their associated relative titers. The five predictions for a given product are grouped by color: purple for violacein, pink for deoxyviolacein, teal for proviolacein, green for prodeoxyviolacein. Each predicted group shows preferential production of one product over the other three. Axes are relative product titer (HPLC peak area) in arbitrary units; each point is an average of four biological replicates (error bars not shown for clarity, but values are provided in Supplementary Table S6). Each closed loop represents a single strain, and the vertices indicate the titers of the four products. For example, strain 1 (solid line) produces equal amounts of violacein and proviolacein as strain 2 (dotted line) but half as much deoxyviolacein and prodeoxyviolacein (inset).
DISCUSSION
Synthetic biology strives to engineer biological systems to meet desired specifications using rigorously tested parts and models to achieve predictable behaviors. Given our incomplete understanding of the cell and its metabolism, but bolstered by our knowledge that metabolic flux is highly impacted by enzyme concentrations, systematically varying expression provides a promising approach for increasing production titers. The utility of these expression libraries can be augmented by using robust well-characterized promoters that enable researchers to infer expression phenotype from genotype and consequently gain insight into the design principles of a particular pathway. The promoters we constructed reliably span a wide range of expression strengths while maintaining their relative rank ordering, irrespective of the coding sequence of the expressed gene. The steps of library construction and analysis are designed to be both generalizable to other pathways and scalable to increased numbers of enzymes to enable researchers to adopt the approach with relative ease. Additionally, this strategy need not be limited to this set of promoters or even to S. cerevisiae, as the only data required are production output and a measure for gene expression. The ability to link expression levels directly to the DNA sequence by using reliable well-characterized control elements—whether they be transcriptional, translational or post-translational—is essential for rapidly gathering data from many clones on several genes. For example, a newly developed expression architecture termed ‘bicistronic design’ could provide robust control in E. coli, where it had previously been lacking (32). Certainly, manipulating expression alone cannot be expected to yield a perfect strain, but these combinatorial libraries are compatible with classical methods such as protein engineering and directed evolution.
A recent review of metabolic engineering proposed that the goal of new engineering frameworks is to gain as much information as possible from a small number of experiments to allow researchers to hone in on the relevant areas and directions to explore (5). Our modeling strategy is much aligned with this idea, as it only requires a modest number of measurements, unlike traditional combinatorial library approaches, which necessitate a high-throughput screen or selection. Although linear regression may appear to be an overly simplified representation of a metabolic pathway, this is not the first time that linear regression has been used to describe a highly complex biological phenomenon. Linear regression was used in protein engineering to great effect to improve activity of a halohydrin dehalogenase (36) and predict thermostability in engineered cytochrome P450s (37).
Although protein-folding energy landscapes are commonly thought to be highly irregular owing to the numerous semi-stable conformations that a protein may access, we believe that metabolic production landscapes are generally smoother. Although it has been previously shown that moderate gene expression can sometimes be optimal (2,20), it is not clear whether the inverse is possible—a multi-peaked landscape where moderate expression is detrimental and both high and low expression are beneficial. The model would likely be incapable of accurately describing a landscape containing multiple peaks, depending on the relative size and sharpness of the peaks and the sampling bias in the training set. However, we would expect this type of scenario to be rare. A more likely occurrence is a pathway that produces a toxic intermediate, where the relationship between enzymes (e.g. the ratio or the sum of activities) must be maintained, which we suspect would result in a ridge-like topology. These ridges would still present a challenge to the model, as they are incongruent with our assumption of enzyme independence, and so depending on the particular shape of the ridge (e.g. a shallow slope along the top of the ridge), the model may not succeed in identifying the true optimum. The objective for this modeling strategy is to provide an estimation of the production landscape for newly engineered pathways, and, as such, failure to accurately describe and predict expression-level dependent performance, while problematic, highlights the possible presence of interesting biology to investigate in more detail.
In conclusion, we have developed a novel approach for optimizing enzyme expression for an engineered metabolic pathway that integrates combinatorial libraries with regression modeling to guide the researcher with a map of the production landscape. A major advantage of this strategy is that it requires no knowledge of absolute protein or metabolite levels, enzyme kinetics or thermodynamics, or even the order of the reactions. As such, the method is particularly useful when engineering new pathways that are not fully characterized, e.g. gene clusters mined from metagenomic studies or pathways with enzymes that have not been or cannot be easily purified and biochemically characterized. The results from an initial modeling attempt could be used as a starting point to investigate other avenues of optimization, be they as simple as further expression optimization or as involved as mutagenesis and directed evolution. In concert with these and other established metabolic engineering techniques, our strategy should dramatically accelerate the development of highly optimized strains as a sustainable replacement for chemical production.
SUPPLEMENTARY DATA
Supplementary Data are available at NAR Online, including [38].
FUNDING
Energy Biosciences Institute (to J.E.D. and M.E.L.); Department of Defense through the National Defense Science & Engineering Graduate Fellowship Program (to M.E.L.); National Science Foundation [CNS-0931843 (CPS-ActionWebs) to A.A. and C.J.T.]. Funding for open access charge: Energy Biosciences Institute.
Conflict of interest statement. None declared.
Supplementary Material
ACKNOWLEDGEMENTS
The authors thank J.C. Anderson, A. Arkin, W. DeLoache, H. El-Samad and M. Price for feedback and discussion during the preparation of this manuscript. They especially thank S. Bauer for assistance with analytical HPLC measurements. They also thank K. Tipton, J. Chodera and S. Mondal for additional experimental help, as well as members of the Dueber laboratory for discussions.
REFERENCES
- 1.Paddon CJ, Westfall PJ, Pitera DJ, Benjamin K, Fisher K, McPhee D, Leavell MD, Tai A, Main A, Eng D, et al. High-level semi-synthetic production of the potent antimalarial artemisinin. Nature. 2013;496:528–532. doi: 10.1038/nature12051. [DOI] [PubMed] [Google Scholar]
- 2.Ajikumar PK, Xiao W-H, Tyo KEJ, Wang Y, Simeon F, Leonard E, Mucha O, Phon TH, Pfeifer B, Stephanopoulos G. Isoprenoid pathway optimization for Taxol precursor overproduction in Escherichia coli. Science. 2010;330:70–74. doi: 10.1126/science.1191652. [DOI] [PMC free article] [PubMed] [Google Scholar]
- 3.Steen EJ, Chan R, Prasad N, Myers S, Petzold CJ, Redding A, Ouellet M, Keasling JD. Metabolic engineering of Saccharomyces cerevisiae for the production of n-butanol. Microb. Cell Fact. 2008;7:36. doi: 10.1186/1475-2859-7-36. [DOI] [PMC free article] [PubMed] [Google Scholar]
- 4.Steen EJ, Kang Y, Bokinsky G, Hu Z, Schirmer A, Mcclure A, Cardayre SBD, Keasling JD. Microbial production of fatty-acid-derived fuels and chemicals from plant biomass. Nature. 2010;463:559–562. doi: 10.1038/nature08721. [DOI] [PubMed] [Google Scholar]
- 5.Yadav VG, De Mey M, Lim CG, Ajikumar PK, Stephanopoulos G. The future of metabolic engineering and synthetic biology towards a systematic practice. Metab. Eng. 2012;14:233–241. doi: 10.1016/j.ymben.2012.02.001. [DOI] [PMC free article] [PubMed] [Google Scholar]
- 6.Gibson DG, Young L, Chuang R-Y, Venter JC, Hutchison CA, Smith HO. Enzymatic assembly of DNA molecules up to several hundred kilobases. Nat. Methods. 2009;6:343–345. doi: 10.1038/nmeth.1318. [DOI] [PubMed] [Google Scholar]
- 7.Gibson DG, Benders GA, Axelrod KC, Zaveri J, Algire MA, Moodie M, Montague MG, Venter JC, Smith HO, Hutchison CA. One-step assembly in yeast of 25 overlapping DNA fragments to form a complete synthetic Mycoplasma genitalium genome. Proc. Natl Acad. Sci. USA. 2008;105:20404–20409. doi: 10.1073/pnas.0811011106. [DOI] [PMC free article] [PubMed] [Google Scholar]
- 8.Shao Z, Zhao H, Zhao H. DNA assembler, an in vivo genetic method for rapid construction of biochemical pathways. Nucleic Acids Res. 2009;37:e16. doi: 10.1093/nar/gkn991. [DOI] [PMC free article] [PubMed] [Google Scholar]
- 9.Li MZ, Elledge SJ. Harnessing homologous recombination in vitro to generate recombinant DNA via SLIC. Nat. Methods. 2007;4:251–256. doi: 10.1038/nmeth1010. [DOI] [PubMed] [Google Scholar]
- 10.Quan J, Tian J. Circular polymerase extension cloning of complex gene libraries and pathways. PLoS One. 2009;4:e6441. doi: 10.1371/journal.pone.0006441. [DOI] [PMC free article] [PubMed] [Google Scholar]
- 11.Zhang Y, Werling U, Edelmann W. SLiCE: a novel bacterial cell extract-based DNA cloning method. Nucleic Acids Res. 2012;40:e55. doi: 10.1093/nar/gkr1288. [DOI] [PMC free article] [PubMed] [Google Scholar]
- 12.Engler C, Kandzia R, Marillonnet S. A one pot, one step, precision cloning method with high throughput capability. PLoS One. 2008;3:e3647. doi: 10.1371/journal.pone.0003647. [DOI] [PMC free article] [PubMed] [Google Scholar]
- 13.Pitera DJ, Paddon CJ, Newman JD, Keasling JD. Balancing a heterologous mevalonate pathway for improved isoprenoid production in Escherichia coli. Metab. Eng. 2007;9:193–207. doi: 10.1016/j.ymben.2006.11.002. [DOI] [PubMed] [Google Scholar]
- 14.Zhu MM, Skraly FA, Cameron DC. Accumulation of Methylglyoxal in Anaerobically Grown Escherichia coli and Its Detoxification by Expression of the Pseudomonas putida Glyoxalase I Gene. Metab. Eng. 2001;3:218–225. doi: 10.1006/mben.2001.0186. [DOI] [PubMed] [Google Scholar]
- 15.Kristensen C, Morant M, Olsen CE, Ekstrøm CT, Galbraith DW, Lindberg Møller B, Bak S. Metabolic engineering of dhurrin in transgenic Arabidopsis plants with marginal inadvertent effects on the metabolome and transcriptome. Proc. Natl Acad. Sci. USA. 2005;102:1779. doi: 10.1073/pnas.0409233102. [DOI] [PMC free article] [PubMed] [Google Scholar]
- 16.Glick BR. Metabolic load and heterologous gene expression. Biotechnol. Adv. 1995;13:247–261. doi: 10.1016/0734-9750(95)00004-a. [DOI] [PubMed] [Google Scholar]
- 17.Neubauer P, Lin HY, Mathiszik B. Metabolic load of recombinant protein production: inhibition of cellular capacities for glucose uptake and respiration after induction of a heterologous gene in Escherichia coli. Biotechnol. Bioeng. 2003;83:53–64. doi: 10.1002/bit.10645. [DOI] [PubMed] [Google Scholar]
- 18.Pfleger BF, Pitera DJ, Smolke CD, Keasling JD. Combinatorial engineering of intergenic regions in operons tunes expression of multiple genes. Nat. Biotechnol. 2006;24:1027–1032. doi: 10.1038/nbt1226. [DOI] [PubMed] [Google Scholar]
- 19.Lu C, Jeffries T. Shuffling of promoters for multiple genes to optimize xylose fermentation in an engineered Saccharomyces cerevisiae strain. Appl. Environ. Microbiol. 2007;73:6072–6077. doi: 10.1128/AEM.00955-07. [DOI] [PMC free article] [PubMed] [Google Scholar]
- 20.Du J, Yuan Y, Si T, Lian J, Zhao H. Customized optimization of metabolic pathways by combinatorial transcriptional engineering. Nucleic Acids Res. 2012;40:e142. doi: 10.1093/nar/gks549. [DOI] [PMC free article] [PubMed] [Google Scholar]
- 21.Wang HH, Isaacs FJ, Carr PA, Sun ZZ, Xu G, Forest CR, Church GM. Programming cells by multiplex genome engineering and accelerated evolution. Nature. 2009;460:894–898. doi: 10.1038/nature08187. [DOI] [PMC free article] [PubMed] [Google Scholar]
- 22.Anderson JC, Dueber JE, Leguia M, Wu GC, Goler JA, Arkin AP, Keasling JD. BglBricks: A flexible standard for biological part assembly. J. Biol. Eng. 2010;4:1. doi: 10.1186/1754-1611-4-1. [DOI] [PMC free article] [PubMed] [Google Scholar]
- 23.Shetty RP, Endy D, Knight TF. Engineering BioBrick vectors from BioBrick parts. J. Biol. Eng. 2008;2:5. doi: 10.1186/1754-1611-2-5. [DOI] [PMC free article] [PubMed] [Google Scholar]
- 24.Shoemaker DDD, Lashkari DAD, Morris DD, Mittmann MM, Davis RWR. Quantitative phenotypic analysis of yeast deletion mutants using a highly parallel molecular bar-coding strategy. Nat. Genet. 1996;14:450–456. doi: 10.1038/ng1296-450. [DOI] [PubMed] [Google Scholar]
- 25.Kong D, Huang Y, Zhang X, Yang W, Shen H, Mi H. Duplex probes: a new approach for the detection of specific nucleic acids in homogenous assays. Anal. Chim. Acta. 2003;491:135–143. [Google Scholar]
- 26.Aswani A, Bickel P, Tomlin C. Regression on manifolds: estimation of the exterior derivative. Ann. Stat. 2011;39:48–81. [Google Scholar]
- 27.Alper H, Fischer C, Nevoigt E, Stephanopoulos G. Tuning genetic control through promoter engineering. Proc. Natl Acad. Sci. USA. 2005;102:12678–12683. doi: 10.1073/pnas.0504604102. [DOI] [PMC free article] [PubMed] [Google Scholar]
- 28.Nevoigt EE, Kohnke JJ, Fischer CRC, Alper HH, Stahl UU, Stephanopoulos GG. Engineering of promoter replacement cassettes for fine-tuning of gene expression in Saccharomyces cerevisiae. Appl. Environ. Microbiol. 2006;72:5266–5273. doi: 10.1128/AEM.00530-06. [DOI] [PMC free article] [PubMed] [Google Scholar]
- 29.Newman JRS, Ghaemmaghami S, Ihmels J, Breslow DK, Noble M, DeRisi JL, Weissman JS. Single-cell proteomic analysis of S. cerevisiae reveals the architecture of biological noise. Nature. 2006;441:840–846. doi: 10.1038/nature04785. [DOI] [PubMed] [Google Scholar]
- 30.Qi LL, Haurwitz RER, Shao WW, Doudna JAJ, Arkin APA. RNA processing enables predictable programming of gene expression. Nat. Biotechnol. 2012;30: 1002–1006. doi: 10.1038/nbt.2355. [DOI] [PubMed] [Google Scholar]
- 31.Salis HM, Mirsky EA, Voigt CA. Automated design of synthetic ribosome binding sites to control protein expression. Nat. Biotechnol. 2009;27:946–950. doi: 10.1038/nbt.1568. [DOI] [PMC free article] [PubMed] [Google Scholar]
- 32.Mutalik VK, Guimaraes JC, Cambray G, Lam C, Christoffersen MJ, Mai Q-A, Tran AB, Paull M, Keasling JD, Arkin AP, et al. Precise and reliable gene expression via standard transcription and translation initiation elements. Nat. Methods. 2013;10:354–360. doi: 10.1038/nmeth.2404. [DOI] [PubMed] [Google Scholar]
- 33.Ramon A, Smith HO. Single-step linker-based combinatorial assembly of promoter and gene cassettes for pathway engineering. Biotechnol. Lett. 2011;33:549–555. doi: 10.1007/s10529-010-0455-x. [DOI] [PubMed] [Google Scholar]
- 34.Hoshino T. Violacein and related tryptophan metabolites produced by Chromobacterium violaceum: biosynthetic mechanism and pathway for construction of violacein core. Appl. Microbiol. Biotechnol. 2011;91:1463–1475. doi: 10.1007/s00253-011-3468-z. [DOI] [PubMed] [Google Scholar]
- 35.Balibar CJ, Walsh CT. In vitro biosynthesis of violacein from L-tryptophan by the enzymes VioA-E from Chromobacterium violaceum. Biochemistry. 2006;45:15444–15457. doi: 10.1021/bi061998z. [DOI] [PubMed] [Google Scholar]
- 36.Fox RJ, Davis SC, Mundorff EC, Newman LM, Gavrilovic V, Ma SK, Chung LM, Ching C, Tam S, Muley S, et al. Improving catalytic function by ProSAR-driven enzyme evolution. Nat. Biotechnol. 2007;25:338–344. doi: 10.1038/nbt1286. [DOI] [PubMed] [Google Scholar]
- 37.Li Y, Drummond DA, Sawayama AM, Snow CD, Bloom JD, Arnold FH. A diverse family of thermostable cytochrome P450s created by recombination of stabilizing fragments. Nat. Biotechnol. 2007;25:1051–1056. doi: 10.1038/nbt1333. [DOI] [PubMed] [Google Scholar]
- 38.Lee J. Introduction to Smooth Manifolds. Springer; 2003. [Google Scholar]
Associated Data
This section collects any data citations, data availability statements, or supplementary materials included in this article.