


Abstract
Guanine-rich oligonucleotides (GROs) are promising therapeutic candidate for cancer treatment and other biomedical application. We have introduced a G-quadruplex (G4) ligand, 3,6-bis(1-methyl-4-vinylpyridinium) carbazole diiodide, to monitor the cellular uptake of naked GROs and map their intracellular localizations in living cells by using confocal microscopy. The GROs that form parallel G4 structures, such as PU22, T40214 and AS1411, are detected mainly in the lysosome of CL1-0 lung cancer cells after incubation for 2 h. On the contrary, the GROs that form non-parallel G4 structures, such as human telomeres (HT23) and thrombin binding aptamer (TBA), are rarely detected in the lysosome, but found mainly in the mitochondria. Moreover, the fluorescence resonant energy transfer studies of fluorophore-labeled GROs show that the parallel G4 structures can be retained in CL1-0 cells, whereas the non-parallel G4 structures are likely distorted in CL1-0 cells after cellular uptake. Of interest is that the distorted G4 structure of HT23 from the non-parallel G4 structure can reform to a probable parallel G4 structure induced by a G4 ligand in CL1-0 living cells. These findings are valuable to the design and rationale behind the possible targeted drug delivery to specific cellular organelles using GROs.
INTRODUCTION
A large number of potential guanine-quadruplex-forming sequences are found in the human genome (1–4). The importance of guanine-quadruplex (G4) is not only in protecting the ends of chromosomes for human telomeres but also in regulating gene expression for several gene promoters. It is suggested that the G4 topologies can act as novel therapeutic target (5–8). On the other hand, several lines of evidence show that some guanine-rich oligonucleotides (GROs), such as d[(G2T)4TG(TG2)4] (AS1411) (9), d[G3C]4 (T40214) (10), d[T2AG3]4 (HT24) (11) and d[TG4AG3TG4AG3TG4AAG2] (PU27) (12), could inhibit cancer cell growth and act as anticancer agents. It appears that GRO can be a target for drug design as well as an anticancer agent. Recently, Biffi et al. (13) used G4-specific antibodies linked to a fluorescence tag to quantitatively visualize the G4 structures in cells. Thus, the study of the G4 structure in living cells is essential for exploring their possible biological roles in cellular activity and for developing anticancer agents.
Recently, several groups have used fluorescence images to demonstrate the cellular uptake of fluorophore-labeled (FL) GROs (12,14–16). Although the mechanism of the uptake and cellular trafficking of these GROs still remains unclear, nevertheless, the FL GROs of PU27 (12) and AS1411 (16) can be taken into the living cell without carriers. At present, it is not clear whether these GROs can retain their G4 structures in living cells after cellular uptake. In addition, some G-rich sequences can form various G4 structures. Hurley et al. (17) reported that the PU27 in c-myc gene promoter can form both intramolecular and intermolecular conformations in K+ solution. Dailey et al. (18) reported that AS1411 forms a mixture of monomeric and dimeric G4 structures with several different topologies in K+ solution. Therefore, it is important to explore the cellular response to different types of G4 structures and to determine whether their G4 structures can be retained in living cells. In addition, it is necessary to examine whether the covalently linked dye to the GROs could perturb their G4 structures.
Considering human telomeres, compelling evidence suggested the coexistence of at least two different G4 structures of HT24 in K+ solution (19–23). In addition, telomere sequences with slight differences can adopt different types of G4 structures, such as a hybrid G4 structure of HT23 (24) with three G-quartet layers versus a basket form of HT21-T (25) with two G-quartet layers in K+ solution. Of particular interest is that these telomeric nonparallel G4 structures all convert to the propeller G4 structure on adding 40% v/v polyethylene glycol, which provides a molecular crowding effect to mimic the cellular environment (26). Thus, the possible conversion from the non-parallel G4 structures of human telomeres to the parallel G4 structure deserves more detailed investigation in living cells.
Here we introduce a fluorescence probe, 3,6-bis(1-methyl-4-vinylpyridinium) carbazole diiodide (BMVC), to monitor the cellular response of CL1-0 cancer cells to naked GROs with different G4 structures as well as the localization of these GROs. BMVC was used to verify the presence of G4 structure in the human telomeres of metaphase chromosomes (27,28). Most importantly, free BMVC molecules can be taken into the nucleus of CL1-0 lung cancer cells and show hyperfluorescence on interaction with DNA (29). Using BMVC as a fluorescence probe, we found that the GROs with parallel G4 structures are mainly detected in the lysosome, whereas the GROs with non-parallel G4 structures are mainly accumulated in the mitochondria of CL1-0 living cells. This implies the possible application of using different G4 structures to deliver drugs to specific organelles for therapeutic treatment. In addition, we used FL GROs to further examine cellular uptake of these GROs and to verify whether the G4 structures of these GROs can be retained or converted after cellular uptake in living cells by using fluorescence resonant energy transfer (FRET). The possible change of G4 structure in living cells may be used in exploring the effects of G4 binding proteins. Table 1 lists the G-rich sequences used in this work.
Table 1.
G-rich sequences studied in this work
| Sequence | Abbreviation |
|---|---|
| 5′-TTAG3TTAG3TTAG3TTAG3 | HT24 |
| 5′-TAG3TTAG3TTAG3TTAG3 | HT23 |
| 5′-G3TTAG3TTAG3TTAG3T | HT21-T |
| 5′-G2T2G2TGTG2T2G2 | TBA |
| 5′-TGAG3TG4AG3TG4AA | PU22 |
| 5′-G3CG3CG3CG3C | T40214 |
| 5′-G2TG2TG2TG2TTGTG2TG2TG2TG2 | AS1411 |
| 5′-TGAGTGTGTTGAGTGTGTTGAA | PU22M |
| 5′-UAGGG(UUAGGG)3 | RNA23 |
MATERIALS AND METHODS
Chemical and sample preparation
All GROs and FL GROs were purchased from BIO Basic Inc. (Canada) and used without further purification. Solutions of 10 mM Tris–HCl (pH 7.5) and 150 mM KCl mixed with each GRO were heated to 95°C for 5 min, cooled slowly at 1°C/min to room temperature and then stored overnight at 4°C before use.
Absorption and fluorescence
Absorption spectra were taken on a ultraviolet (UV)-visible spectrophotometer (HELIOS α, Thermo Fisher Scientific, USA), and fluorescence spectra were recorded on a spectrofluorometer (LS-55, PerkinElmer, USA) with a 2-nm band-pass in a 1-cm cell length at room temperature.
Circular dichroism
The circular dichroism (CD) spectra were averaged 10 scans on a J-815 spectropolarimeter (Jasco, Japan), with a 2-nm bandwidth at a 50 nm/min scan speed and a 0.2-nm step resolution. The CD spectra were measured under N2 over the range of 210–350 nm to ascertain the G4 structures.
Polyacrylamime gel electrophoresis
The polyacrylamime gel electrophoresis was conducted using 20% polyacrylamide gels. Electrophoresis of the gels was carried out at 25 mA for 4 h at 4°C. They were then photographed under UV light at 254 nm using a digital camera.
Analytical ultracentrifugation
Sedimentation experiments were performed using a Beckman Optima XLA analytical ultracentrifuge. Sedimentation velocity experiments of 0.5 OD GRO at 260 nm were conducted at 20°C using a rotor speed of 60 000 rpm. Data analysis was carried out with the program Sedfit (21,30).
Cell lines
CL1-0, human lung carcinoma cancer cell, was isolated by Professor P.-C. Yang (31) and was kindly provided by Professor C.-T. Chen of the National Taiwan University. It was grown in Roswell Park Memorial Institute (RPMI)1640 supplemented with 10% fetal bovine serum (FBS). Human cervical adenocarcinoma (HeLa) and human breast cancer (MCF-7) were purchased from American Type Culture Collection and grown in minimum essential medium (MEM) medium supplied with 10% FBS. All cells were grown in an incubator supplemented with 5% CO2 at 37°C.
Confocal microscopy
CL1-0 cells were incubated with a FL GRO for 2 h. Cells were then washed twice with PBS and visualized by confocal microscopy. To determine the cellular localization of FL GRO, cells were subsequently treated with different tracker dyes with the following concentration and incubation time: LysoTracker red DND-99 (Invitrogen, USA) and LysoTracker green DND-26 (Invitrogen) with a final concentration of 50 nM incubated with cells for 30 min; MitoTracker red CMXRos (Invitrogen) and MitoTracker green FM (Invitrogen) with a final concentration of 40 nM incubated with cells for 20 min. The confocal images were taken on Leica TCS SP8 confocal microscopy (Leica, Germany). The excitation wavelength (λEX) and the emission wavelength (λEM) used are described in Table 2.
Table 2.
The excitation wavelength (λEX) and the emission wavelength (λEM) for confocal microscopy used in this work
| Experiments | Channel 1 λEX (nm) | Channel 1 λEM (nm) | Channel 2 λEX (nm) | Channel 2 λEM (nm) | Channel 3 λEX (nm) | Channel 3 λEM (nm) |
|---|---|---|---|---|---|---|
| Cellular response to the naked GROs | 470a | 500–600 (green) | 580b | 600–700 (red) | NA | NA |
| Intracellular localization of Cy5-GROs | 633c | 660–750 (red) | 490d | 520–600 (green) | NA | NA |
| FRET (Cy5-GRO/BMVC or BMVC-8C3O) | 633c | 660–750 (red) | 470e | 500–600 (green) | 470e | 660–750 (red) |
| FRET (Cy5-GRO-Cy3) | 633c | 660–750 (red) | 514f | 540–620 (green) | 514f | 660–750 (red) |
NA, not applicable.
afor BMVC.
bfor LysoTracker or MitoTracker red.
cfor Cy5.
dfor LysoTracker or MitoTracker green.
efor BMVC or BMVC-8C3O.
ffor Cy3.
RESULTS
G-quadruplex structures
Before the study of cellular response to GROs with different G4 structures, we first examined whether BMVC or covalently linked Cy5 dye could change their G4 structures in solutions. Figure 1A shows CD spectra of HT23, TBA, PU22, T40214 and AS1411, their Cy5-labeled GROs at 20 µM and their BMVC/GRO (1:3 molar ratio) complexes in 150 mM K+ solution. The CD spectra of GROs show no discernible difference on adding BMVC and slight change for the Cy5-labeled GROs, implying that the G4 structure of these GROs is not appreciably perturbed by either BMVC or covalently linked Cy5 dye. Although CD spectra cannot give precise structures of the G-quadruplexes, they have been widely used to distinguish parallel type from non-parallel type of G4 structures based on their strand orientation (32–35). The positive CD band at ∼295 nm is characteristic of non-parallel G4 structure, whereas a strong positive band at ∼265 nm together with a negative band at ∼240 nm is attributed to the formation of parallel G4 structure. Thus, we consider that the major conformation is a non-parallel G4 structure for HT23 and TBA, whereas the major conformation is a parallel G4 structure for PU22, T40214 and AS1411.
Figure 1.

(A) CD spectra of HT23, TBA, PU22, T40214 and AS1411, their Cy5-labeled GROs at 20 µM and their BMVC/GRO (6.67 µM/20 µM) complexes in 150 mM K+ solution. (B) UV shadowing of HT23, TBA, PU22, T40214, AS1411 (lanes 1–5) and their Cy5-labeled GROs (lanes 6–10) and their BMVC/GRO complexes (1:1 molar ratio, lanes 11–15) in 150 mM K+ solution (200 pmol per well). (C) Ultracentrifugation of T40214, PU22 and AS1411 in 150 mM K+ solution. (D) Ultracentrifugation of Cy5-T40214, Cy5-PU22 and Cy5-AS1411 in 150 mM K+ solution.
Analysis of gel electrophoresis may allow us to distinguish the possible existence of monomer, dimer and high-order structures. Figure 1B shows the gel assays of HT23, TBA, PU22, T40214, AS1411 (lanes 1–5), their Cy5-labeled GROs (lanes 6–10) and their BMVC/GRO complexes (1:1 molar ratio, lanes 11–15) in 150 mM K+ solution (200 pmole per well). The UV shadowing assays show a major monomeric component in HT23, TBA and PU22, although there are some minor high-order components of PU22. Considering that T40214 (16mers) is smaller than HT23 (23mers), PU22 (22mers) and AS1411 (26mers), the slow gel migration of T40214 suggests that it probably forms dimeric conformation. Of interest is that the gel assays show appreciable difference of the Cy5-PU22, Cy5-T40214 and Cy5-AS1411 from the naked PU22, T40214 and AS1411. Particularly, the migration of Cy5-T40214 is faster than that of T40214. However, the pre-stained gel assays show bright fluorescence with no appreciable shifts for BMVC/HT23 and BMVC/PU22, weak fluorescence with clear migration for BMVC/T40214 and BMVC/AS1411 and a smear with weak fluorescence for BMVC/TBA. The addition of BMVC does not change the T40214 dimer to monomer.
Further sedimentation studies based on ultracentrifugation analysis (21,30) were applied to characterize monomer, dimer and high-order structures of T40214, PU22, AS1411 and their Cy5-labeled GROs in 150 mM K+ solution, as shown in Figure 1C and D, respectively. Sedimentation analysis confirms that the naked T40214 forms a major dimeric conformation in 150 mM K+ solution. Although sedimentation analysis shows some minor high-order components of the naked PU22 and AS1411 in 150 mM K+ solution, the monomeric conformation is the major component of PU22 and AS1411. On the other hand, sedimentation analysis clearly shows that the high-order components of these naked GROs (Figure 1C) are much reduced in Cy5-labeled GROs (Figure 1D). Particularly, the major component of Cy5-T40214 is monomer, instead of the dimeric conformation of the naked T40214. It appears that the covalently linked Cy5 dye could interrupt the formation of intermolecular structures of these GROs.
Considering the structures of these naked GROs, it is known that HT23 forms a hybrid G4 structure in K+ solution (24) and TBA forms a chair antiparallel G4 structure in the presence of K+ (36,37). Although Jing et al. (10) suggested that T40214 forms a chair antiparallel G4 structure, and yet Phan et al. (38) suggested that T40214 forms a dimeric parallel G4 structure in K+ solution. Our gel assays and sedimentation analysis confirm that the naked T40214 forms a dimeric conformation mainly in 150 mM K+ solution (Figure 1). In view of AS1411, size exclusion chromatograph revealed that AS1411 forms at least eight monomeric quadruplex species (18). Two monomeric conformations comprising either two stacks of parallel quartets or two stacks of antiparallel quartets linked by TTGT were proposed for the G4 topologies of AS1411 (18). The positive 265-nm CD band suggests that the parallel G4 structure is likely the major component of AS1411. As for PU22, Miller et al. (12) suggested that the parallel G4 structure is a major conformation for PU27, a longer sequence similar to that of PU22. Indeed, NMR and CD results showed that the monomeric parallel G4 structure is a major conformation for both PU22 and PU27 (39). In addition, our previous study on G4 structural separation also showed that the major conformation of PU22 is a parallel G4 structure (40). Accordingly, Scheme 1 shows the major component of the most probable G4 structures for these GROs.
Scheme 1.
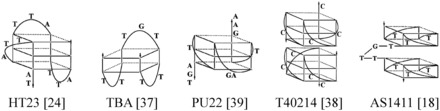
The most probable G4 structures.
Considering Cy5-labeled GROs, our gel assays and sedimentation analysis show that the Cy5-PU22, Cy5-T40214 and Cy5-AS1411 favor the formation of monomeric G4 structures. Particularly, the covalent link of Cy5 to T40214 can severely perturb the stacking of two naked T40214 GROs. In addition, the gel assays show the change from three bands in the naked AS1411 to a major band in the Cy5-AS1411, implying that the labeling dye could also perturb the monomeric G4 structures. Furthermore, their CD spectra show no appreciable difference, implying that the parallel G4 structures are the major conformation for these Cy5-labeled GROs.
Cellular response to the naked GROs
To visualize whether these different GROs can be taken into living cells, BMVC has been used in monitoring cellular uptake of these GROs. This is because BMVC shows weak fluorescence in buffer solution, but strong fluorescence on interaction with these GROs, as shown in Figure 2A. The chemical structure of BMVC is shown in the inset. The ∼435-nm absorption peak of the free BMVC is shifted to ∼460 nm on interaction with T40214 and further to ∼470 nm on interaction with HT23, TBA, PU22 and AS1411. Of importance is that the fluorescence intensity of BMVC is increased by more than an order of magnitude on interaction with T40214 and about two orders of magnitude on interaction with HT23, TBA, PU22 and AS1411. It is suggested that these spectral differences are due to different binding modes of BMVC to various G4 structures.
Figure 2.

(A) Absorption and fluorescence of 10 μM BMVC and its complexes with 30 μM each of HT23, TBA, PU22, T40214 and AS1411 in 150 mM K+ solution. The inset shows the chemical structure of BMVC. (B) Fluorescence titration of 1 μM BMVC by adding HT23, TBA and T40214 from 0.05 to 1.5 μM in 150 mM K+ solution. The inset shows the binding plots of γ versus CF from the titration experiment. (C) Confocal images of 5 µM BMVC and its complexes with 15 µM of HT23, TBA, PU22, T40214 and AS1411 incubated with CL1-0 cancer cells for 2 h (left), and then stained by LysoTracker red (middle) together with their merges (right).
As the two major components of AS1411 and the three major components of PU22 shown in the pre-stained gel assays (Figure 1B) could complicate the measurement of binding affinity of BMVC to these GROs, fluorescence titration was carried out to measure the binding affinities of BMVC to HT23, TBA and T40214. Figure 2B shows the fluorescence spectra of 1 µM of BMVC by adding DNA from 0.05 to 1.5 µM. The fluorescence intensity used to construct the binding plots of γ versus Cf is shown in the inset. Binding parameters can be obtained by fitting the plots with using a multiple-equivalent-site model, which can be found elsewhere (23,41). Here, the calculated binding parameters are K ∼ 1.4 × 10⁷ with n ∼ 1.6 for HT23, K ∼ 6.4 × 10⁶ with n ∼ 1.3 for TBA and K ∼ 9.1 × 10⁶ with n ∼ 0.8 for T40214. It appears that fluorescence intensity is not directly related to the binding affinity. However, the difference of affinity may account for the difference in gel assays.
We then used confocal microscopy to monitor cellular uptake of different G4 structures with BMVC as a probe. Figure 2C (left column) shows the confocal images of 5 µM BMVC and its complexes with 15 µM of HT23, TBA, PU22, T40214 and AS1411 incubated with CL1-0 cancer cells for 2 h. The BMVC fluorescence is clearly detected in both nucleus and cytoplasm of CL1-0 cells on incubation with free BMVC molecules. However, the BMVC fluorescence is rarely detected in the nucleus but found in the cytoplasm of CL1-0 cells after adding these BMVC/GRO (5 μM/15 μM) complexes. This finding is important because one would expect to observe BMVC fluorescence in the nucleus of CL1-0 cells, if the BMVC molecule could easily dissociate from the GRO. Of particular interest is that a small bright area of the BMVC fluorescence is observed in the cytoplasm of CL1-0 cells after adding the BMVC/PU22, BMVC/T40214 or BMVC/AS1411 complexes. However, this bright area is not detected after adding BMVC/HT23 and BMVC/TBA complexes in CL1-0 cells.
We then added LysoTracker red to determine the intracellular localization of BMVC/GRO complexes in the CL1-0 cells (Figure 2C, central column). The images show no appreciable fluorescence merge between the LysoTracker red and the BMVC from either free BMVC or BMVC/HT23 and BMVC/TBA complexes (Figure 2C, right column), implying that the lysosome is unlikely the location for these complexes in CL1-0 living cells. Similar results are also found for BMVC/HT24 and BMVC/HT21-T (data not shown). In contrast, the LysoTracker red fluorescence merges well with the BMVC fluorescence from BMVC/PU22, BMVC/T40214 and BMVC/AS1411 complexes (Figure 2C, right column), suggesting that these complexes localize mainly in the lysosome of CL1-0 living cells.
To further examine whether these naked GROs also show similar intracellular localizations in CL1-0 cells, Figure 3 shows the confocal images of each naked HT23, TBA, PU22, T40214 and AS1411 at 15 μM incubated with CL1-0 cells for 2 h and then washed twice before adding 5 μM BMVC for 1 h. The images show that BMVC distributes in both the nucleus and the cytoplasm of CL1-0 cells. The BMVC fluorescence detected in the nucleus of CL1-0 cells is due to the free BMVC. We further added LysoTracker red to monitor the intracellular localization of these naked GROs. It is found that the BMVC fluorescence also merges well with the LysoTracker red in CL1-0 living cells for the pre-incubated cases of PU22, T40214 and AS1411, indicating that these naked GROs can also be trapped in the lysosome. The absence of the BMVC fluorescence in lysosome for the pre-incubated cases of HT23 and TBA is also consistent with our previous results of BMVC/HT23 and BMVC/TBA complexes, suggesting that these naked GROs are not trapped in the lysosome of CL1-0 cells. Considering that the parallel G4 structures are the major component of PU22, T40214 and AS1411, and the non-parallel G4 structures are the major component of HT23, TBA, HT24 and HT21-T, the imaging results suggest that the GROs with parallel G4 structures are detected mainly in the lysosome, whereas the GROs with non-parallel G4 structures are rarely found in the lysosome of CL1-0 living cells after 2 h treatment.
Figure 3.

Confocal images of 15 μM each naked HT23, TBA, PU22, T40214 and AS1411 incubated with CL1-0 cancer cells for 2 h and then washed twice before adding 5 μM BMVC for 1 h (left). Samples stained by LysoTracker red (middle) together with their merges (right).
In addition, we added MitoTracker red to monitor the localization of BMVC/HT23 and BMVC/TBA complexes in CL1-0 living cells. The confocal images show that the MitoTracker red fluorescence merges well with the BMVC fluorescence from either free BMVC or BMVC/HT23 and BMVC/TBA complexes (Supplementary Figure S1), implying that the mitochondria are likely the location for these complexes in CL1-0 living cells. In addition, the BMVC fluorescence from the lysosomal escape of BMVC/PU22, BMVC/T40214 and BMVC/AS1411 in the cytoplasm also merges with the MitoTracker red fluorescence. As the mitochondria are also the location of free BMVC, the FL GROs are used to verify whether the mitochondria are the major localization of these complexes.
Intracellular localization of Cy5-GROs
We now examine the cellular response to the Cy5-labeled GROs in CL1-0 living cells. Figure 4 shows the confocal images of CL1-0 cells incubated with each Cy5-HT23, Cy5-TBA, Cy5-PU22, Cy5-T40214 and Cy5-AS1411 for 2 h and then stained by MitoTracker green. The images show that the Cy5-labeled GROs are rarely detected in the nucleus of CL1-0 cells after treatment for 2 h. Instead, the Cy5-labeled GROs can be taken to the cytoplasm of CL1-0 cells, which is consistent with the previous finding of large amounts of FITC-PU27 localized in the cytoplasm of U937 leukemia cells after 1 h treatment (12). Thus, it further confirms that the BMVC fluorescence detected in the nucleus of CL1-0 cells (Figure 3) is mainly due to the free BMVC on interaction with DNA/RNA in the nucleus, instead of the BMVC/GRO complexes. Our results show that the Cy5 fluorescence from both Cy5-HT23 and Cy5-TBA merges well with the MitoTracker green, suggesting that both Cy5-labeled GROs mainly localize in the mitochondria of CL1-0 living cells. Furthermore, the fluorescence of MitoTracker green also merges well with the Cy5 fluorescence from the minor component of the lysosomal escape of Cy5-PU22, Cy5-T40214 and Cy5-AS1411, implying that the mitochondria is also the target for the lysosomal escape of these Cy5-GROs complexes in CL1-0 living cells.
Figure 4.
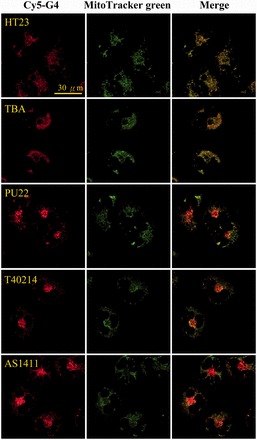
Confocal images of 15 μM each Cy5-HT23, Cy5-TBA, Cy5-PU22, Cy5-T40214 and Cy5-AS1411 incubated with CL1-0 cancer cells for 2 h (left), and then stained by MitoTracker green (middle) together with their merges (right).
Using LysoTracker green, the images show that Cy5-PU22, Cy5-T40214 and Cy5-AS1411 are detected mainly in the lysosome of CL1-0 living cells, even though the monomeric G4 structures of Cy5-T40214 is different from the dimeric G4 structures of T40214. Furthermore, Cy5-HT23 and Cy5-TBA are rarely observed in the lysosome (Supplementary Figure S2). This finding is consistent with the previous results of the naked GROs. Our results suggest that cellular uptake of the Cy5-GROs with the parallel G4 structures is detected mainly in the lysosome, whereas cellular uptake of the Cy5-GROs with the non-parallel G4 structures is found mainly in the mitochondria of CL1-0 living cells.
G4 structures examined by FRET
The next question is to elucidate whether these GROs could retain their G4 structures after cellular uptake. As FRET is sensitive to the distance between donor and acceptor, we now apply FRET to verify whether the G4 structures of Cy5-HT23 and Cy5-PU22 could retain their G4 structures after cellular uptake. Here the labeled dye Cy5 serves as a FRET acceptor, whereas BMVC acts as a FRET donor when it binds to the G4 structure. Figure 5A shows the fluorescence spectra of BMVC/GRO and BMVC/Cy5-GRO complexes in K+ solution. The disappearance of the ∼560 nm band together with the appearance of the ∼670 nm band in BMVC/Cy5-GRO complexes is due to FRET from BMVC to Cy5 on excitation of BMVC. After 2 h incubation of BMVC/Cy5-GRO complexes with CL1-0 cells, confocal images clearly show the uptake of Cy5-HT23 and Cy5-PU22 together with BMVC in the cytoplasm of CL1-0 cells, as shown in Figure 5B. Of importance is that the FRET signal from BMVC to Cy5-PU22 is clearly detected in the lysosome of CL1-0 cells, implying that the Cy5-PU22 can retain its parallel G4 structure after cellular uptake. In contrast, the FRET signal from BMVC to Cy5-HT23 is not observed in CL1-0 living cells. As there is no appreciable BMVC fluorescence observed in the nucleus, it is likely that the non-parallel G4 structure of Cy5-HT23 is distorted after cellular uptake.
Figure 5.
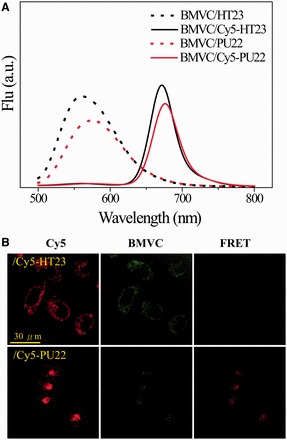
(A) Fluorescence spectra of FRET from 0.33 μM BMVC to 1 μM Cy5-GRO in K+ solution. (B) Confocal images of 15 μM each Cy5-HT23 and Cy5-PU22 together with 5 μM BMVC in CL1-0 cancer cells after 2 h treatment, where the excitation wavelength (λEX) is 633 nm for Cy5 and the emission (λEM) collected at 660–750 nm from Cy5 (left), the λEX is 458 nm for BMVC and the λEM collected at 500–600 nm from BMVC (middle), and the λEX is 458 nm for BMVC and the λEM collected at 660–750 nm from Cy5 (right).
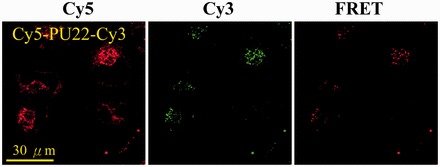
In addition, FRET studies of Cy5-HT23-Cy3 and Cy5-PU22-Cy3 are further conducted to examine whether they could retain their G4 structures after cellular uptake in CL1-0 living cells. Here the labeled dye 3′-Cy3 acts as a FRET donor, whereas the labeled dye 5′-Cy5 serves as a FRET acceptor. Figure 6A shows the fluorescence spectra of HT23-Cy3 and PU22-Cy3 at 25°C together with Cy5-HT23-Cy3 and Cy5-PU22-Cy3 at 25°C and 90°C as well as the spectra of Cy5-PU22 and PU22-Cy3 mixture in K+ solution. The dramatic decrease of the ∼570 nm band together with the appearance of the ∼670 nm band in the Cy5-GRO-Cy3 is due to FRET from Cy3 to Cy5 on excitation of Cy3. On the other hand, the FRET signal significantly decreases when the G4 structure is unfolded at 90°C. After 2 h incubation of Cy5-GRO-Cy3 with CL1-0 living cells, the images show appreciable FRET signals from Cy5-PU22-Cy3 in the lysosome, but no discernible FRET signals from Cy5-HT23-Cy3 in CL1-0 living cells, as shown in Figure 6B. In addition, there is no FRET signal after 2 h incubation of the same amounts of Cy5-PU22 and PU22-Cy3 with CL1-0 cells, although both of them appear mainly in lysosome also shown in Figure 6B. These findings suggest that the non-parallel G4 structure of Cy5-HT23-Cy3 is distorted after cellular uptake, whereas the Cy5-PU22-Cy3 can retain its parallel G4 structure after cellular uptake. The FRET signal of Cy5-PU22-Cy3 can be detected even after treatment for 24 h (Supplementary Figure S3A). We further mutated the GGG and GGGG sequences of PU22 by GTG and GTTG named PU22M for disrupting the G4 structure. As a result, we cannot detect FRET signal of Cy5-PU22M-Cy3 (Supplementary Figure S3B).
Figure 6.
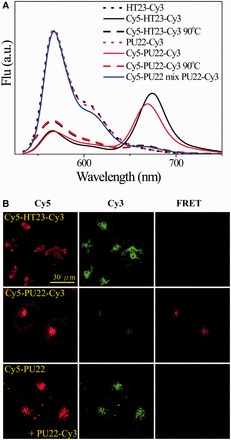
(A) Fluorescence spectra of 1 μM each HT23-Cy3 and PU22-Cy3 at 25°C together with Cy5-HT23-Cy3 and Cy5-PU22-Cy3 at 25°C and 90°C as well as the spectra of Cy5-PU22 and PU22-Cy3 mixture in K+ solution. (B) Confocal images of 5 μM each Cy5-HT23-Cy3, Cy5-PU22-Cy3 and mixture of Cy5-PU22/PU22-Cy3 in CL1-0 cancer cells after 2 h treatment, where the λEX is 633 nm for Cy5 and the λEM collected at 660–750 nm from Cy5 (left), the λEX is 514 nm for Cy3 and the λEM collected at 540–620 nm from Cy3 (middle), and the λEX is 514 nm for Cy3 and the λEM collected at 660–750 nm from Cy5 (right).
To further examine whether the Cy5-PU22-Cy3 can retain its G4 structure after release from lysosome, we used L-leucyl-L-Leucine methyl ester (LeuLeuOMe) (42), a lysosomotropic agent that can perturb lysosomal membrane permeability, resulting in release of Cy5-PU22-Cy3 from lysosome to cytoplasm. After 0.5 mM LeuLeuOMe treatment for 2 h, the FRET signal of Cy5-PU22-Cy3 is clearly observed in the cytoplasm of CL1-0 cells, as shown in Figure 7. This finding confirms that the Cy5-PU22-Cy3 accumulates mainly in the lysosomal compartment in CL1-0 living cells and can retain its parallel G4 structure after cellular uptake and lysosomal escape.
Figure 7.
Confocal images of 5 μM Cy5-PU22-Cy3 incubated with CL1-0 cancer cells for 2 h, and then treat by 0.5 mM LeuLeuOMe for 2 h. The λEX is 633 nm for Cy5 and the λEM collected at 660–750 nm from Cy5 (left), the λEX is 514 nm for Cy3 and the λEM collected at 540–620 nm from Cy3 (middle), and the λEX is 514 nm for Cy3 and the λEM collected at 660–750 nm from Cy5 (right).
Structural conversion of HT23 in living cells
Recently, Heddi and Phan (26) reported that the four different non-parallel G4 structures of human telomeres are all converted to a parallel G4 structure under polyethylene glycol condition. Accordingly, we have modified BMVC molecule by substituting a tetraethylene glycol in the N-9 position with a methyl-piperidinium cation to produce a new G4 stabilizer, BMVC-8C3O. This hybrid ligand with the ethylene glycol unit can induce structural change from various non-parallel G4 structures to a parallel G4 structure after annealing or at 37°C for a day (43). Moreover, BMVC-8C3O can increase the melting temperature (Tm) from ∼70°C (non-parallel G4 structure, I) of HT23 to ∼115°C (parallel G4 structure, II) of HT23/BMVC-8C3O in 150 mM K+ solution. As the efficiency of structural conversion is dependent on the concentration of BMVC-8C3O, Figure 8A shows differential scanning calorimetry (DSC) thermograms of HT23 in 150 mM K+ solution without and with adding 1 and 3 eq. BMVC-8C3O after annealing. The DSC results clearly show that 1 eq. BMVC-8C3O is sufficient to convert certain amounts of non-parallel G4 structure to parallel G4 structure. Figure 8B shows the confocal images of CL1-0 cells incubated with BMVC-8C3O/HT23 with 1:1 molar ratio complexes before (non-parallel G4 structure, I) and after annealing (parallel G4 structure, II) for 2 h and then stained by LysoTracker red. The imaging results also show that the parallel one is trapped in the lysosome, whereas the non-parallel one accumulates in the mitochondria of CL1-0 living cells. It further confirms that the lysosomal retention of the GROs can be used to differentiate parallel G4 structures from non-parallel G4 structures. The free BMVC-8C3O fluorescence can be detected in both nucleus and cytoplasm of CL1-0 cells (45); however, the fluorescence detected in the nucleus of CL1-0 cells is due to the free BMVC-8C3O because higher concentration of BMVC-8C3O (three times of BMVC) is used for structural conversion.
Figure 8.
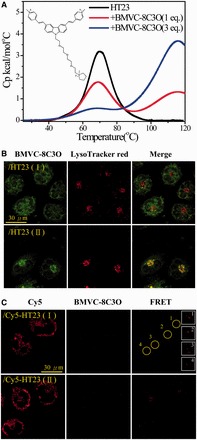
(A) DSC thermograms of HT23 in 150 mM K+ solution without and with adding 1 and 3 eq. BMVC-8C3O after annealing. The inset shows the chemical structure of BMVC-8C3O. (B) Confocal images of CL1-0 cancer cells incubated with 15/15 μM HT23/BMVC-8C3O complexes before (non-parallel G4 structure, Ⅰ) and after annealing (parallel G4 structure, Ⅱ) for 2 h (left) and then stained by LysoTracker red (middle) together with their merged images (right). (C) Confocal images of CL1-0 cancer cells incubated with 10/10 μM Cy5-HT23/BMVC-8C3O complexes before (non-parallel G4 structure, Ⅰ) and after annealing (parallel G4 structure, Ⅱ) for 2 h and then washed twice before adding fresh medium for 24 h. The λEX is 633 nm for Cy5 and the λEM collected at 660–750 nm from Cy5 (left), whereas the λEX is 470 nm for BMVC-8C3O and the λEM collected at 500–600 nm from BMVC-8C3O (middle), and finally the λEX is 470 nm for BMVC-8C3O and the λEM collected at 660–750 nm from Cy5 (right). The weak FRET signals (yellow circle) are highlighted in the insets (white box).
The absence of FRET from Cy5-HT23-Cy3 after cellular uptake indicates that the non-parallel G4 structure of HT23 does not convert to the parallel G4 structure under cellular (crowding) condition even after treatment for 24 h (Supplementary Figure S3). It is of interest in examining whether BMVC-8C3O can convert the non-parallel G4 structure of HT23 to the parallel G4 structure within CL1-0 living cells. Figure 8C shows the confocal images of CL1-0 cells incubated with BMVC-8C3O/Cy5-HT23 complexes before (non-parallel G4 structure, I) and after annealing (parallel G4 structure, II) for 24 h. Again, the FRET signal from BMVC-8C3O to Cy5-HT23 for the parallel one is also observed in CL1-0 cells, indicating that the parallel G4 structure can be retained after cellular uptake. Of importance is that we observed a slight FRET signal of BMVC-8C3O to Cy5-HT23 for the non-parallel one in CL1-0 living cells (22/67 cells) after treatment for 24 h. This implies that the distorted G4 structure of HT23 from the non-parallel G4 structure is possible to reform to a parallel G4 structure induced by BMVC-8C3O in CL1-0 living cells.
Is intracellular localization dependent on the melting temperature of GROs?
As the Tm is ∼70°C for non-parallel G4 structure of HT23 and ∼115°C for parallel G4 structure of HT23/BMVC-8C3O in 150 mM K+ solution, is it possible that the more stable G4 structure is retained and trapped in the lysosome of living cells? Generally, the higher the Tm, the more stable the G4 structure. Thus, we have measured the Tm of these GROs based on CD melting curves. Figure 9A shows the melting curves of HT23, TBA, PU22, T40214 and AS1411 in 150 mM K+ solution. Although the CD melting curves did not give the precise Tm of PU22 and T40214, the Tm > 85°C for these GROs is much higher than the Tm ∼ 67°C for HT23 and ∼53°C for TBA in 150 mM K+ solution. These results are consistent with the previous measurements of the Tm ∼ 65°C for HT24 and >85°C for c-myc18 (PU18) in 150 mM K+ solution (44). The slight difference in Tm of HT23 obtained from CD melting and DSC is probably due to different experimental conditions. However, the Tm ∼ 69°C for AS1411 is similar to the Tm ∼ 67°C for HT23.
Figure 9.

(A) The melting curves of HT23 and TBA monitored at 295 nm as well as the melting curves of PU22, T40214 and AS1411 monitored at 265 nm in 150 mM K+ solution. (B) The melting curves of 15 µM HT23, AS1411 and their complexes with 5 µM BMVC in 5 mM K+ solution. (C) Confocal images of 5/15 µM BMVC/AS1411 complexes in 5 mM K+ solution incubated with CL1-0 cancer cells for 2 h (left), and then stained by either LysoTracker red and MitoTracker red (middle) together with their merges (right).
It is known that the addition of K+ can not only induce G4 structure but also stabilize G4 structure (44,46–49). Figure 9B shows the melting curves of 15 µM HT23, AS1411 and their complexes with 5 µM BMVC in 5 mM K+ solution. It is found that the 0.33 eq. BMVC increases the Tm slightly. The Tm is ∼45°C for AS1411 and ∼46°C for AS1411/BMVC (3:1) complexes, which is much lower than the Tm of HT23/BMVC in 150 mM K+ solution. Under 5 mM K+ solution condition, the confocal images also show bright fluorescence of BMVC in the lysosome together with some moderate fluorescence in the mitochondria (Figure 9C). It suggests that the intracellular localization of GROs is not dependent of Tm but their G4 structures.
DISCUSSION
This study presents new findings on the intracellular localizations of different G4 structures, which are either retained in or escaped from lysosome in CL1-0 living cells by confocal images. PU22, T40214 and AS1411 were chosen for this study because they have been used as anticancer agents to inhibit cancer cell growth (9,10,12). The reason for using HT23 and TBA is because their G4 structures have been determined (24,37) and are different from the previous three. We use small molecule, BMVC, to directly monitor naked GROs after cellular uptake, and further confirmed by covalent dye-labeled strategy. As flanking group may result in conformational change, the method of BMVC with naked GROs provides a more original way for monitoring the cellular localization of GROs. The major finding is that the GROs with parallel G4 structures, such as PU22, T40214 and AS1411, are detected mainly in the lysosome with some minor components in the mitochondria. In addition, Martadinata and Phan (50) reported that human telomeric RNA sequences also form parallel G4 structure. A preliminary study of RNA23 G4 in CL1-0 living cells also shows identical results, i.e. the major component of RNA23 in the lysosome with some minor components in the mitochondria (Supplementary Figure S4). This is different from the non-parallel G4 structure of HT23, which is detected rarely in the lysosome but observed mainly in the mitochondria of living cells. Considering the important finding of telomeric RNA expression in mammalian cells (51,52), the telomeric RNA may play an important role in telomere biology. The detailed investigations of RNA quadruplex deserve further study.
In addition, the FRET studies show that the parallel G4 structures can be retained in CL1-0 living cells, whereas the non-parallel G4 structures are likely to be distorted in CL1-0 living cells after cellular uptake. The exact structures of those GROs escaped from lysosome are not clear at present. It could be perturbed, unfolded and even degraded as lysosomes are the major organelle for intracellular degradation of endogenous and exogenous macromolecules. In addition, the intracellular localization is unlikely dependent on the Tm of GRO, implying that the cellular content might play an important role in regulating the cellular localization of different G4 structures. Nevertheless, it deserves further study in elucidating why the parallel G4 structures are trapped in the lysosome and the non-parallel G4 structures accumulate in the mitochondria of CL1-0 living cells. It turns out that different G4 structures can be used to probe lysosomal biology, which could affect other cellular processes that impact transfection.
It is known that the success of DNA transfection has to overcome four potential berriers: cellular uptake, endosomal escape, lysosomal degradation and nuclear entry. Jing et al. (10) found that the single strand of T40214 penetrated poorly into cells. They used polyethyleneimine (PEI) to effectively deliver T40214 into the cytoplasm and nucleus of cancer cells and found that PEI increases the drug activity of T40214 appreciably in cancer cells. Jing et al. further proposed that the single strand of T40214 is released from PEI-GRO complexes, it forms intramolecular G4 structures in the cytoplasm because of the presence of 140 mM K+ inside cells and then diffuses freely through pores into the nucleus. After T40214 enters the nucleus, it targets signal transducer and activator of transcription 3 (Stat3) and exhibits antiproliferative activities (53). Here, our results show that the G4 structures of T40214 without vector can be taken into cells and trapped mainly in the lysosome with minor component in the mitochondria, but not in the nucleus of cancer cells. This finding is different from their model. Thus, it is suggested that PEI plays a crucial role not only in the cellular uptake of T40214 but also to the entry of T40214 into the nucleus. As the G4 structures alone are not easy to enter the nucleus, using a vector such as PEI (54) may afford an efficient delivery of GROs into the nucleus for cancer treatment (10). Better understanding of cellular trafficking and localization of different G4s is useful to optimize the design of GROs for cancer treatment.
Bates et al. discovered that AS1411 is an antiproliferative GRO (9) and is currently being tested as an anticancer agent in phase II clinical trials (55). They suggested that the effects of AS1411 stem from its binding to a subset of nucleolin complexes and thereby interfering with certain functions of nucleolin. Nucleolin, a nucleolar phosphoprotein, is a multifunctional protein, which plays an essential role in cell proliferation (56,57). Particularly, nucleolin is expressed at the cell surface in cancer cells more than in normal cells and can act as a shuttling protein between cell membranes, cytoplasm and nucleus. However, Bates et al. found (16) that FL AS1411 is detected in the cytoplasm but not observed in the nuclear region of DU145 cancer cells even after treatment for >2 days. They further reported that macropinocytosis is the major mechanism for uptake of AS1411 in DU145 prostate cancer cells, and nucleolin is not required for initial uptake of AS1411. In contrast to the finding of the cellular localization of AS1411 in the cytoplasm, Miller et al. (12) analyzed their images under fixed condition and found 52% PU27 colocalized in the nucleus of U937 leukemia cells after treatment for 24 h. In our work, both AS1411 and PU22 are not detected in the nucleus of CL1-0 living cells after treatment for 24 h. The difference of cellular localizations between PU27 and AS1411 or PU22 may be due to experimental conditions. Of interest is that PU27 also binds to nucleolin (12,58). They further showed that PU27 inhibits c-myc expression and disrupts mitochondrial membrane potential resulting in suppression of ATP synthesis and ROS formation. Here we do observe some PU22 localized in the mitochondria. Is it possible that PU27 initiates early disruption of mitochondria resulting in mitochondrial dysfunction and induces cell death eventually? More detailed studies are required to examine the role of nucleolin and compare the mechanisms of AS1411 and PU27 for their anticancer activity.
In addition, the observation of weak FRET signals due to refolding of the HT23 in BMVC-8C3O/Cy5-HT23 complexes is important. It implies that the GROs are likely resistant to nuclease degradation (10,12). Moreover, the distorted G4 structure of HT23 from the non-parallel G4 structure is possible to reform to a parallel G4 structure induced by a G4 ligand in living cells. As some G4 structures are recognized by their specific G4 binding proteins, the change of the G4 structure may be used to explore the effects on G4 binding proteins.
Furthermore, free BMVC molecule is found both in the nucleus and mitochondria, whereas BMVC/GRO complexes are found mainly in either mitochondria or lysosome after cellular uptake in CL1-0 living cells. It is suggested that GROs can act as a carrier to manipulate drug delivery to specific organelle. To test whether this is valid for most of cancer cells, we have also examined the cellular localization of BMVC/GRO complexes in MCF-7 breast cancer cells and HeLa cervical cancer cells (Supplementary Figure S5). Similar results obtained for these two other cancer cells suggest cellular localization of GROs studied herein is not cell type-dependent. This finding enhances our ability to rationally design new novel approaches to cancer treatment, particularly with mitochondria as a major target for cancer treatment. The multiple roles of GROs as a target for drug design, an anticancer agent, and a carrier for drug delivery clearly indicate the importance of GROs and further demonstrate the necessity of additional studies to understand these multifarious properties of GROs.
SUPPLEMENTARY DATA
Supplementary Data are available at NAR Online.
FUNDING
Academia Sinica [AS-102-TP-A07]; National Science Council of the Republic of China [Grant NSC-101-2113-M001-022]. Funding for open access charge: Academia Sinica.
Conflict of interest statement. None declared.
Supplementary Material
ACKNOWLEDGEMENTS
The authors thank Prof. Sunney Chan (Academia Sinica) and Margaret Hsin-Jui Kuo (Academia Sinica) for their invaluable discussion.
REFERENCES
- 1.Todd AK, Johnston M, Neidle S. Highly prevalent putative quadruplex sequence motufs in human DNA. Nucleic Acids Res. 2005;33:2901–2907. doi: 10.1093/nar/gki553. [DOI] [PMC free article] [PubMed] [Google Scholar]
- 2.Huppert JL, Balasubramanian S. Prevalence of quadruplexes in the human genome. Nucleic Acids Res. 2005;33:2908–2916. doi: 10.1093/nar/gki609. [DOI] [PMC free article] [PubMed] [Google Scholar]
- 3.Eddy J, Maizels N. Gene function correlates with potential for G4 DNA formation in the human genome. Nucleic Acids Res. 2006;34:3887–3896. doi: 10.1093/nar/gkl529. [DOI] [PMC free article] [PubMed] [Google Scholar]
- 4.Qin Y, Hurley LH. Structures, folding patterns, and functions of intramolecular DNA G-quadruplexes found in eukaryotic promoter regions. Biochimie. 2008;90:1149–1171. doi: 10.1016/j.biochi.2008.02.020. [DOI] [PMC free article] [PubMed] [Google Scholar]
- 5.Balasubramanian S, Neidle S. G-quadruplex nucleic acids as therapeutic targets. Curr. Opin. Chem. Biol. 2009;13:345–353. doi: 10.1016/j.cbpa.2009.04.637. [DOI] [PMC free article] [PubMed] [Google Scholar]
- 6.Xu Y. Chemistry in human telomere biology: structure, function and targeting of telomere DNA/RNA. Chem. Soc. Rev. 2011;40:2719–2740. doi: 10.1039/c0cs00134a. [DOI] [PubMed] [Google Scholar]
- 7.Patel DJ, Phan AT, Kuryavyi V. Human telomere, oncogenic promoter and 5′-UTR G-quadruplexes: diverse higher order DNA and RNA targets for cancer therapeutics. Nucleic Acids Res. 2007;35:7429–7455. doi: 10.1093/nar/gkm711. [DOI] [PMC free article] [PubMed] [Google Scholar]
- 8.Rodriguez R, Miller KM, Forment JV, Bradshaw CR, Nikan M, Britton S, Oelschlaegel T, Xhemalce B, Balasubramanian S, Jackson SP. Small-molecule–induced DNA damage identifies alternative DNA structures in human genes. Nat. Chem. Biol. 2012;8:301–310. doi: 10.1038/nchembio.780. [DOI] [PMC free article] [PubMed] [Google Scholar]
- 9.Bates PJ, Kahlon JB, Thomas SD, Trent JO, Miller DM. Antiproliferative activity of G-rich oligonucleotides correlates with protein binding. J. Biol. Chem. 1999;274:26369–26377. doi: 10.1074/jbc.274.37.26369. [DOI] [PubMed] [Google Scholar]
- 10.Jing N, Li Y, Xiong W, Sha W, Jing L, Tweardy DJ. G-quartet oligonucleotides: A new class of signal transducer and activator of transcription 3 inhibitors that suppresses growth of prostate and breast tumors through induction of apoptosis. Cancer Res. 2004;64:6603–6609. doi: 10.1158/0008-5472.CAN-03-4041. [DOI] [PubMed] [Google Scholar]
- 11.Qi H, Lin CP, Fu X, Wood LM, Liu AA, Tsai YC, Chen Y, Barbieri CM, Pilch DS, Liu LF. G-quadruplexes induces apoptosis in tumor cells. Cancer Res. 2006;66:11808–11816. doi: 10.1158/0008-5472.CAN-06-1225. [DOI] [PubMed] [Google Scholar]
- 12.Sedoris KC, Thomas SD, Clarkson CR, Muench D, Islam A, Singh R, Miller DM. Genomic c-Myc quadruplex DNA selectively kills leukemia. Mol. Cancer Ther. 2012;11:66–76. doi: 10.1158/1535-7163.MCT-11-0515. [DOI] [PMC free article] [PubMed] [Google Scholar]
- 13.Biffi G, Tannahill D, McCafferty J, Balasubramanian S. Quantitative visualization of DNA G-quadruplex structures in human cells. Nat. Chem. 2013;5:182–186. doi: 10.1038/nchem.1548. [DOI] [PMC free article] [PubMed] [Google Scholar]
- 14.Wittrup A, Sandgren S, Lilja J, Bratt C, Gustavsson N, Morgelin M, Belting M. Identification of proteins released by mammalian cells that mediate DNA internalization through proteoglycan-dependent macropinocytosis. J. Biol. Chem. 2007;282:27897–27904. doi: 10.1074/jbc.M701611200. [DOI] [PubMed] [Google Scholar]
- 15.Fumoto S, Nishi J, Ishii H, Wang X, Miyamoto H, Yoshikawa N, Nakashima M, Nakamura J, Nishida K. Rac-mediated macropinocytosis is a critical route for naked plasmid DNA transfer in mice. Mol. Pharm. 2009;6:1170–1179. doi: 10.1021/mp900042p. [DOI] [PubMed] [Google Scholar]
- 16.Reyes-Reyes EM, Teng Y, Bates PJ. A new paradigm for aptamer therapeutic AS1411 action: uptake by macropinocytosis and its stimulation by a nucleolin-dependent mechanism. Cancer Res. 2010;70:8617–8629. doi: 10.1158/0008-5472.CAN-10-0920. [DOI] [PMC free article] [PubMed] [Google Scholar]
- 17.Siddiqui-Jain A, Grand CL, Bearss DL, Hurley LH. Direct evidence for a G-quadruplex in a promoter region and its targeting with a small molecule to repress c-MYC transcription. Proc. Natl Acad. Sci. USA. 2002;99:11593–11598. doi: 10.1073/pnas.182256799. [DOI] [PMC free article] [PubMed] [Google Scholar]
- 18.Dailey MM, Miller MC, Bates PJ, Lane AN, Trent JO. Resolution and characterization of the structural polymorphism of a single quadruplex-forming sequence. Nucleic Acids Res. 2010;38:4877–4888. doi: 10.1093/nar/gkq166. [DOI] [PMC free article] [PubMed] [Google Scholar]
- 19.Ambrus A, Chen D, Dai J, Bialis T, Jones RA, Yang D. Human telomeric sequence forms a hybrid-type intramolecular G-quadruplex structure with mixed parallel/antiparallel strands in potassium solution. Nucleic Acids Res. 2006;34:2723–2735. doi: 10.1093/nar/gkl348. [DOI] [PMC free article] [PubMed] [Google Scholar]
- 20.Rujan IN, Meleney JC, Bolton PH. Vertebrate telomere repeat DNAs favor external loop propeller quadruplex structures in the presence of high concentrations of potassium. Nucleic Acids Res. 2005;33:2022–2031. doi: 10.1093/nar/gki345. [DOI] [PMC free article] [PubMed] [Google Scholar]
- 21.Li J, Correia JJ, Wang L, Trent JO, Chaires JB. Not so crystal clear: the structure of the human telomere G-quadruplex in solution differs from that present in a crystal. Nucleic Acids Res. 2005;33:4649–4659. doi: 10.1093/nar/gki782. [DOI] [PMC free article] [PubMed] [Google Scholar]
- 22.Redon S, Bombard S, Elizondo-Riojas MA, Chottard JC. Platinum cross-linking of adenines and guanines on the quadruplex structure of the AG3(T2AG3)3 and (T2AG3)4 human telomere structure in Na+ and K+ solutions. Nucleic Acids Res. 2003;31:1605–1613. doi: 10.1093/nar/gkg259. [DOI] [PMC free article] [PubMed] [Google Scholar]
- 23.Chang CC, Chien CW, Lin YH, Kang CC, Chang TC. Investigation of spectral conversion of d(TTAGGG)4 and d(TTAGGG)13 upon potassium titration by a G-quadruplex recognizer BMVC molecule. Nucleic Acids Res. 2007;35:2846–2860. doi: 10.1093/nar/gkm155. [DOI] [PMC free article] [PubMed] [Google Scholar]
- 24.Luu KN, Phan AT, Kuryavyi V, Lacroix L, Patel DJ. Structure of the human telomere in K+ solution: an intramolecular (3 + 1) G-quadruplex scaffold. J. Am. Chem. Soc. 2006;128:9963–9970. doi: 10.1021/ja062791w. [DOI] [PMC free article] [PubMed] [Google Scholar]
- 25.Lim KW, Amrane S, Bouaziz S, Xu W, Mu Y, Patel DJ, Luu KN, Phan AT. Structure of the human telomere in K+ solution: a stable basket-type G-quadruplex with only two G-tetrad layers. J. Am. Chem. Soc. 2009;131:4301–4309. doi: 10.1021/ja807503g. [DOI] [PMC free article] [PubMed] [Google Scholar]
- 26.Heddi B, Phan AT. Structure of human telomeric DNA in crowded solution. J. Am. Chem. Soc. 2011;133:9824–9833. doi: 10.1021/ja200786q. [DOI] [PubMed] [Google Scholar]
- 27.Chang CC, Kuo IC, Ling IF, Chen CT, Chen HC, Lou PJ, Lin JJ, Chang TC. Detection of quadruplex DNA structures in human telomeres by a fluorescent carbazole derivative. Anal. Chem. 2004;76:4490–4494. doi: 10.1021/ac049510s. [DOI] [PubMed] [Google Scholar]
- 28.Chang CC, Chu JF, Kao FJ, Chiu YC, Lou PJ, Chen HC, Chang TC. Verification of anti-parallel G-quadruplex structure in human telomeres by using two photon-excitation fluorescence lifetime imaging microscopy of the 3,6-bis(1-methyl-4-vinylpyridinium)carbazole diiodide molecule. Anal. Chem. 2006;78:2810–2815. doi: 10.1021/ac052218f. [DOI] [PubMed] [Google Scholar]
- 29.Kang CC, Chang CC, Chang TC, Liao LJ, Lou PJ, Xie W, Yeung ES. A handheld device for potential point-of-care screening of cancer. Analyst. 2007;132:745–749. doi: 10.1039/b617733f. [DOI] [PubMed] [Google Scholar]
- 30.Stafford WF, Sherwood PJ. Analysis of heterologous interacting systems by sedimentation velocity: curve fitting algorithms for estimation of sedimentation coefficients, equilibrium and kinetic constants. Biophys. Chem. 2004;108:231–243. doi: 10.1016/j.bpc.2003.10.028. [DOI] [PubMed] [Google Scholar]
- 31.Yang PC, Luh KT, Wu R, Wu CW. Characterization of the mucin differentiation in human lung adenocarcinoma cell lines. Am. J. Respir. Cell Mol. Biol. 1992;7:161–171. doi: 10.1165/ajrcmb/7.2.161. [DOI] [PubMed] [Google Scholar]
- 32.Balagurumoorthy P, Brahmachari SK, Mohanty D, Bansal M, Sasisekharan V. Hairpin and parallel quartet structures for telomeric sequences. Nucleic Acids Res. 1992;20:4061–4067. doi: 10.1093/nar/20.15.4061. [DOI] [PMC free article] [PubMed] [Google Scholar]
- 33.Gray DM, Wen JD, Gray CW, Repges R, Repges C, Raabe G, Fleischhauer J. Measured and calculated CD spectra of G-quartets stacked with the same or opposite polarities. Chirality. 2008;20:431–440. doi: 10.1002/chir.20455. [DOI] [PubMed] [Google Scholar]
- 34.Kypr J, Kejnovska I, Renciuk D, Vorlickova M. Circular dichroism and conformational polymorphism of DNA. Nucleic Acids Res. 2009;37:1713–1725. doi: 10.1093/nar/gkp026. [DOI] [PMC free article] [PubMed] [Google Scholar]
- 35.Masiero S, Trotta R, Pieraccini S, De Tito S, Perone R, Randazzo A, Spada GP. A non-empirical chromophoric interpretation of CD spectra of DNA G-quadruplex structures. Org. Biomol. Chem. 2010;8:2683–2692. doi: 10.1039/c003428b. [DOI] [PubMed] [Google Scholar]
- 36.Bock LC, Griffin LC, Latham JA, Vermaas EH, Toole JJ. Selection of single-stranded DNA molecules that bind and inhibit human thrombin. Nature. 1992;355:564–566. doi: 10.1038/355564a0. [DOI] [PubMed] [Google Scholar]
- 37.Macaya RF, Schultze P, Smith FW, Roe JA, Feigon J. Thrombin-binding DNA aptamer forms a unimolecular quadruplex structure in solution. Proc Natl Acad. Sci USA. 1993;90:3745–3749. doi: 10.1073/pnas.90.8.3745. [DOI] [PMC free article] [PubMed] [Google Scholar]
- 38.Do NQ, Lim KW, Teo MH, Heddi B, Phan AT. Stacking of G-quadruplexes: NMR structure of a G-rich oligonucleotides with potential anti-HIV and anticancer activity. Nucleic Acids Res. 2011;39:9448–9457. doi: 10.1093/nar/gkr539. [DOI] [PMC free article] [PubMed] [Google Scholar]
- 39.Phan AT, Modi YS, Patel DJ. Propeller-type parallel-stranded G-quadruplexes in the human c-myc promoter. J. Am. Chem. Soc. 2004;126:8710–8716. doi: 10.1021/ja048805k. [DOI] [PMC free article] [PubMed] [Google Scholar]
- 40.Tsai YL, Wang ZF, Chen WW, Chang TC. Emulsified BMVC derivative induced filtration for G-quadruplex DNA structural separation. Nucleic Acids Res. 2011;39:e114. doi: 10.1093/nar/gkr499. [DOI] [PMC free article] [PubMed] [Google Scholar]
- 41.Chaires JB. Analysis and interpretation of ligand-DNA binding isotherms. Methods Enzymol. 2001;340:3–22. doi: 10.1016/s0076-6879(01)40415-0. [DOI] [PubMed] [Google Scholar]
- 42.Uchimoto T, Nohara H, Kamehara R, Iwamura M, Watanabe N, Kobayashi Y. Mechanism of apoptosis induced by a lysosomotropic agent, L-Leucyl-L-Leucine methyl ester. Apoptosis. 1999;4:357–362. doi: 10.1023/a:1009695221038. [DOI] [PubMed] [Google Scholar]
- 43.Wang ZF, Chang TC. Molecular engineering of G-quadruplex ligands based on solvent effect of polyethylene glycol. Nucleic Acids Res. 2012;40:8711–8720. doi: 10.1093/nar/gks578. [DOI] [PMC free article] [PubMed] [Google Scholar]
- 44.Lin CT, Tseng TY, Wang ZF, Chang TC. Structural conversion of intramolecular and intermolecular G-quadruplexes of bcl2mid: the effect of potassium concentration and ion exchange. J. Phys. Chem. B. 2011;115:2360–2370. doi: 10.1021/jp107623n. [DOI] [PubMed] [Google Scholar]
- 45.Kang CC, Huang WC, Kouh CW, Wang ZF, Cho CC, Chang CC, Wang CL, Chang TC, Seemann J, Huang LJ. Chemical principles for the design of a novel fluorescent probe with high cancer-targeting selectivity and sensitivity. Integr. Biol. 2013;5:1217–1228. doi: 10.1039/c3ib40058a. [DOI] [PMC free article] [PubMed] [Google Scholar]
- 46.Scaria PV, Shire SJ, Shafer RH. Quadruplex structure of d(G3T4G3) stabilized by K+ or Na+ is an asymmetric hairpin dimer. Proc. Natl Acad. Sci. USA. 1992;89:10336–10340. doi: 10.1073/pnas.89.21.10336. [DOI] [PMC free article] [PubMed] [Google Scholar]
- 47.Rachwal PA, Brown T, Fox KR. Sequence effects of single base loops in intramolecular quadruplex DNA. FEBS Lett. 2007;581:1657–1660. doi: 10.1016/j.febslet.2007.03.040. [DOI] [PubMed] [Google Scholar]
- 48.Smargiasso N, Rosu F, Hsia W, Colson P, Baker ES, Bowers MT, De Pauw E, Gabelica V. G-quadruplex DNA assemblies: Loop length, cation identity, and multimer formation. J. Am. Chem. Soc. 2008;130:10208–10216. doi: 10.1021/ja801535e. [DOI] [PubMed] [Google Scholar]
- 49.Bugaut A, Balasubramanian S. A sequence-independent study of the influence of short loop lengths on the stability and topology of intramolecular DNA G-quadruplexes. Biochemistry. 2008;47:689–697. doi: 10.1021/bi701873c. [DOI] [PMC free article] [PubMed] [Google Scholar]
- 50.Martadinata H, Phan AT. Structure of Propeller-Type Parallel-Stranded RNA G-Quadruplexes, Formed by Human Telomeric RNA Sequences in K+ Solution. J. Am. Chem. Soc. 2009;131:2570–2578. doi: 10.1021/ja806592z. [DOI] [PubMed] [Google Scholar]
- 51.Azzalin CM, Reichenbach P, Khoriauli L, Giulotto E, Lingner J. Telomeric repeat containing RNA and RNA surveillance factors at mammalian chromosome ends. Science. 2007;318:798–801. doi: 10.1126/science.1147182. [DOI] [PubMed] [Google Scholar]
- 52.Schoeftner S, Blasco MA. Developmentally regulated transcription of mammalian telomeres by DNA-dependent RNA polymerase II. Nat. Cell Biol. 2008;10:228–236. doi: 10.1038/ncb1685. [DOI] [PubMed] [Google Scholar]
- 53.Jing N, Xiong W, Guan Y, Pallansch L, Wang S. Potassium-dependent folding: A key to intracellular delivery of G-quartet oligonucleotides as HIV inhibitors. Biochemistry. 2002;41:5397–5403. doi: 10.1021/bi0120401. [DOI] [PubMed] [Google Scholar]
- 54.Boussif O, Lezoualc’h F, Zanta MA, Mergny MD, Scherman D, Demeneix B, Behr JP. A versatile vector for gene and oligonucleotide transfer into cells in culture and in vivo: polyethylenimine. Proc. Natl Acad. Sci. USA. 1995;92:7297–7301. doi: 10.1073/pnas.92.16.7297. [DOI] [PMC free article] [PubMed] [Google Scholar]
- 55.Bates PJ, Laber DA, Miller DM, Thomas SD, Trent JO. Discovery and development of the G-rich oligonucleotide AS1411 as a novel treatment for cancer. Exp. Mol. Pathol. 2009;86:151–164. doi: 10.1016/j.yexmp.2009.01.004. [DOI] [PMC free article] [PubMed] [Google Scholar]
- 56.Lapetre B, Bourbon H, Amalric F. Nucleolin, the major nucleolar protein of growing eukaryotic cells: An unusual protein structure revealed by the nucleotide sequence. Proc. Natl Acad. Sci. USA. 1987;84:1472–1476. doi: 10.1073/pnas.84.6.1472. [DOI] [PMC free article] [PubMed] [Google Scholar]
- 57.Srivastava M, Pollard HB. Molecular dissection of nucleolin’s role in growth and cell proliferation: New insights. FASEB J. 1999;13:1911–1922. [PubMed] [Google Scholar]
- 58.Gonzalez V, Guo K, Hurley L, Sun D. Identification and characterization of nucleolin as a c-myc G-quadruplex-binding protein. J. Biol. Chem. 2009;284:23622–23635. doi: 10.1074/jbc.M109.018028. [DOI] [PMC free article] [PubMed] [Google Scholar]
Associated Data
This section collects any data citations, data availability statements, or supplementary materials included in this article.