


Abstract
DNA Topoisomerase I (Top1) is required to relax DNA supercoils generated by RNA polymerases (RNAPs). Top1 is inhibited with high specificity by camptothecin (CPT), an effective anticancer agent, and by oxidative base damage and ribonucleotides in DNA strands, resulting into Top1-DNA cleavage complexes (Top1ccs). To understand how Top1ccs affect genome stability, we have investigated the global transcriptional response to CPT-induced Top1ccs. Top1ccs trigger an accumulation of antisense RNAPII transcripts specifically at active divergent CpG-island promoters in a replication-independent and Top1-dependent manner. As CPT increases antisense transcript levels in the presence of 5,6-dichloro-1-beta-D-ribofuranosylbenzimidazole, a transcription inhibitor, Top1ccs likely impair antisense RNA degradation. Time-course data showed a burst of Top1ccs increased by CPT at promoter sites and along transcribed regions, causing a transient block of RNAPII at the promoter. Moreover, cell immunofluorescence analyses showed that Top1ccs induce a transient increase of R-loops specifically at highly transcribed regions such as nucleoli in a Top1-dependent manner. Thus, a specific and highly dynamic transcriptional response to Top1ccs occurs at divergent active CpG-island promoters, which may include a transient stabilization of R-loops. The results clarify molecular features of a response pathway leading to transcription-dependent genome instability and altered transcription regulation.
INTRODUCTION
Transcription by RNA polymerase II (RNAPII) is controlled by a regulated interplay of DNA transactions and factors controlling cell identity. The complexity of transcription regulation is increased by the recent knowledge that divergent transcription is a common feature of gene promoters in several organisms, generating short and long (>200 bp) non-coding RNAs (1–6). Moreover, DNA conformation and superhelicity can affect transcription and transcription regulation (1–6). On one hand, negative and positive supercoils of DNA template can impair transcription in living cells (4,6), whereas on the other, DNA supercoiling has a basic function in transcription regulation in prokaryotes (2) and during development and pathological states of eukaryotic cells (1,3,7). Interestingly, negatively supercoiled DNA can form non-B structures, such as R-loops, that can impact transcription-associated recombination and mutation, Ig gene class-switch recombination and transcription regulation (8–11).
DNA topoisomerase I (Top1) modulates DNA supercoiling during fundamental DNA metabolic pathways (12) and is the highly specific target of camptothecins (CPT), highly effective agents against human cancers (13,14). Moreover, drug therapeutic potential has recently been broadened, as CPT derivatives can unsilence the silent allele of Ube3a in a mouse model of human Angelman syndrome (15), suggesting a significant impact of Top1 inhibitors on neurological disorders. Top1 can remove DNA supercoils by cleaving a strand of a DNA duplex and forming a transient DNA-Top1 cleavage complex (Top1cc) in which the cut strand is covalently linked to the protein. Then, Top1 allows the rotation of the cut strand around the intact one and eventually reseals the strand break (16,17). CPT interacts at the cleavage site with DNA and the enzyme impeding the break resealing reaction and stabilizing Top1ccs (18). Top1ccs are highly reversible both in vitro and in living cells, and CPT analogs act to increase significantly their half-life (2 min on average) resulting in a decrease of the DNA uncoiling rate by the enzyme (19). In living cells, CPT action results in an immediate increase of Top1-mediated DNA breaks, and inhibition of Top1 activity, transcription and replication (17,19–21). The latter drug effect is likely due to collisions of Top1ccs with advancing replication forks that can result into frank DNA double-stranded breaks. The replicative DNA breakage eventually triggers cell cycle arrest and apoptosis of cancer cells (17,21). However, the molecular bases of Top1cc interference with transcription regulation and induction of genome instability are not fully clarified (13).
According to the ‘twin-supercoiling domain model’, RNAP elongation can lead to local accumulation of positive supercoils ahead of the RNAP and negative supercoils behind (5,21). The bulk of cellular Top1 activity is present at transcribing regions, where its activity can be redundant with Top2, as both enzymes can relax either positive and negative supercoils (5). However, different solutions for supercoil removal and specialized roles of each enzyme can be operative in cells as indicated by findings in yeast where Top2 is mainly responsible for positive supercoil removal in front of RNAPs and Top1 removes negative supercoils behind the polymerase (22,23). Early works provided evidence that Top1 also functions at the transcription initiation step (24–26). Top1 is likely an enzyme that can more rapidly respond to local torsional tension in nucleosome-free regions (4,27), a molecular environment common to promoter regions where Top1 has been mapped (22,28). In addition, Top1 has a role in chromatin organization and remodeling, as the disassembly/assembly of nucleosomes is thought to be another main source of DNA supercoiling (29). Top1 has been shown to affect chromatin organization at yeast telomeric regions (30) and active promoters (22,28,31).
In recent years, we showed that CPT-stabilized Top1ccs lead to hyperphosphorylation of RNAPII and decreased recruitment at human HIF-1α, cMyc and GAPDH gene promoters (28,32). Unexpectedly, we found that Top1ccs favor RNAPII escape from promoter-proximal pausing sites and increase the levels of antisense transcripts at the 5′- and 3′-ends of the human HIF1α gene (31). The two antisense RNAs overlap with the primary sense transcript of the HIF-1α gene. Even though their functions are not fully known, we showed that the 5′ antisense HIF-1α RNA, corresponding to the first exon region, localizes mainly at the nuclear membrane close to the nuclear pore protein Nup62 suggesting a role in the transport and post-transcriptional regulation of mRNAs (33). Antisense transcripts accumulate for a 4-h period at the human HIF-1α locus, suggesting that Top1ccs can cause a specific transcriptional stress at active promoters. Nevertheless, the nature and generality of increased antisense transcripts at gene 5′-ends were left unresolved.
Here, we investigated the molecular response to Top1ccs at human gene promoters by next-generation sequencing of cellular transcripts. We show that CPT-stabilized Top1ccs cause the accumulation of antisense RNAPII transcripts specifically at divergent CpG-island (CGI) promoters, mainly upstream of the transcriptional start site (TSS), in a replication-independent and Top1-dependent manner. In addition, Top1cc levels increase transiently at active promoters during CPT treatment, and parallel a transient RNAPII block and increase of R-loops in living cells. The findings highlight molecular events at specific active promoters that can trigger transcription-associated recombination and transcription-associated mutation and set the basis to understand the functions of antisense transcripts in gene regulation and genome instability.
MATERIALS AND METHODS
Cell lines
The cancer cell lines HCT116, PC3, U2OS and COLO205 were purchased from ATCC (LGC Standards S.r.l., Milan, Italy) and were grown in Dulbecco’s modified Eagle’s medium (HCT116) or RPMI (PC3, U2OS and COLO205) mediums with 10% fetal bovine serum (M-Medical S.r.l., Milan, Italy). HCT116-shRNATop1 cell line was gently provided by Y. Pommier (NCI, Bethesda, MD, USA) and was grown as HCT116 cells but in presence of 200 μg/ml Hygromycin B. The cell line stably expresses a short hairpin RNA targeting exon 17 in the TOP1 gene (34,35). Cells were maintained at 37°C in a humidified incubator containing 20% O2 and 5% CO2. Cell line identity was certified with Cell ID System (Promega) by BMR Genomics Srl (Padova, Italy).
Cell treatment and RNA extraction
Exponentially growing cells were exposed to 10 μM of CPT, Topotecan (TPT), Etoposide or carboxylate forms of CPT, for 4 h at 37°C, unless specified otherwise. In case of co-treatment, cells were incubated with aphidicolin (5 μM) or 5,6-dichloro-1-beta-D-ribofuranosylbenzimidazole (DRB) (50 μM) for 15 min, then CPT (10 μM) was added to the medium for further 4 h. For CDK9 silencing experiments, cells were transfected 24 h after plating (30% confluence) with RNAiMax Transfection reagent (Life Technologies) and 20 nM of scramble siRNA or CDK9 siRNA (Life Technologies) and exposed to drugs 72 h post-transfection. For transient Top1 silencing experiments, cells were transfected in the same way using 60 nM of scramble siRNA or Top1 siRNA (targeting exon 16 of the TOP1 gene; Life Technologies) and exposed to drugs 72 h post-transfection. Total cellular RNA was purified with the acid phenol method (33), quantified by ultraviolet absorbance and quality controlled by electrophoresis.
RNA bisulfite conversion and sequencing
RNA bisulfite treatment was performed according with He et al. (36), with minor modifications (Supplementary Information). RNA was converted to cDNA using random octamers and Superscript III Reverse Transcriptase (Life Technologies). Libraries were prepared from cDNA with mRNA-Seq Sample Prep Kit (Illumina) following Illumina’s standard protocols. RNA sequencing was performed on Illumina HiSeq2000 platform (pair-end 2 X100 bp, flowcell v3, two samples for each lane) at IGA Technology Services S.r.l. (Udine, Italy). The RNA-Seq data have been submitted to the SRA database (http://www.ncbi.nlm.nih.gov/sra) with identifier PRJNA186590.
Bioinformatics analysis
Two independent RNA-seq experiments for each cell line were performed with similar results, and here, we report the results of analyses of the pooled data. Low-quality sequenced bases were filtered out using DynamicTrim v.1.12 (37), which trims the reads to leave only the longest contiguous segment that surpasses the quality threshold (P = 0.05). The bisulfite-treated paired reads were then mapped twice to the GRCh37 human genome assembly in which all the cytosines were mutated in thymines (in the following named as CT-GRCh37) or all the guanine in adenine (GA-GRCh37) to identify the strand originating the sequence fragment. Sequences coming from positive strand transcripts align to the CT-GRCh37, whereas negative strand trascripts align to the GA-GRCh37. The read alignment was carried out with Bowtie v0.12.7 (38) and TopHat v1.4.1 (39) to identify known transcripts. For each of the four experiments, reads that aligned to both CT-GRCh37 and GA-GRCh37 were discarded. Cufflinks was used to assemble and identify novel transcripts, using reference genomes in which all the RefSeq genes in the + or − strands were alternatively masked. Gene expression levels were estimated in FPKM units (expected number of Fragments Per Kilobase of transcript sequence per Millions of sequenced nucleotides) using Cufflinks (40), and differential transcript expression between control and CPT-treated samples was then computed using Cuffdiff.
Plots of the RNA fragments distributions with respect to the TSS (both sense and antisense) were calculated on a subset of 9665 not overlapping RefSeq genes, composed by 6626 and 3039 genes with and without CpG islands, respectively, in the region −4000/+1000 bp as respect to the TSS. Cumulative plots were normalized for total aligned tags and number of genes in the respective class. The number of reads in the −4000/+1000 bp region for each not overlapping RefSeq gene is reported as box-plot of the difference between control and CPT-treated cells (in the following Δ antisense reads and Δ sense reads).
A single sample Wilcoxon signed rank test was used to estimate the central tendency of the Δ sense and Δ antisense reads groups (pseudo-median) with a 95% confidence interval (41). Moreover, two sample comparisons were performed using Wilcoxon rank sum tests to evaluate if couples of Δ antisense or Δ sense reads distributions were statistically different, one versus the other.
K+SDS precipitation assay
The K+SDS Precipitation protocol was described already (30). Briefly, cells were lysed with 1% SDS and DNA sonicated (Bioruptor®, Diagenode) to an average fragment size of 200–300 bp. Proteins were then precipitated with 2.5 M KCl at 4°C and centrifugation at 1200g for 3 min. Pellets were washed five times with 0.25 M KCl, and then treated with Proteinase K. DNA was purified by phenol-extraction and ethanol precipitation and quantified by real-time PCR.
ChIP assay
ChIP protocol was as previously described (28) with some modifications (see Supplementary Information).
ICE assay
ICE assay was performed as previously reported (42) with minor modifications (see Supplementary Information).
Immunofluorescence
HCT116 and HCT116-siRNATop1 cells were seeded at low density and treated with 10 μM CPT 24 h after seeding. Cells were fixed and permeabilized in pure ice-cold methanol and incubated with standard protocols first with primary antibody (S9.6 antibody gently furnished by F. Chedin - University of California, Davis), and finally with secondary antibody for signal detection (Anti-mouse Ig, fluorescein linked whole antibody from sheep, Amersham Biosciences). Images acquisition by Nikon Ti-E microscopy equipped with A1R confocal system. Fluorescence quantitation analysis has been performed using ImageJ software with the following formula: Corrected Total Cell Fluorescence = Integrated Density—(Area of selected cell X Mean Fluorescence of Background Readings).
RESULTS
Top1ccs increase antisense sequence tags at active CGI promoters in human cells
To establish the genome-wide effects of CPT-stabilized Top1ccs at promoters, we mapped RNA-seq paired tags following 4-h CPT (10 μM) treatment of human colon cancer HCT116 cells. We also performed RNA-seq experiments in HCT116-shRNATop1 cells that have Top1 contents reduced to ∼25% of wild-type cell levels (31,34) to directly determine the role of Top1. Paired tags were obtained from total cellular RNA depleted of ribosomal RNAs and treated with bisulfite to maintain the information of strand direction (Supplementary Data, ‘Materials and Methods’ section). A total of 2.18–2.89 × 10⁷ high-quality paired tags mapped uniquely to the human genome, with 43.4–45.0% of them mapping to the minus strand (Supplementary Table SI). Although a large portion of reads (43.8–49.3%) mapped to genomic regions without gene annotations both in control and treated cells (Supplementary Table SI), we have here focused on reads and transcripts mapping at gene promoters. First, we evaluated mRNA expression patterns altered by CPT, and determined 1054 and 15 Refseq transcripts with statistically significant variations (>2-fold) in HCT116 and HCT116-shRNATop1 cells, respectively. The fraction of downregulated genes was higher than upregulated genes (69 against 31% in HCT116 cells). The results of Gene Set Enrichment analyses of CPT-altered genes with DAVID Bioinformatics Resources (43,44) were highly consistent with CPT mode of action (Supplementary Figure S1 and Supplementary Data Set 1) and previous findings (34,45), thus showing that we can readily measure significant variations in transcript levels.
As CPT-stabilized Top1ccs affected the overall ratio of sense/antisense tags (Supplementary Table SI), we then evaluated whether the balance of sense and antisense transcripts was changed at specific gene regions. By analyzing tag distributions along annotated Refseq genes, we found evidence that the number of antisense tags was specifically and markedly increased by Top1ccs in a region immediately upstream of TSS and in a manner dependent on gene expression levels (Supplementary Figure S2A). Sense tags showed some changes at the 5′- and 3′-gene regions while decreasing somewhat in the body of genes (Supplementary Figure S2A). As an increase of antisense reads upstream of TSS could be due to a modification of expression of an overlapping gene in a divergent orientation, we then determined antisense tag distributions at non-overlapping Refseq gene promoters and their dependence on promoter features, such as the presence of a CGI or its activity measured as FPKM of sense (mRNA) transcripts. The average number of antisense tags was increased up to 4000 bp upstream of TSS, with a peak at 450 bp from TSS, in active (0.3–100 FPKM) promoters containing CpG islands (Figure 1A). Top1 silencing significantly reduced CPT effects as antisense tags increased less in HCT116-shRNATop1 (Figure 1B), demonstrating that effects on antisense transcripts are strictly related to Top1 inhibition. Box-plot analyses show that antisense tag increase was specific for CGI promoters, as no increase was detected at CGI-less promoters (Figure 1C and Supplementary Figure S2C). Antisense tags were not increased at inactive CGI promoters (0.0–0.3 FPKM; Figure 1D and Supplementary Figure S2B) and at active promoters (>100 FPKM; Figure 1E and F, and Supplementary Figure S2B), indicating that CPT effects were restricted to CGI promoters of intermediate activity. As expected, sense tags show a peak downstream of TSS with slight changes by CPT in HCT116 cells (Figure 1A and Supplementary Figure S2), even though CPT increased sense tags in Top1-silenced cells (Figure 1B). No differences were found between protein-coding and non-protein-coding Refseq genes. Taken together, the data demonstrate that, even though CPT is a potent transcription inhibitor, it can markedly and specifically enhance the number of antisense sequence tags at human active CGI promoters.
Figure 1.

Antisense sequence tags are increased by CPT at active CGI promoters in a Top1-dependent manner. (A) Tag distributions along non-overlapping Refseq genes of HCT116 cells were analyzed in a region from 4000 bases upstream to 1000 bases downstream the TSS (dotted line and arrow). Control and CPT-treated cells are in dotted and straight line, respectively. Sense and antisense tags are above and below the x-axis, respectively. (B) Tag distributions in HCT116-shRNATop1 cells, in which Top1 content is reduced to about the 25% of wt levels. (C) Box-plots representing the variation of antisense sequence tags after CPT treatment in the indicated cell lines. Non-overlapping Refseq genes were split in two groups: genes with a CGI promoter (CGI, light gray), and genes without a CGI at the promoter (No-CGI, gray). (D) Box-plots representing the variation of antisense sequence tags after CPT treatment in HCT116 cells. Non-overlapping Refseq genes with a CGI promoter were split in two groups with the indicated level of gene expression (FPKM). (E) Plot of variation of antisense sequence tags after CPT treatment as a function of log(FPKM) in HCT116 cells, non-overlapping Refseq genes with CGI promoters. Vertical gray lines represent 0.3 and 100 FPKM value, respectively, from left to right. Gray dots are higher than the threshold: module (300). Genes with FPKM = 0 are not reported in the graph. All excluded genes had antisense variation below the threshold. (F) The same as in Panel (E), HCT116-shRNATop1 cells. Two sample comparisons using Wilcoxon rank sum tests indicate that all groups are statistically different, one versus the other (HCT116 CGI versus no CGI, P = 2.4e-119; HCT-shRNATop1 CGI versus no CGI, P = 8.6e-148; HCT116 CGI FPKM < 0.3 versus ≥0.3, P = 3.9e-115).
Top1cc-enhanced antisense transcripts are found at divergent active CGI promoters
Next, to identify Top1cc-increased transcripts upstream to TSSs, we used the Cufflink package with stringent parameters to reduce false-positive instances, even though that may have reduced the number of true transcripts. We determined unknown (not annotated) tag clusters and their genome location relative to the closest annotated Refseq gene and found 8964 clusters long <5000 nt in HCT116 cells, 809 of which were altered by Top1ccs (Supplementary Table SII). In all, 2464 tag clusters were located within 5000 bases from a Refseq gene, the majority (1328) of which were promoter-associated antisense transcripts consistently with antisense transcription being a significant process at human promoters (46,47). Of the 809 clusters altered by Top1ccs, a significant fraction (43.5%) was found within 5000 bp to a Refseq gene (Supplementary Table SII), suggesting that transcribed regions constitute a main target of CPT effects. Moreover, CPT-increased antisense tag clusters at promoters were the highest fraction (19.5%) of all CPT-altered clusters (Figure 2A and Supplementary Table SII). The analysis in HCT116-shRNATop1 cells showed similar general patterns but again CPT effects were less marked (Figure 2A and Supplementary Table SII).
Figure 2.

CPT induces increased levels of unknown tag clusters mainly at CGI promoters of genes in a Top1-dependent manner. (A) Pie charts representing the effect of CPT on unknown clusters at promoters of the indicated cell lines. Tag clusters were long <5000 nucleotides, with no annotation at the corresponding genomic region and localized from the TSS to 5000 bases upstream. Light gray, black and grey show unknown clusters that were increased, decreased and unchanged by CPT, respectively. (B) Common promoter-associated antisense transcripts (33) between HCT116 and HCT116-shRNATop1 cells. (C) Antisense transcripts were determined upstream the TSS of selected genes by rtPCR in the indicated cell lines. The selected genes showed CPT-increased tag clusters as determined with RNA-seq data, with the exception of TNIK gene that had an antisense transcript reduced by CPT. (D) Antisense transcripts were evaluated by rtPCR in HCT116 after transient silencing of Top1 protein (black bars). In (C) and (D), PCR determinations were normalized to cytochrome b mRNA and to untreated cells (dotted line). Values are means +/− SEM of at least four determinations of two independent experiments. Genomic coordinates of analyzed antisense transcripts are reported in Supplementary Data Set. Primers are reported in Supplementary Table SV. (E) Correlation between expression levels in CPT-treated and control cells of the genes with CPT-increased promoter-associated antisense transcripts in HCT116 (256) and HCT116-shRNATop1 (84) cell lines.
At promoter and terminator gene regions, CPT-stabilized Top1ccs generally increased tag clusters, with a significantly major effect on promoter-associated antisense clusters (Figure 2A and Table 1). In particular, we identified 256 antisense clusters increased by Top1ccs in HCT116 cells, and almost all of them localized at CGI promoters (Table 1 and Supplementary Table SIII and Supplementary Data Set 2). Silencing of Top1 again decreased the CPT effect as we could detect fewer clusters (84) increased by Top1ccs at CGI promoters of HCT116-shRNATop1 cells (Figure 2A and Table 1 and Supplementary Data Set 3). A large majority of them are located up to 1500 bp upstream of TSS (Supplementary Figure S3), and 33 are in common between the two cell lines (Figure 2B). Their median size was larger in HCT116 than HCT116-shRNATop1 cells (853 versus 688, Supplementary Table SIV and Supplementary Figure S3), consistent with the observed antisense tag distributions upstream of TSS (Figure 1A and B). To determine whether the antisense transcript increase had an effect on sense transcription at the same promoter, we analyzed the expression levels of Refseq genes having increased antisense transcripts. These genes were expressed at moderate to high levels (from 0.2 to 100 FPKM), and their expression levels were on average unchanged after 4 h of CPT treatment (Figures 1E and 2E). Thus, in the studied time frame, the levels of antisense transcripts do not correlate with levels of sense RNAs.
Table 1.
Antisense transcripts are altered by CPT at CGI promoters of Refseq genes
| CPT effect | Gene promoters |
Gene terminators |
||||||
|---|---|---|---|---|---|---|---|---|
| Antisense transcripts |
Sense transcripts |
Antisense transcripts |
Sense transcripts |
|||||
| HCT116 | HCT116- shRNATop1 | HCT116 | HCT116- shRNATop1 | HCT116 | HCT116- shRNATop1 | HCT116 | HCT116- shRNATop1 | |
| Increased | 256a | 84a | 30 | 17 | 14 | 21 | 41 | 51 |
| Decreased | 3b | 1b | 5 | 3 | 1 | 0 | 4 | 3 |
a248 out of the 256 (HCT116) and 80 out of the 84 (HCT116-shRNATop1) increased antisense transcripts at promoters are found at CGI promoters.
bAntisense transcripts decreased by CPT (4 in total) are found at CGI promoters.
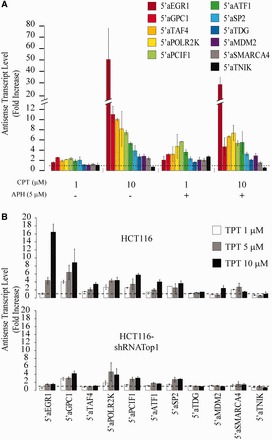
Then, we confirmed RNA-seq results by randomly selecting 10 antisense transcripts increased by CPT at promoters and measuring their levels by rtPCR (Figure 2C). First, we confirmed the presence of these antisense transcripts and their CPT-dependent increase by primer-specific retrotranscription (Supplementary Figure S4). Then, we measured their fold-increases after CPT treatment demonstrating a good agreement with genomic sequencing analyses (Figure 2C). As a control, we also included one antisense transcript (5′ aTNIK) that was decreased by CPT based on RNA-seq data (not shown). As expected, CPT effects were dose dependent in HCT116 cells (Figure 2C). Antisense transcript increase was much lower in Top1-silenced cells showing a dependence on cellular Top1 levels (Figure 2C). However, Top1 silencing by itself did not change significantly antisense transcript levels (Supplementary Figure S5C). As HCT116-shRNATop1 cells are a stable cell line, we also tested the effect of a transient silencing of Top1 by siRNA in HCT116 cells (Supplementary Figure S6). We found that Top1-specific siRNAs suppressed CPT effects with different rates in HCT116 cells. In agreement with data on HCT116-shRNATop1 (Supplementary Figure S5C), transient Top1 silencing left substantially unchanged antisense transcript levels in untreated cells (Supplementary Figure S7). Thus, CPT effects at CGI promoters strictly depend on cellular Top1 levels. Moreover, CPT increased antisense transcripts at the studied CGI promoters in other human cell lines, including PC3, U2OS, COLO205 (Supplementary Figure S5A) and N-Tera cells (not shown), showing that the molecular response to Top1cc is not restricted to a specific cell type. Taken together, these findings confirmed Req-seq data and demonstrated that Top1ccs specifically increase antisense transcript levels at CGI promoters of intermediate activity in different human cell types.
To characterize the promoters with Top1cc-enhanced antisense transcripts, we have then investigated their chromatin features as determined by the ENCODE project in HCT116 cells (48). An analysis of gene promoter regions corresponding to the Top1cc-increased 256 antisense transcripts in HCT116 cells (Table 1 and Supplementary Table SIII) with WashU Epigenome Browser tools (http://epigenomegateway.wustl.edu) showed that these regions have chromatin features of divergent promoters (Figure 3A). RNAPII density, H3K4m3 and H3K27ac levels showed two peaks upstream and downstream of TSS, whereas gene promoter sets with no change or a decrease of antisense tags showed only one peak for each of the three chromatin marks downstream to TSS (Figure 3B and Supplementary Figure S8). In all cases, GC percentage was mainly increased around the TSS and downstream of it (Figure 3 and Supplementary Figure S8). Although the lower and upper quartiles of each single box-plot showed a significant variation of chromatin features among the selected promoters (Figure 3 and Supplementary Figure S8), nevertheless the findings clearly demonstrated a common symmetrical chromatin architecture signature with two peaks of paused RNAPII and two domains of histone marks at gene 5′-ends, likely related to a bi-directional (divergent) transcription activity in HCT116 cells (47,49).
Figure 3.
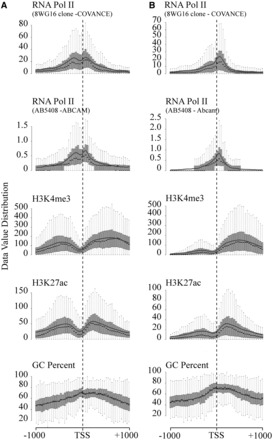
CPT exerts its effects at bidirectional promoters. (A) Analysis with WashU Epigenome Browser tools of the promoter region of the CPT-increased 256 antisense transcripts identified by Cufflinks. Shown chromatin features are respectively RNA Pol II density, H3K4me3 density, H3K27ac density and GC percentage in a region from 1000 bases upstream to 1000 bases downstream the TSS (dotted line). (B) Analysis with WashU Epigenome Browser tools of the promoter region of 249 randomly selected genes having FPKM between 1 and 100 and that did not demonstrate in our analysis a modification in antisense reads after CPT treatment.
Top1cc-enhanced promoter-associated antisense transcripts are regulated by Cdk9
As RNAPIIs at divergent promoters have been proposed to be regulated after P-TEFb recruitment (50), we have then investigated the role of the transcriptional kinase Cdk9 (a subunit of P-TEFb) by directly downregulating it with siRNAs. Cdk9 silencing partially suppressed the Top1cc increase of antisense transcripts at almost all the tested promoters following 4 h of treatment (Figure 4A). The observed reduction of Top1cc-enhanced antisense transcripts was significant considering that kinase silencing was partial (Supplementary Figure S9A), and 4 h of drug treatment could allow transcript accumulation effects. We have then used DRB, a strong inhibitor of Cdk9 and RNAPII transcription elongation, which reduced the levels of antisense transcripts both in control and CPT-treated HCT116 cells (Figure 4B). The results therefore showed that Cdk9 activity is required for normal extents of antisense transcripts at the selected CGI promoters, likely indicating that antisense transcription is regulated by P-TEFb and Cdk9 at proximal-promoter RNAPII pausing step (50). Interestingly, even though DRB effectively reduced antisense transcripts with and without CPT treatment, we noticed that CPT could still increase antisense transcripts in the presence of DRB for almost all the studied promoters with similar fold change (Figure 4B and Supplementary Figure S10). We have then investigated whether CPT affected sense read levels downstream of TSS in the studied promoter set. However, we found no evidence of any common effect on sense transcripts (not shown), even though some increase of sense reads can be observed at some of the studied promoters (Figure 4C). Thus, the results show that CPT-stabilized Top1ccs specifically affect antisense versus sense transcripts at divergent CGI promoters, likely reducing RNA degradation.
Figure 4.

Dependence of CPT effects on antisense transcript levels on ongoing transcription. (A) The effects of 10 μM CPT for 4 h on antisense transcription have been studied after silencing of CDK9 (white bars) in HCT116 cells. Drug treatment was performed 72 h post-transfection of siRNAs. Scrambled siRNA samples are black bars. (B) CPT effects in HCT116 cells were studied at the selected locus with and without DRB. Co-treatment: cells were pretreated for 15 min with 50 μM DRB before the addition of CPT (10 μM) for 4 h. In all cases, PCR determinations were normalized to cytochrome b mRNA and to untreated cells (dotted line). Values are means ± SEM of at least four determinations of two independent experiments for each panel. (C) Genomic map of the region −4000 to +1000 bp around transcription start site (TSS, bold line) of two analyzed genes having increased antisense transcripts induced by CPT. In each case, the top and bottom graphs reports the read distributions in HCT116 and HCT116-shRNATop1 cells, respectively. In shades of blue the patterns of sense reads, in shades of red those of antisense reads (dark colors for control cells; light colors for CPT-treated cells). In the centre of each graph, the map from UCSC genomic browser, highlighting the chromosomal position of unknown cluster, PCR amplicon, CpG island and the gene 5′-end, respectively. The validation by qRT-PCR has been conducted or in a region overlapping the unknown cluster (i.e. ATF1) or in a position close to it (i.e. GPC1), where it is evident an increase of antisense transcription simply by reads mapping.
Top1cc-induced increase of promoter-associated antisense transcripts is independent from DNA replication
Next, we determined whether ongoing DNA replication is required for the observed Top1cc effects at promoters by stopping replication with aphidicolin, a specific inhibitor of DNA polymerases. Aphidicolin could prevent CPT-induced H2AX phosphorylation, a marker of DNA damage (Supplementary Figure S9B), showing that replicative DNA damage promoted by CPT was markedly reduced by the compound. Nevertheless, CPT still increased antisense transcript levels in a dose-dependent manner at the selected CGI promoters even in the presence of aphidicolin (Figure 5A), showing that Top1ccs impacts promoter-associated antisense transcripts in a replication-independent manner. We also tested TPT, a CPT-derivative approved for clinical use and showed that it increased promoter-associated antisense transcripts in HCT116 cells in a dose-dependent manner, whereas the effect was reduced in HCT16-shRNATop1 cells (Figure 5B). Consistently, an inactive CPT analog and etoposide (VP-16, a TopII inhibitor) did not increase antisense RNAs in the studied promoters (Supplementary Figure S11). The data therefore support a specific response to Top1ccs at divergent CGI promoters.
Figure 5.
CPT effects on antisense transcript levels are independent from CPT-induced DNA damage at replication forks. Dose-response of HCT116 cells was analyzed at the selected locus with and without Aphidicolin. Co-treatment: cells were pretreated for 15 min with 5 μM Aphidicolin before the addition of CPT (1 or 10 μM) for 4 h. (B) Antisense transcripts were evaluated after treatment of the indicated cell lines with TPT 10 μM for 4 h. In (A) and (B), PCR determinations were normalized to cytochrome b mRNA and to untreated cells (dotted line). Values are means +/− SEM of at least four determinations of two independent experiments for each panel.
CPT induces a rapid burst of Top1ccs that correlates with a transient RNAPII block at promoters
Our results clearly showed that CPT-induced Top1ccs increase antisense transcript levels selectively at active divergent promoters containing a CGI. Gene Set Enrichment analyses (28–30) of this set of genes provided no significant finding beyond the generic features of housekeeping genes and regulatory activity in nuclear compartments. We however noticed that 62% of the 256 unknown tag clusters increased by Top1ccs (Table 1) overlap with sites of DNase I hypersensitivity in HCT116 cells (elaborated at the UCSC Genome Browser), whereas almost the rest (36%) was within 3000 nt from such regions, documenting that they map at or close to nucleosome-free regions. As Top1 has been mapped to open chromatin sites of promoters (22,51), we then investigated the kinetics of Top1cc formation at the selected CGI promoters following CPT treatment.
The kinetics of Top1cc formation overall in the genome was determined by CsCl gradient purification following an immediate lysis of cells with a strong detergent, to prevent the reversion of Top1cc. Interestingly, Top1ccs are increased at high levels after only 2 min of CPT treatment, and then remain stable with slight variations up to 20 min of CPT treatment (Figure 6A). Interestingly, the bound but not the free Top1 molecules showed high molecular weight forms likely due to ubiquitination or sumoylation after only 2 min of drug treatment (Figure 6A), showing a rapid response of the cells to CPT-stabilized Top1ccs. Then, we used a K+SDS precipitation assay of SDS cell lysates (30) to determine Top1cc levels at the selected CGI promoters. Along with them, we investigated silent promoter regions, centromeric α-satellite DNA [a negative region for Top1 binding, see (28)], and a known Top1 binding site at the origin of replication located at the 3′ end of the human lamin B2 gene (52). As expected, the findings showed that the lamin B2 region was enriched >20-fold in K+SDS precipitates over α-satellite DNA (Figure 6D). We then investigated TSS-proximal regions of 7 active promoters (GAPDH, POLR2A, MYC, VEGFA, SP2, TDG, ATF1), and the DNA recovery in the precipitates showed a bell-shaped curve over time of CPT treatment with an initial increase at short times (0.5–5 min) followed by a marked decrease at later times (10–20 min) (Figure 6D). CPT increased DNA recovery from 2- to 4-fold with respect to untreated HCT116 cells. The increase was instead much lower in HCT116-shRNATop1 cells (<1.5-fold), consistent with the reduced cellular Top1 levels. CPT did not increase DNA recovery at promoters of three silent genes (MYOD1, LOR and FOXA2 in Figure 6D) showing that Top1 is at low levels, if any, at inactive promoters. We then looked at regions in the body of MYC and HIF-1α genes, and the findings showed similar kinetics of Top1cc formation by CPT at these sites as well (Figure 6E).
Figure 6.

CPT determines a rapid and transient burst of Top1ccs that correlates with transient RNA Pol II block. (A) ICE bioassay was performed on HCT116 cells after 2, 5 and 20 min of 10 μM CPT treatment. The gel shows both CsCl gradient fractions containing DNA bound proteins (on the left) and free proteins (on the right). β-Actin was used as loading control. (B) ChIP on RNA Pol II. HCT116 cells were treated for 5, 10, 20 and 30 min with CPT 10 μM and the DNA recovery at indicated gene promoters is plotted as fold increase on not treated cells against treatment time. The analyzed gene regions are on TSS or immediately downstream to it and are listed (C). (C) List of genes observed in ChIP and K+SDS Assays [(B) and (D) panels], with the relative FPKM obtained by RNA-Seq. Used primers are reported in Supplementary Table SVI. (D) K+SDS precipitation assay on HCT116 and HCT116-shRNATop1 cells. Cells were treated for 2, 5, 10 and 20 min with 10 μM CPT. The recovery of Top1ccs at indicated gene promoters is reported as fold increase or percentage on input on not treated cells against treatment time. Used primers are in Supplementary Table SVI. (E) K+SDS precipitation assay on HCT116 in different positions along MYC and HIF-1α genes. Below the DNA recovery, a map showing the analyzed region. Standard errors (SEM) are not reported in (B) and (D) for image clarity. The average SEMs are as follows: 37% of the mean value (panel B); 19 and 37% of mean values for top and lower graphs (panel D HCT116), respectively; 16 and 23% of mean values for top and lower graphs (panel D HCT116-shRNATop1), respectively.
The unexpected DNA recovery kinetics in K+SDS precipitates and CsCl gradient results demonstrated that CPT could immediately induce the formation of Top1ccs followed by their rapid removal from active promoters. We then determined kinetics of RNAPII density during CPT treatment at the same promoters with ChIP (Figure 6B). Interestingly, at active promoters with a high rate of RNAPII recruitment, the results show an accumulation of the polymerase followed by a reduction of it during drug treatment (Figure 6B). The timing of the bell-shaped curve correspond to the timing of Top1cc burst, suggesting that CPT-trapped Top1ccs at promoter sites can block polymerase escape from promoter regions, and their removal can eventually release RNAPII allowing pausing escape (31).
CPT transiently increases R-loops in whole cells paralleling the bursts of Top1ccs
As a rapid increase of CPT-induced Top1ccs may affect DNA supercoiling at transcriptionally active genes (51), we also investigated the formation of R-loop structures (favored by negatively supercoiled DNA) with an antibody against the DNA/RNA hybrid duplex (53) by immunofluorescence and cell imaging in HCT116 and HCT116-shRNATop1 cells. The kinetics of R-loop formation appear to parallel the burst of Top1ccs reported earlier in the text (Figure 6), as R-loops were significantly increased by 2–10 min of CPT treatment while they were reduced at longer (1 h) times (Figure 7A and B) in HCT116 cells. The fluorescence signal was mainly increased in nucleoli and at cytoplasmic spots localized at the periphery of the nucleus (Figure 7A). These cytoplasmic spots likely correspond to mitochondria where R-loops are present at the DNA origin of replication, as evidenced by mitochondria-specific staining in the same cells (Supplementary Figure S12). After 1 h of CPT, fluorescence distribution was further changed with a single (or few) prominent spot(s) detected in the nucleus (Figure 7), suggesting that R loop structures last longer at some genomic regions. Interestingly, the findings in HCT116-shRNATop1 cells were different. First, in control cells, fluorescence was higher in HCT116-shRNATop1 than HCT116 cells, and in particular, nucleolar signal was marked (Figure 7A and B). Second, CPT did not increase the R-loop signal in HCT116-shRNATop1 cells (Figure 7A and B). However, at longer time fluorescence intensity decreased, and patterns were more similar in both cell lines. Thus, cell images show that CPT can induce a rapid and transient increase of R-loops in a Top1-dependent manner, likely due to negatively superhelical tension of DNA template at actively transcribed regions, such as ribosomal genes.
Figure 7.

CPT rapidly increases cellular R-loops. (A) Immunofluorescence of HCT116 and HCT116-shRNATop1 cells using S9.6 antibody against DNA-RNA hybrid duplex. Cells were treated for 2, 5, 10 and 60 min with 10 μM CPT, 24 h post-seeding. (B) Box-plots representing the variation of fluorescence intensity (panel A) after drug treatment. The value is obtained using ImageJ software. Number of observed cells for each samples: 79, 85, 72, 99 and 90, respectively, for HCT116; 91, 185, 159, 126 and 125, respectively, for HCT116-shRNATop1 cells.
DISCUSSION
The present findings demonstrate for the first time that Top1ccs have a specific and dynamic impact at divergent CGI promoters in human cells. CPT-stabilized Top1ccs enhance levels of antisense RNAPII transcripts upstream of TSS at divergent CGI promoters of intermediate activity. The CPT effects are dependent on cellular Top1 levels, and independent from DNA replication. Top1ccs immediately form at transcribing regions, but then their levels decrease after only 10 min of drug treatment. The bell-shaped Top1cc kinetic parallels a similar transient increase of RNAPII density at promoters, indicating that Top1ccs transiently block the polymerase. Top1ccs are stabilized not only by CPT but also by oxidative base damage, base mismatches and ribonucleotides incorporated into DNA strands (14,54). Thus, Top1ccs may physiologically occur in living cells at a significant rate and may cause specific dynamical changes leading to alterations of RNAPII recruitment and antisense transcripts.
Divergent promoters have been reported in several eukaryotic cells (46,47,50,55–57) raising the question of how this process contributes to regulation of gene activity and chromatin structure. It is therefore interesting that the majority of TSSs in murine embryonic stem cells show evidence of bidirectional transcription (47). Previous results showed that divergent RNAPIIs are regulated by P-TEFb at post-initiation pausing sites and that antisense transcript levels are controlled by the exosome (50). Our results are in agreement with a role for Cdk9 (a P-TEFb subunit) in antisense transcription, as Cdk9 inhibition and silencing can reduce the cellular levels of antisense transcripts. We have previously shown that CPT causes a specific transcriptional stress with RNAPII hyperphosphorylation, increased RNAPII escape from promoter pausing sites, chromatin accessibility marks and antisense transcripts at human HIF-1a and c-Myc genes (31). Moreover, inhibition of Cdk9 and Cdk7 activity by DRB could suppress the CPT-induced RNAPII escape and hyperphosphorylation and increased chromatin accessibility. However, we show here that DRB is not able to suppress the CPT-induced increase of antisense transcript levels at the studied divergent CGI promoters. As DRB is an effective transcription inhibitor and it does not suppress Top1ccs induced by CPT (14), we therefore propose that the CPT effect may mainly be due to a reduction of RNA degradation. This hypothesis is also supported by the finding that reducing the RNA degradation pathway by silencing exosome subunits can enhance promoter-associated antisense transcripts in human cells (58).
A recent article (51) showed that human promoters of active genes constitute topological domains of negative supercoiling mainly due to the short range of torsional stress dissipation. As Top2 and Top1 can be functionally redundant, the authors found that Top1 is mainly responsible for supercoil relaxation at promoters of intermediate activity, whereas Top2 becomes more important at highly active promoters (51). Consistently, we have here found that Top1ccs increase antisense transcripts at intermediately active divergent CGI promoters, whereas we did not detect a similar effect by inhibiting TopII with etoposide. Thus, the specific increase of antisense transcripts by CPT likely occurs where Top1 constitutes the main DNA relaxation activity. We cannot however exclude that TopII inhibitors may alter antisense transcript levels in a different set of gene promoters.
In addition, CPT has been shown to increase negative supercoils at promoters of intermediate activity after 5 min of cell treatment (51). In bi-directional promoters, the rate of transcription-generated negative torsional tension is necessarily higher as divergent RNAPIIs elongate in different directions. Thus, divergent CGI promoters may constitute a set of gene control regions highly sensitive to exogenous and endogenous perturbation of Top1 activity. CGI promoters may readily respond to Top1ccs by an increase of negative supercoils leading to strand denaturation and formation of non-B structures. Interestingly, TOP1 gene deletion has been shown to cause an increase of R-loops at actively transcribed rRNA genes in yeast, leading to an accumulation of slowed RNAPs I at the 5′ end of the gene (59).
An important finding of the present work is the demonstration that CPT induces a stabilization of R loops at nucleoli and mitochondria in HCT116 cells with a kinetic that closely parallels Top1cc formation (Figures 6 and 7). Interestingly, cells with reduced Top1 levels (HCT116-shRNATop1) show higher levels of R loops at nucleoli and whole cells without CPT treatment. This finding is consistent with a previous investigation showing that overexpression of RNaseH can reduce genomic instability and replication/transcription conflicts due to Top1 silencing (35). R-loops can form physiologically at sequences showing a G-richness in one strand, known as GC skew (53). We noticed that 185 of 246 promoter-associated antisense transcripts overlap with or are within 3000 bp distant from a GC skewed region. In addition, some of our antisense transcripts overlap to DNA segments known to form R-loops in untreated human cells (53). Thus, we propose that Top1ccs may cause an increase of negative supercoils at divergent CGI promoters determining a stabilization of R-loops, and then trigger an accumulation of promoter-associated antisense transcripts. Even though further studies are needed to establish such hypothesis, Top1ccs-dependent genome instability may preferentially occur at divergent CGI promoters of intermediate activity.
Top1cc-triggered antisense transcripts may constitute a specific molecular response to Top1ccs in normal and stress conditions. It remains to be established if they play a role in the maintenance of vital cellular processes under stress conditions such as increased levels of Top1ccs. Antisense transcripts have been shown to contribute to the regulation of gene expression regulation. We recently showed that the 5′ aHIF1a antisense RNA of the human HIF-1a gene may have a role in the nucleus-cytoplasm transport machinery (33). In addition, accumulated antisense transcripts may interact with RNAPII or transcription factors to regulate chromatin structure, recruitment and sense transcription. This has been shown for transcripts upstream of the cyclin D1 gene that recruit TLS, a RNA-binding factor sensitive to DNA damage (60), and of Polycomb target genes that bind to Suz12 to repress gene transcription (61). Thus, antisense transcripts may regulate gene expression through different mechanisms at divergent CGI promoters in response to Top1ccs. However, the definition of their functions remains to be established by further investigations.
ACCESSION NUMBERS
The RNA-Seq data have been submitted to the SRA database (http://www.ncbi.nlm.nih.gov/sra) with identifier PRJNA186590.
SUPPLEMENTARY DATA
Supplementary Data are available at NAR Online.
FUNDING
‘Associazione Italiana per la Ricerca sul Cancro’ (AIRC), Milan, Italy [IG10184 to G.C.]; University of Bologna PhD Program in Cellular and Molecular Biology (to S.G.M.). Funding for open access charge: Associazione Italiana per la Ricerca sul Cancro, Milan, Italy [IG 4494 to G.C.].
Conflict of interest statement. None declared.
Supplementary Material
ACKNOWLEDGEMENTS
The authors are grateful to F. Chedin for providing us with the S9.6 antibody; L. Calzà and C. Mangano for access to Confocal microscopy and help for cell imaging; R. Ragazzini and F. Simonetti for help in Top1cc mapping experiments; and G. Prosperini, D. Bertozzi and F. Chedin for helpful discussion. They thank the ‘Centro Interdipartimentale per le Ricerche Biotecnologie’ (CIRB) of Bologna University for access to equipment facilities.
REFERENCES
- 1.Baranello L, Levens D, Gupta A, Kouzine F. The importance of being supercoiled: How DNA mechanics regulate dynamic processes. Biochim. Biophys. Acta. 2012;1819:632–638. doi: 10.1016/j.bbagrm.2011.12.007. [DOI] [PMC free article] [PubMed] [Google Scholar]
- 2.Drolet M. Growth inhibition mediated by excess negative supercoiling: the interplay between transcription elongation, R-loop formation and DNA topology. Mol. Microbiol. 2006;59:723–730. doi: 10.1111/j.1365-2958.2005.05006.x. [DOI] [PubMed] [Google Scholar]
- 3.Kouzine F, Liu J, Sanford S, Chung HJ, Levens D. The dynamic response of upstream DNA to transcription-generated torsional stress. Nat. Struct. Mol. Biol. 2004;11:1092–1100. doi: 10.1038/nsmb848. [DOI] [PubMed] [Google Scholar]
- 4.Roca J. Transcriptional inhibition by DNA torsional stress. Transcription. 2011;2:82–85. doi: 10.4161/trns.2.2.14807. [DOI] [PMC free article] [PubMed] [Google Scholar]
- 5.Wang JC. Cellular roles of DNA topoisomerases: a molecular perspective. Nat. Rev. Mol. Cell Biol. 2002;3:430–440. doi: 10.1038/nrm831. [DOI] [PubMed] [Google Scholar]
- 6.Wu HY, Shyy SH, Wang JC, Liu LF. Transcription generates positively and negatively supercoiled domains in the template. Cell. 1988;53:433–440. doi: 10.1016/0092-8674(88)90163-8. [DOI] [PubMed] [Google Scholar]
- 7.Naughton C, Avlonitis N, Corless S, Prendergast JG, Mati IK, Eijk PP, Cockroft SL, Bradley M, Ylstra B, Gilbert N. Transcription forms and remodels supercoiling domains unfolding large-scale chromatin structures. Nat. Struct. Mol. Biol. 2013;20:387–395. doi: 10.1038/nsmb.2509. [DOI] [PMC free article] [PubMed] [Google Scholar]
- 8.Aguilera A, Garcia-Muse T. R loops: from transcription byproducts to threats to genome stability. Mol. Cell. 2012;46:115–124. doi: 10.1016/j.molcel.2012.04.009. [DOI] [PubMed] [Google Scholar]
- 9.Aguilera A, Gomez-Gonzalez B. Genome instability: a mechanistic view of its causes and consequences. Nat. Rev. Genet. 2008;9:204–217. doi: 10.1038/nrg2268. [DOI] [PubMed] [Google Scholar]
- 10.Kim N, Jinks-Robertson S. Transcription as a source of genome instability. Nat. Rev. Genet. 2012;13:204–214. doi: 10.1038/nrg3152. [DOI] [PMC free article] [PubMed] [Google Scholar]
- 11.Roy D, Yu K, Lieber MR. Mechanism of R-loop formation at immunoglobulin class switch sequences. Mol. Cell. Biol. 2008;28:50–60. doi: 10.1128/MCB.01251-07. [DOI] [PMC free article] [PubMed] [Google Scholar]
- 12.Brill SJ, DiNardo S, Voelkel-Meiman K, Sternglanz R. Need for DNA topoisomerase activity as a swivel for DNA replication for transcription of ribosomal RNA. Nature. 1987;326:414–416. doi: 10.1038/326414a0. [DOI] [PubMed] [Google Scholar]
- 13.Capranico G, Marinello J, Baranello L. Dissecting the transcriptional functions of human DNA topoisomerase I by selective inhibitors: implications for physiological and therapeutic modulation of enzyme activity. Biochim. Biophys. Acta. 2010;1806:240–250. doi: 10.1016/j.bbcan.2010.06.003. [DOI] [PubMed] [Google Scholar]
- 14.Pommier Y. Topoisomerase I inhibitors: camptothecins and beyond. Nat. Rev. Cancer. 2006;6:789–802. doi: 10.1038/nrc1977. [DOI] [PubMed] [Google Scholar]
- 15.Huang HS, Allen JA, Mabb AM, King IF, Miriyala J, Taylor-Blake B, Sciaky N, Dutton JW, Jr, Lee HM, Chen X, et al. Topoisomerase inhibitors unsilence the dormant allele of Ube3a in neurons. Nature. 2011;481:185–189. doi: 10.1038/nature10726. [DOI] [PMC free article] [PubMed] [Google Scholar]
- 16.Champoux JJ. DNA topoisomerases: structure, function, and mechanism. Annu. Rev. Biochem. 2001;70:369–413. doi: 10.1146/annurev.biochem.70.1.369. [DOI] [PubMed] [Google Scholar]
- 17.Pommier Y, Barcelo JM, Rao VA, Sordet O, Jobson AG, Thibaut L, Miao ZH, Seiler JA, Zhang H, Marchand C, et al. Repair of topoisomerase I-mediated DNA damage. Prog. Nucleic Acid Res. Mol. Biol. 2006;81:179–229. doi: 10.1016/S0079-6603(06)81005-6. [DOI] [PMC free article] [PubMed] [Google Scholar]
- 18.Staker BL, Hjerrild K, Feese MD, Behnke CA, Burgin AB, Jr, Stewart L. The mechanism of topoisomerase I poisoning by a camptothecin analog. Proc. Natl Acad. Sci. USA. 2002;99:15387–15392. doi: 10.1073/pnas.242259599. [DOI] [PMC free article] [PubMed] [Google Scholar]
- 19.Koster DA, Palle K, Bot ES, Bjornsti MA, Dekker NH. Antitumour drugs impede DNA uncoiling by topoisomerase I. Nature. 2007;448:213–217. doi: 10.1038/nature05938. [DOI] [PubMed] [Google Scholar]
- 20.Duann P, Sun M, Lin CT, Zhang H, Liu LF. Plasmid linking number change induced by topoisomerase I-mediated DNA damage. Nucleic Acids Res. 1999;27:2905–2911. doi: 10.1093/nar/27.14.2905. [DOI] [PMC free article] [PubMed] [Google Scholar]
- 21.Liu LF, Wang JC. Supercoiling of the DNA template during transcription. Proc. Natl Acad. Sci. USA. 1987;84:7024–7027. doi: 10.1073/pnas.84.20.7024. [DOI] [PMC free article] [PubMed] [Google Scholar]
- 22.Durand-Dubief M, Persson J, Norman U, Hartsuiker E, Ekwall K. Topoisomerase I regulates open chromatin and controls gene expression in vivo. EMBO J. 2010;29:2126–2134. doi: 10.1038/emboj.2010.109. [DOI] [PMC free article] [PubMed] [Google Scholar]
- 23.French SL, Sikes ML, Hontz RD, Osheim YN, Lambert TE, El Hage A, Smith MM, Tollervey D, Smith JS, Beyer AL. Distinguishing the roles of Topoisomerases I and II in relief of transcription-induced torsional stress in yeast rRNA genes. Mol. Cell. Biol. 2011;31:482–494. doi: 10.1128/MCB.00589-10. [DOI] [PMC free article] [PubMed] [Google Scholar]
- 24.Kretzschmar M, Meisterernst M, Roeder RG. Identification of human DNA topoisomerase I as a cofactor for activator-dependent transcription by RNA polymerase II. Proc. Natl Acad. Sci. USA. 1993;90:11508–11512. doi: 10.1073/pnas.90.24.11508. [DOI] [PMC free article] [PubMed] [Google Scholar]
- 25.Merino A, Madden KR, Lane WS, Champoux JJ, Reinberg D. DNA topoisomerase I is involved in both repression and activation of transcription. Nature. 1993;365:227–232. doi: 10.1038/365227a0. [DOI] [PubMed] [Google Scholar]
- 26.Shykind BM, Kim J, Stewart L, Champoux JJ, Sharp PA. Topoisomerase I enhances TFIID-TFIIA complex assembly during activation of transcription. Genes Dev. 1997;11:397–407. doi: 10.1101/gad.11.3.397. [DOI] [PubMed] [Google Scholar]
- 27.Salceda J, Fernandez X, Roca J. Topoisomerase II, not topoisomerase I, is the proficient relaxase of nucleosomal DNA. EMBO J. 2006;25:2575–2583. doi: 10.1038/sj.emboj.7601142. [DOI] [PMC free article] [PubMed] [Google Scholar]
- 28.Khobta A, Ferri F, Lotito L, Montecucco A, Rossi R, Capranico G. Early effects of topoisomerase I inhibition on RNA polymerase II along transcribed genes in human cells. J. Mol. Biol. 2006;357:127–138. doi: 10.1016/j.jmb.2005.12.069. [DOI] [PubMed] [Google Scholar]
- 29.Lavelle C. Transcription elongation through a chromatin template. Biochimie. 2007;89:516–527. doi: 10.1016/j.biochi.2006.09.019. [DOI] [PubMed] [Google Scholar]
- 30.Lotito L, Russo A, Chillemi G, Bueno S, Cavalieri D, Capranico G. Global transcription regulation by DNA topoisomerase I in exponentially growing Saccharomyces cerevisiae cells: activation of telomere-proximal genes by TOP1 deletion. J. Mol. Biol. 2008;377:311–322. doi: 10.1016/j.jmb.2008.01.037. [DOI] [PubMed] [Google Scholar]
- 31.Baranello L, Bertozzi D, Fogli MV, Pommier Y, Capranico G. DNA topoisomerase I inhibition by camptothecin induces escape of RNA polymerase II from promoter-proximal pause site, antisense transcription and histone acetylation at the human HIF-1alpha gene locus. Nucleic Acids Res. 2010;38:159–171. doi: 10.1093/nar/gkp817. [DOI] [PMC free article] [PubMed] [Google Scholar]
- 32.Sordet O, Larochelle S, Nicolas E, Stevens EV, Zhang C, Shokat KM, Fisher RP, Pommier Y. Hyperphosphorylation of RNA polymerase II in response to topoisomerase I cleavage complexes and its association with transcription- and BRCA1-dependent degradation of topoisomerase I. J. Mol. Biol. 2008;381:540–549. doi: 10.1016/j.jmb.2008.06.028. [DOI] [PMC free article] [PubMed] [Google Scholar]
- 33.Bertozzi D, Iurlaro R, Sordet O, Marinello J, Zaffaroni N, Capranico G. Characterization of novel antisense HIF-1alpha transcripts in human cancers. Cell Cycle. 2011;10:3189–3197. doi: 10.4161/cc.10.18.17183. [DOI] [PubMed] [Google Scholar]
- 34.Miao ZH, Player A, Shankavaram U, Wang YH, Zimonjic DB, Lorenzi PL, Liao ZY, Liu H, Shimura T, Zhang HL, et al. Nonclassic functions of human topoisomerase I: genome-wide and pharmacologic analyses. Cancer Res. 2007;67:8752–8761. doi: 10.1158/0008-5472.CAN-06-4554. [DOI] [PubMed] [Google Scholar]
- 35.Tuduri S, Crabbe L, Conti C, Tourriere H, Holtgreve-Grez H, Jauch A, Pantesco V, De Vos J, Thomas A, Theillet C, et al. Topoisomerase I suppresses genomic instability by preventing interference between replication and transcription. Nat. Cell Biol. 2009;11:1315–1324. doi: 10.1038/ncb1984. [DOI] [PMC free article] [PubMed] [Google Scholar]
- 36.He Y, Vogelstein B, Velculescu VE, Papadopoulos N, Kinzler KW. The antisense transcriptomes of human cells. Science. 2008;322:1855–1857. doi: 10.1126/science.1163853. [DOI] [PMC free article] [PubMed] [Google Scholar]
- 37.Cox MP, Peterson DA, Biggs PJ. SolexaQA: At-a-glance quality assessment of Illumina second-generation sequencing data. BMC Bioinformatics. 2010;11:485. doi: 10.1186/1471-2105-11-485. [DOI] [PMC free article] [PubMed] [Google Scholar]
- 38.Langmead B, Trapnell C, Pop M, Salzberg SL. Ultrafast and memory-efficient alignment of short DNA sequences to the human genome. Genome Biol. 2009;10:R25. doi: 10.1186/gb-2009-10-3-r25. [DOI] [PMC free article] [PubMed] [Google Scholar]
- 39.Trapnell C, Pachter L, Salzberg SL. TopHat: discovering splice junctions with RNA-Seq. Bioinformatics. 2009;25:1105–1111. doi: 10.1093/bioinformatics/btp120. [DOI] [PMC free article] [PubMed] [Google Scholar]
- 40.Trapnell C, Williams BA, Pertea G, Mortazavi A, Kwan G, van Baren MJ, Salzberg SL, Wold BJ, Pachter L. Transcript assembly and quantification by RNA-Seq reveals unannotated transcripts and isoform switching during cell differentiation. Nat. Biotechnol. 2010;28:511–515. doi: 10.1038/nbt.1621. [DOI] [PMC free article] [PubMed] [Google Scholar]
- 41.Hollander M, Wolfe D. Nonparametric Statistical Methods. New York, NY: Wiley; 1999. [Google Scholar]
- 42.Subramanian D, Furbee CS, Muller MT. ICE bioassay. Isolating in vivo complexes of enzyme to DNA. Methods Mol. Biol. 2001;95:137–147. doi: 10.1385/1-59259-057-8:137. [DOI] [PubMed] [Google Scholar]
- 43.Huang da W, Sherman BT, Lempicki RA. Systematic and integrative analysis of large gene lists using DAVID bioinformatics resources. Nat. Protoc. 2009;4:44–57. doi: 10.1038/nprot.2008.211. [DOI] [PubMed] [Google Scholar]
- 44.Huang da W, Sherman BT, Lempicki RA. Bioinformatics enrichment tools: paths toward the comprehensive functional analysis of large gene lists. Nucleic Acids Res. 2009;37:1–13. doi: 10.1093/nar/gkn923. [DOI] [PMC free article] [PubMed] [Google Scholar]
- 45.Solier S, Barb J, Zeeberg BR, Varma S, Ryan MC, Kohn KW, Weinstein JN, Munson PJ, Pommier Y. Genome-wide analysis of novel splice variants induced by topoisomerase I poisoning shows preferential occurrence in genes encoding splicing factors. Cancer Res. 2010;70:8055–8065. doi: 10.1158/0008-5472.CAN-10-2491. [DOI] [PMC free article] [PubMed] [Google Scholar]
- 46.Core LJ, Waterfall JJ, Lis JT. Nascent RNA sequencing reveals widespread pausing and divergent initiation at human promoters. Science. 2008;322:1845–1848. doi: 10.1126/science.1162228. [DOI] [PMC free article] [PubMed] [Google Scholar]
- 47.Seila AC, Calabrese JM, Levine SS, Yeo GW, Rahl PB, Flynn RA, Young RA, Sharp PA. Divergent transcription from active promoters. Science. 2008;322:1849–1851. doi: 10.1126/science.1162253. [DOI] [PMC free article] [PubMed] [Google Scholar]
- 48.Dunham I, Kundaje A, Aldred SF, Collins PJ, Davis CA, Doyle F, Epstein CB, Frietze S, Harrow J, Kaul R, et al. An integrated encyclopedia of DNA elements in the human genome. Nature. 2012;489:57–74. doi: 10.1038/nature11247. [DOI] [PMC free article] [PubMed] [Google Scholar]
- 49.Thurman RE, Rynes E, Humbert R, Vierstra J, Maurano MT, Haugen E, Sheffield NC, Stergachis AB, Wang H, Vernot B, et al. The accessible chromatin landscape of the human genome. Nature. 2012;489:75–82. doi: 10.1038/nature11232. [DOI] [PMC free article] [PubMed] [Google Scholar]
- 50.Flynn RA, Almada AE, Zamudio JR, Sharp PA. Antisense RNA polymerase II divergent transcripts are P-TEFb dependent and substrates for the RNA exosome. Proc. Natl Acad. Sci. USA. 2011;108:10460–10465. doi: 10.1073/pnas.1106630108. [DOI] [PMC free article] [PubMed] [Google Scholar]
- 51.Kouzine F, Gupta A, Baranello L, Wojtowicz D, Ben-Aissa K, Liu J, Przytycka TM, Levens D. Transcription-dependent dynamic supercoiling is a short-range genomic force. Nat. Struct. Mol. Biol. 2013;20:396–403. doi: 10.1038/nsmb.2517. [DOI] [PMC free article] [PubMed] [Google Scholar]
- 52.Abdurashidova G, Radulescu S, Sandoval O, Zahariev S, Danailov MB, Demidovich A, Santamaria L, Biamonti G, Riva S, Falaschi A. Functional interactions of DNA topoisomerases with a human replication origin. EMBO J. 2007;26:998–1009. doi: 10.1038/sj.emboj.7601578. [DOI] [PMC free article] [PubMed] [Google Scholar]
- 53.Ginno PA, Lott PL, Christensen HC, Korf I, Chedin F. R-loop formation is a distinctive characteristic of unmethylated human CpG island promoters. Mol. Cell. 2012;45:814–825. doi: 10.1016/j.molcel.2012.01.017. [DOI] [PMC free article] [PubMed] [Google Scholar]
- 54.Kim N, Huang SN, Williams JS, Li YC, Clark AB, Cho JE, Kunkel TA, Pommier Y, Jinks-Robertson S. Mutagenic processing of ribonucleotides in DNA by yeast topoisomerase I. Science. 2011;332:1561–1564. doi: 10.1126/science.1205016. [DOI] [PMC free article] [PubMed] [Google Scholar]
- 55.Neil H, Malabat C, d’Aubenton-Carafa Y, Xu Z, Steinmetz LM, Jacquier A. Widespread bidirectional promoters are the major source of cryptic transcripts in yeast. Nature. 2009;457:1038–1042. doi: 10.1038/nature07747. [DOI] [PubMed] [Google Scholar]
- 56.Valen E, Preker P, Andersen PR, Zhao X, Chen Y, Ender C, Dueck A, Meister G, Sandelin A, Jensen TH. Biogenic mechanisms and utilization of small RNAs derived from human protein-coding genes. Nat. Struct. Mol. Biol. 2011;18:1075–1082. doi: 10.1038/nsmb.2091. [DOI] [PubMed] [Google Scholar]
- 57.Xu Z, Wei W, Gagneur J, Perocchi F, Clauder-Munster S, Camblong J, Guffanti E, Stutz F, Huber W, Steinmetz LM. Bidirectional promoters generate pervasive transcription in yeast. Nature. 2009;457:1033–1037. doi: 10.1038/nature07728. [DOI] [PMC free article] [PubMed] [Google Scholar]
- 58.Preker P, Nielsen J, Kammler S, Lykke-Andersen S, Christensen MS, Mapendano CK, Schierup MH, Jensen TH. RNA exosome depletion reveals transcription upstream of active human promoters. Science. 2008;322:1851–1854. doi: 10.1126/science.1164096. [DOI] [PubMed] [Google Scholar]
- 59.El Hage A, French SL, Beyer AL, Tollervey D. Loss of Topoisomerase I leads to R-loop-mediated transcriptional blocks during ribosomal RNA synthesis. Genes Dev. 2010;24:1546–1558. doi: 10.1101/gad.573310. [DOI] [PMC free article] [PubMed] [Google Scholar]
- 60.Wang X, Arai S, Song X, Reichart D, Du K, Pascual G, Tempst P, Rosenfeld MG, Glass CK, Kurokawa R. Induced ncRNAs allosterically modify RNA-binding proteins in cis to inhibit transcription. Nature. 2008;454:126–130. doi: 10.1038/nature06992. [DOI] [PMC free article] [PubMed] [Google Scholar]
- 61.Kanhere A, Viiri K, Araujo CC, Rasaiyaah J, Bouwman RD, Whyte WA, Pereira CF, Brookes E, Walker K, Bell GW, et al. Short RNAs are transcribed from repressed polycomb target genes and interact with polycomb repressive complex-2. Mol. Cell. 2010;38:675–688. doi: 10.1016/j.molcel.2010.03.019. [DOI] [PMC free article] [PubMed] [Google Scholar]
Associated Data
This section collects any data citations, data availability statements, or supplementary materials included in this article.