

Abstract
Diabetes is a risk factor for many cancers; chronic hyperglycemia is hypothesized to be, in part, explanatory. We evaluated the association between glycated hemoglobin, a time-integrated glycemia measure, and cancer incidence and mortality in non-diabetic and diabetic men and women. We conducted a prospective study of 12,792 cancer-free participants attending the second visit (1990–1992) of the Atherosclerosis Risk in Communities (ARIC) Study. We measured glycated hemoglobin in whole-blood samples using HPLC. Incident cancers were ascertained from registries and hospital records through 2006. We estimated multivariable-adjusted hazard ratios (HR) of cancer incidence and mortality for non-diabetic participants with values ≥5.7% (elevated), non-diabetic participants with <5.0% (low), and diabetic participants all compared with non-diabetic participants with 5.0–5.6% (normal). We ascertained 2,349 incident cancer cases and 887 cancer deaths. Compared with non-diabetic women with normal glycated hemoglobin, non-diabetic women with elevated values had an increased risk of cancer incidence (HR:1.24; 95% CI:1.07,1.44) and mortality (HR:1.58; 95% CI:1.23,2.05) as did diabetic women (incidence, HR:1.30; 95% CI:1.06,1.60, mortality, HR:1.96; 95% CI:1.40,2.76). Non-diabetic women with low values also had increased risk. Diabetic women with good glycemic control (<7.0%) had a lower cancer risk than those with higher values. Glycated hemoglobin in non-diabetic and diabetic men, and diabetes were not statistically significantly associated with total cancer risk. Our findings support the hypothesis that chronic hyperglycemia, even in the non-diabetic range, increases cancer risk in women. Maintaining normal glycated hemoglobin overall, and good glycemic control among diabetic adults, may reduce the burden of cancer, especially in women.
Keywords: glycated hemoglobin, diabetes, cancer incidence, cancer mortality
Introduction
Diabetes is associated with an increased risk of many cancers,1–7 but a decreased risk of prostate cancer.8, 9 The exact mechanism(s) underlying these associations are unknown.10 Chronic hyperglycemia is one potential mediator of the association between diabetes and cancer. Hyperglycemia may have an independent influence on cancer risk, or it may be a surrogate for obesity and/or the metabolic perturbations associated with obesity and diabetes, like hyperinsulinemia.10 Most studies evaluating hyperglycemia and cancer risk have used fasting blood glucose, a diabetes diagnostic tool.11 These studies found that increased fasting blood glucose, independent of adiposity, is associated with an increased risk of cancer incidence,12–16 and cancer mortality.12, 16, 17 Among prospective studies that evaluated women and men separately, some,15, 16 but not all,12, 13 found a stronger association between elevated fasting blood glucose and cancer risk in women than men.
Glycated hemoglobin, historically a measure of glycemic control among those with diabetes, is now a diagnostic tool for diabetes.18 In contrast to fasting glucose, glycated hemoglobin reflects the 2 to 3 month average endogenous glucose exposure, including post-prandial excursions.19 Thus, glycated hemoglobin may capture the glucose exposure most relevant to cancer risk; that is, the average exposure. Four of five prospective studies that evaluated the association of glycated hemoglobin and cancer risk among non-diabetics found that higher glycated hemoglobin is associated with an increased risk of cancer incidence 20 and mortality,21–23 although these studies did not address differences by sex,22 did not adjust for adiposity,20 or investigated the question in highly selected populations.20, 21, 23 The remaining study found no association between glycated hemoglobin and cancer mortality among non-diabetic adults.24 Prospective studies on cancer among those with diabetes have been inconsistent regarding whether increased glycated hemoglobin is associated with cancer mortality,21, 22 or not.24, 25 Thus, we evaluated the association of glycated hemoglobin in non-diabetic and diabetic participants, separately for women and men, with cancer incidence and mortality in a large community-based, prospective cohort study.
Methods
Study Population
The Atherosclerosis Risk in Communities (ARIC) study is a prospective cohort of 15,792 adults aged 45–64 years at enrollment from four U.S. communities (Forsyth County, NC; Jackson, MS; Minneapolis, MN; Washington County, MD); study details have been described previously.26 Participants were examined during four visits; the first visit was conducted from 1987 to 1989, with three follow-up visits taking place approximately every 3 years. The second visit (1990–92) was the only visit in which whole blood was stored for glycated hemoglobin measurement; this visit was the baseline for the present study.
The analytic cohort included 12,792 white and black participants with no prior cancer diagnosis (except non-melanoma skin) by the second visit and complete information on glycated hemoglobin and relevant factors. Participants were followed for cancer incidence and mortality (median follow-up: 15 years). Participants gave written informed consent; institutional review boards at each site approved the study protocol.
Assessment of Diabetes, Glycated Hemoglobin, and Other Factors
We classified participants as having diagnosed diabetes, hereafter referred to as diabetic, if they self-reported a doctor’s diagnosis of diabetes and/or were taking diabetes medication at the first or second visits, or as non-diabetic. Glycated hemoglobin was measured in frozen whole-blood samples using high-performance liquid chromatography.27 We classified all participants by glycated hemoglobin value. Non-diabetic participants were classified as: ≥5.7% (elevated), indicating increased risk for diabetes or undiagnosed diabetes;28 5.0–5.6% (normal), normal range for this study; and <5.0% (low), previously associated with an increased risk of mortality in this cohort.29 Participants in the ≥5.7% category were further classified as ≥5.7–6.4%, indicating increased risk for diabetes, or ≥6.5%, indicating undiagnosed diabetes.28 Diabetic participants were classified as: ≤7.0%, the target for good glycemic control;11 and >7.0%. Fasting insulin was measured by radioimmunoassay at the first, not the second, ARIC visit.30 Trained technicians measured body mass index (BMI, kg/m2) and waist circumference (cm).31 Participants reported their highest education level, post-menopausal hormone use (women), current cigarette smoking status, and, if applicable, the number of years smoked, and the average number of cigarettes smoked daily; the latter two numbers were multiplied to calculate cigarette-years.
Assessment of Cancer Incidence and Mortality
Incident cancers were ascertained from 1987 through 2006 through linkage with state cancer registries in Minnesota, North Carolina, Maryland, and Mississippi, and supplemented by active surveillance of the cohort, which includes recording of hospital discharge codes for all participants. Participants also self-reported all hospitalizations during annual follow-up telephone calls. Cancer-related hospitalizations not previously identified by registry linkage were included as cases after verification by obtaining and reviewing medical records. Deaths from cancer as the underlying cause were obtained from death certificates. If a cancer death was the first report of cancer, the death was considered an incident cancer (2.7% of incident cancers).
Statistical Analysis
All analyses were stratified by sex. We calculated, by glycated hemoglobin or diabetes category, age- and race-: 1) adjusted means and proportions for demographic and other factors using regression modeling, 2) standardized rates for overall and site-specific cancer incidence and mortality. Participants began contributing time at risk at the second visit (1990–1992) through 12/31/2006. We used Cox proportional hazards regression to estimate the HR of cancer incidence and mortality in: 1) non-diabetic participants by glycated hemoglobin categories (<5.0%; 5.0–5.6%, reference; ≥5.7%), and in diabetic participants, 2) non-diabetic participants by glycated hemoglobin categories (<5.0%; 5.0–5.6%, reference; ≥5.7%-6.4%; ≥6.5%), and 3) diabetic participants by glycated hemoglobin categories (≤7.0%; >7.0%, reference). We modeled continuous glycated hemoglobin using restricted quadratic splines with knots at the 10th, 50th, and 90th percentiles in 1) non-diabetic participants with 5.0% as the reference, and 2) diabetic participants with 7.0% as the reference. The top and bottom 1% of the distribution of glycated hemoglobin (determined separately for non-diabetic and diabetic participants) were excluded from the spline models to minimize the influence of extreme values. We compared the linear and spline models with the likelihood ratio test to determine if the spline model differed from a linear dose-response. We confirmed the proportional hazards assumption of the models. All models were adjusted for characteristics at the second visit: age and race; and further adjusted for ARIC study site, education level, cigarette smoking status, cigarette-years smoked, BMI, waist circumference and post-menopausal hormone use (women only). In the primary analyses, fasting insulin at the first visit did not appear to be a confounder and thus was not included in the models. We stratified by race and tested for interactions using the Wald test; associations did not differ by race, thus all results are shown combined. All analyses were conducted using SAS version 9.2 (Cary, NC). All tests were 2-sided; results were considered statistically significant if P<0.05.
Results
From 1990 to 2006, we ascertained 2,647 incident cancer cases in 169,048 person-years and 887 cancer deaths in 181,517 person-years. At baseline, 8.9% of the women and 8.6% of the men had diabetes. Participant characteristics are shown in Table 1. Cancer incidence and mortality rates were higher among men than women (Table 2, Table 3). However, diabetic women had both cancer incidence and mortality rates that were comparable to diabetic men.
Table 1.
Multivariable-adjusted baseline characteristics by glycated hemoglobin value in non-diabetic participants, and by diabetes in women and men in the Atherosclerosis Risk in Communities Study (ARIC).*
| Women | Men | |||||||
|---|---|---|---|---|---|---|---|---|
| Glycated Hemoglobin, % in Non-Diabetic Women |
Glycated Hemoglobin, % In Non-Diabetic Men |
|||||||
| <5.0 (N=510) |
5.0–5.6 (N=4,358) |
≥5.7 (N=1,509) |
Diabetes* (N=626) |
<5.0 (N=456) |
5.0–5.6 (N=3,483) |
≥5.7 (N=1,352) |
Diabetes* (N=499) |
|
| Glycated hemoglobin,% (SE) | 4.80 (0.04) |
5.38 (0.01) |
6.22 (0.02) |
8.60 (0.03) |
4.75 (0.03) |
5.38 (0.01) |
6.21 (0.02) |
8.15 (0.03) |
| Age, yr (SE)† | 54.4 (0.25) |
56.1 (0.08) |
57.9 (0.15) |
58.5 (0.22) |
55.9 (0.26) |
56.8 (0.10) |
58.3 (0.15) |
58.8 (0.25) |
| Race,% (SE) † | ||||||||
| Black | 14.0 (0.02) |
18.7 (0.01) |
51.4 (0.01) |
54.0 (0.02) |
17.4 (0.02) |
13.2 (0.01) |
35.5 (0.01) |
36.1 (0.02) |
| White | 86.0 (0.02) |
81.3 (0.01) |
48.6 (0.01) |
45.0 (0.02) |
82.6 (0.02) |
86.8 (0.01) |
64.4 (0.01) |
63.9 (0.02) |
| Education,% (SE) | ||||||||
| Less than high school | 18.2 (0.02) |
19.1 (0.01) |
27.0 (0.01) |
33.6 (0.02) |
16.6 (0.02) |
20.5 (0.01) |
26.4 (0.01) |
24.9 (0.02) |
| High school/equivalent | 42.0 (0.02) |
45.4 (0.01) |
46.3 (0.01) |
47.3 (0.02) |
34.8 (0.02) |
36.6 (0.01) |
37.1 (0.01) |
38.2 (0.02) |
| College or above | 39.8 (0.02) |
35.4 (0.01) |
26.7 (0.01) |
19.1 (0.02) |
48.6 (0.02) |
42.8 (0.01) |
36.5 (0.01) |
36.9 (0.02) |
| Smoking status,% (SE) | ||||||||
| Current | 12.7 (0.02) |
20.0 (0.01) |
26.6 (0.01) |
17.2 (0.02) |
13.6 (0.02) |
24.1 (0.01) |
31.0 (0.01) |
19.5 (0.02) |
| Former | 31.6 (0.02) |
27.9 (0.01) |
27.5 (0.01) |
28.7 (0.02) |
53.7 (0.02) |
48.4 (0.01) |
48.7 (0.01) |
52.6 (0.02) |
| Never | 55.6 (0.02) |
52.1 (0.01) |
48.9 (0.01) |
54.0 (0.02) |
32.6 (0.02) |
27.5 (0.01) |
20.2 (0.01) |
27.9 (0.02) |
| Body mass index, kg/m2 (SE) | 26.4 (0.25) |
27.3 (0.09) |
30.2 (0.15) |
31.5 (0.23) |
26.8 (0.19) |
27.1 (0.07) |
28.9 (0.11) |
30.0 (0.19) |
| Waist circumference, cm (SE) | 90.6 (0.67) |
93.5 (0.23) |
101.5 (0.40) |
106.8 (0.61) |
97.9 (0.51) |
98.5 (0.18) |
103.1 (0.30) |
106.3 (0.49) |
Means and proportions adjusted for age and race. P-values for all comparisons across glycated hemoglobin/diabetes categories were <0.001.
Mutually adjusted for age and race.
Table 2.
Multivariable-adjusted cancer incidence rates and hazard ratios of all cancer and major site-specific cancers by glycated hemoglobin value in non-diabetic participants, and by diabetes in the Atherosclerosis Risk in Communities Study (ARIC), 1990–2006.
| Glycated Hemoglobin, % in Non-Diabetic Participants |
|||||
|---|---|---|---|---|---|
| Women‡ | Total | <5.0 | 5.0–5.6 | ≥5.7 | Diabetes* |
| All Cancer | |||||
| No. of cases | 1,208 | 92 | 695 | 303 | 118 |
| Person yrs of follow-up | 95,313 | 7,081 | 60,796 | 20,064 | 7,372 |
| Incidence rate† | 1,280.1 | 1,388.2 | 1,138.7 | 1,551.0 | 1,604.9 |
| HR (95% CI)1 | 1.22 (0.98,1.52) |
1.00 (Ref) |
1.37 (1.19,1.58) |
1.47 (1.20,1.79) |
|
| HR (95% CI)2 | 1.27 (1.02,1.58) |
1.00 (Ref) |
1.24 (1.07,1.44) |
1.30 (1.06,1.60) |
|
| Post-menopausal Breast Cancer |
|||||
| No. of cases | 379 | 21 | 238 | 77 | 43 |
| Person yrs of follow-up | 81,071 | 5,264 | 50,795 | 18,248 | 6,764 |
| Incidence rate† | 458.2 | 399.2 | 447.0 | 420.1 | 647.3 |
| HR (95% CI)1 | 0.91 (0.58,1.42) |
1.00 (Ref) |
0.94 (0.72,1.23) |
1.41 (1.01,1.98) |
|
| HR (95% CI)2 | 0.94 (0.60,1.47) |
1.00 (Ref) |
0.88 (0.67,1.15) |
1.30 (0.92,1.83) |
|
| Lung Cancer | |||||
| No. of cases | 130 | 8 | 73 | 37 | 12 |
| Person yrs of follow-up | 95,313 | 7,081 | 60,796 | 20,064 | 7,372 |
| Incidence rate† | 138.6 | 138.8 | 119.4 | 192.1 | 147.7 |
| HR (95% CI) 1 | 1.09 (0.52,2.26) |
1.00 (Ref) |
1.61 (1.06,2.44) |
1.44 (0.77,2.69) |
|
| HR (95% CI) 2 | 1.00 (0.48,2.08) |
1.00 (Ref) |
1.29 (0.84,2.00) |
1.35 (0.71,2.59) |
|
| Colorectal Cancer | |||||
| No. of cases | 129 | 10 | 73 | 29 | 17 |
| Person yrs of follow-up | 95,313 | 7,081 | 60,796 | 20,064 | 7,372 |
| Incidence rate† | 134.5 | 169.4 | 123.5 | 140.2 | 205.6 |
| HR (95% CI) 1 | 1.27 (0.65,2.46) |
1.00 (Ref) |
1.10 (0.70,1.73) |
1.78 (1.03,3.08) |
|
| HR (95% CI) 2 | 1.31 (0.67,2.55) |
1.00 (Ref) |
0.99 (0.62,1.57) |
1.55 (0.88,2.75) |
|
| Men | |||||
| All Cancer | |||||
| No. of cases | 1,449 | 106 | 853 | 384 | 106 |
| Person yrs of follow-up | 73,735 | 6,014 | 45,501 | 16,470 | 5,750 |
| Incidence rate† | 1,982.1 | 2,023.6 | 1,979.2 | 2,187.3 | 1,653.8 |
| HR (95% CI)1 | 1.00 (0.82,1.22) |
1.00 (Ref) |
1.11 (0.98,1.26) |
0.87 (0.71,1.07) |
|
| HR (95% CI)2 | 1.04 (0.85,1.27) |
1.00 (Ref) |
1.08 (0.95,1.22) |
0.85 (0.69,1.05) |
|
| All Cancer minus Prostate Cancer |
|||||
| No. of cases | 876 | 67 | 513 | 228 | 68 |
| Person yrs of follow-up | 73,735 | 6,014 | 45,501 | 16,470 | 5,750 |
| Incidence rate† | 1,182.6 | 1,263.1 | 1,155.7 | 1,353.4 | 1,087.4 |
| HR (95% CI)1 | 1.07 (0.83,1.38) |
1.00 (Ref) |
1.17 (1.00,1.38) |
0.99 (0.77,1.28) |
|
| HR (95% CI)2 | 1.16 (0.90,1.50) |
1.00 (Ref) |
1.11 (0.95,1.31) |
0.96 (0.74,1.24) |
|
| Prostate Cancer | |||||
| No. of cases | 573 | 39 | 340 | 156 | 38 |
| Person yrs of follow-up | 73,735 | 6,014 | 45,501 | 16,470 | 5,750 |
| Incidence rate† | 799.5 | 760.5 | 823.5 | 833.9 | 566.4 |
| HR (95% CI) 1 | 0.90 (0.65,1.26) |
1.00 (Ref) |
1.02 (0.84,1.24) |
0.71 (0.51,1.00) |
|
| HR (95% CI) 2 | 0.88 (0.63,1.22) |
1.00 (Ref) |
1.02 (0.84,1.25) |
0.71 (0.84,1.25) |
|
| Lung Cancer | |||||
| No. of cases | 222 | 9 | 127 | 71 | 15 |
| Person yrs of follow-up | 73,735 | 6,014 | 45,501 | 16,470 | 5,750 |
| Incidence rate† | 302.2 | 190.9 | 298.4 | 423.4 | 259.2 |
| HR (95% CI) 1 | 0.59 (0.30,1.16) |
1.00 (Ref) |
1.39 (1.03,1.88) |
0.82 (0.48,1.41) |
|
| HR (95% CI) 2 | 0.71 (0.36,1.40) |
1.00 (Ref) |
1.27 (0.93,1.73) |
0.85 (0.49,1.46) |
|
| Colorectal Cancer | |||||
| No. of cases | 139 | 16 | 72 | 33 | 18 |
| Person yrs of follow-up | 73,735 | 6,014 | 45,501 | 16,470 | 5,750 |
| Incidence rate† | 189.2 | 277.3 | 165.9 | 196.4 | 282.1 |
| HR (95% CI) 1 | 1.79 (1.04,3.08) |
1.00 (Ref) |
1.16 (0.76,1.78) |
1.80 (1.07,3.05) |
|
| HR (95% CI) 2 | 1.84 (1.07,3.18) |
1.00 (Ref) |
1.04 (0.67,1.60) |
1.52 (0.88,2.60) |
|
Abbreviations: No., number; yrs, years; HR, Hazard Ratio; CI, Confidence Interval
A participant was classified as having diabetes if he/she self-reported a diagnosis of diabetes and/or were taking medication to treat diabetes at the first or second visit.
The rate per 100,000 women/men is given standardized to the age and race distribution in the analytic cohort.
The Cox proportional hazards models were adjusted for:
age (continuous) at the second visit, and race/ethnicity (white, black);
covariates in (1) and ARIC study site, education level (less than high school, high school/equivalent, college or above), cigarette smoking status (never, former, current), cigarette-years smoked (continuous), body mass index (continuous), and waist circumference (continuous).
The Cox proportional hazards models for women were also adjusted for post-menopausal hormone use (no, yes).
Table 3.
Multivariable-adjusted cancer mortality rates and hazard ratios of cancer mortality and major site-specific cancer mortality by glycated hemoglobin value in non-diabetic participants, and by diabetes in the Atherosclerosis Risk in Communities Study (ARIC), 1990–2006.
| Glycated Hemoglobin, % in Non-Diabetic Participants |
|||||
|---|---|---|---|---|---|
| Women‡ | Total | <5.0 | 5.0–5.6 | ≥5.7 | Diabetes* |
| All Cancer | |||||
| No. of cases | 372 | 33 | 180 | 110 | 49 |
| Person yrs of follow-up | 101,246 | 7,502 | 64,548 | 21,349 | 7,847 |
| Mortality rate† | 391.5 | 501.9 | 297.4 | 547.2 | 601.9 |
| HR (95% CI) 1 | 1.77 (1.22,2.58) |
1.00 (Ref) |
1.81 (1.41,2.32) |
2.25 (1.63,3.13) |
|
| HR (95% CI) 2 | 1.82 (1.25,2.64) |
1.00 (Ref) |
1.58 (1.23,2.05) |
1.96 (1.40,2.76) |
|
| Lung Cancer | |||||
| No. of cases | 105 | 7 | 55 | 31 | 12 |
| Person yrs of follow-up | 101,246 | 7,502 | 64,548 | 21,349 | 7,847 |
| Mortality rate† | 110.9 | 119.0 | 90.7 | 148.4 | 146.6 |
| HR (95% CI) 1 | 1.29 (0.59,2.85) |
1.00 (Ref) |
1.66 (1.04,2.63) |
1.77 (0.94,3.40) |
|
| HR (95% CI) 2 | 1.18 (0.53,2.60) |
1.00 (Ref) |
1.35 (0.83,2.21) |
1.73 (0.88,3.40) |
|
| Post-menopausal Breast Cancer |
|||||
| No. of cases | 40 | 4 | 19 | 8 | 9 |
| Person yrs of follow-up | 86,236 | 5,604 | 53,988 | 19,423 | 7,221 |
| Mortality rate† | 48.1 | 63.4 | 38.2 | 38.6 | 85.7 |
| HR (95% CI) 1 | 2.12 (0.72,6.27) |
1.00 (Ref) |
1.03 (0.44,2.44) |
3.22 (1.40,7.43) |
|
| HR (95% CI) 2 | 2.28 (0.77,6.75) |
1.00 (Ref) |
0.88 (0.37,2.13) |
2.34 (0.97,5.62) |
|
| Colorectal Cancer | |||||
| No. of cases | 29 | 5 | 14 | 6 | 4 |
| Person yrs of follow-up | 101,246 | 7,502 | 64,548 | 21,349 | 7,847 |
| Mortality rate† | 30.6 | 65.2 | 24.6 | 36.3 | 53.2 |
| HR (95% CI) 1 | 3.23 (1.15,9.04) |
1.00 (Ref) |
1.31 (0.48,3.57) |
2.49 (0.79,7.90) |
|
| HR (95% CI) 2 | 3.30 (1.17,9.24) |
1.00 (Ref) |
1.18 (0.43,3.27) |
2.25 (0.68,7.46) |
|
|
Men | |||||
| All Cancer | |||||
| No. of cases | 515 | 32 | 300 | 143 | 40 |
| Person yrs of follow-up | 80,271 | 6,513 | 49,472 | 18,121 | 6,165 |
| Mortality rate† | 641.3 | 602.7 | 649.9 | 728.0 | 595.3 |
| HR (95% CI)1 | 0.88 (0.61,1.27) |
1.00 (Ref) |
1.16 (0.94,1.42) |
0.94 (0.67,1.31) |
|
| HR (95% CI) 2 | 0.97 (0.67,1.40) |
1.00 (Ref) |
1.08 (0.87,1.33) |
0.92 (0.66,1.30) |
|
| All Cancer minus Prostate Cancer |
|||||
| No. of cases | 471 | 27 | 280 | 125 | 39 |
| Person yrs of follow-up | 80,271 | 6,513 | 49,472 | 18,121 | 6,165 |
| Mortality rate† | 584.4 | 515.2 | 601.8 | 647.4 | 583.9 |
| HR (95% CI) 1 | 0.79 (0.53,1.18) |
1.00 (Ref) |
1.11 (0.89,1.37) |
1.00 (0.71,1.40) |
|
| HR (95% CI) 2 | 0.89 (0.60,1.32) |
1.00 (Ref) |
1.01 (0.80,1.26) |
0.92 (0.65,1.30) |
|
| Lung Cancer | |||||
| No. of cases | 182 | 7 | 104 | 60 | 11 |
| Person yrs of follow-up | 80,271 | 6,513 | 49,472 | 18,121 | 6,165 |
| Mortality rate† | 225.7 | 132.8 | 221.1 | 315.1 | 172.3 |
| HR (95% CI) 1 | 0.56 (0.26,1.20) |
1.00 (Ref) |
1.41 (1.02,1.96) |
0.74 (0.39,1.39) |
|
| HR (95% CI) 2 | 0.65 (0.30,1.40) |
1.00 (Ref) |
1.31 (0.94,1.84) |
0.81 (0.43,1.52) |
|
| Colorectal Cancer | |||||
| No. of cases | 46 | 5 | 25 | 10 | 6 |
| Person yrs of follow-up | 80,271 | 6,513 | 49,472 | 18,121 | 6,165 |
| Mortality rate† | 57.2 | 89.0 | 60.4 | 51.7 | 91.6 |
| HR (95% CI) 1 | 1.66 (0.63,4.34) |
1.00 (Ref) |
0.97 (0.46,2.06) |
1.69 (0.68,4.20) |
|
| HR (95% CI) 2 | 1.73 (0.66,4.53) |
1.00 (Ref) |
0.86 (0.40,1.85) |
1.51 (0.59,3.81) |
|
| Prostate Cancer | |||||
| No. of cases | 44 | 5 | 20 | 18 | 1 |
| Person yrs of follow-up | 80,271 | 6,513 | 49,472 | 18,121 | 6,165 |
| Mortality rate† | 56.9 | 87.5 | 48.0 | 80.6 | 11.4 |
| HR (95% CI) 1 | 2.15 (0.80,5.74) |
1.00 (Ref) |
1.81 (0.93,3.51) |
0.29 (0.04,2.18) |
|
| HR (95% CI) 2 | 2.06 (0.77,5.52) |
1.00 (Ref) |
1.65 (0.84,3.25) |
0.25 (0.03,1.91) |
|
Abbreviations: No., number; yrs, years; HR, Hazard Ratio; CI, Confidence Interval
A participant was classified as having diabetes if they self-reported a diagnosis of diabetes and/or were taking medication to treat diabetes at the first or second visits.
The rate per 100,000 women/men is given, standardized to the age and race distribution in the analytic cohort.
The Cox proportional hazards models were adjusted for:
age (continuous) at the second visit, and race/ethnicity (white, black);
covariates in (1) and ARIC study site, education level (less than high school, high school/equivalent, college or above), cigarette smoking status (never, former, current), cigarette-years smoked (continuous), body mass index (continuous), and waist circumference (continuous).
The Cox proportional hazards models for women were also adjusted for post-menopausal hormone use (no, yes).
Cancer incidence among non-diabetic adults
Among non-diabetic women, those in the ≥5.7% category had a 24% higher cancer incidence compared with those in the 5.0–5.6% category, (Table 2, Fig. 1A). When evaluated by diabetes diagnostic cut-points, cancer incidence was elevated among both women at risk for diabetes (≥5.7–6.4% HR:1.25, 96%CI:1.07–1.46) and women with undiagnosed diabetes (≥6.5% HR:1.20, 96%CI: 0.91–1.58) compared with women in the 5.0–5.6% category. Non-diabetic women in the <5.0% category had a 27% higher cancer incidence (Table 2); this association was stronger after excluding incident cancers diagnosed in the first half of follow-up (data not shown). When the full spectrum of glycated hemoglobin values was evaluated, cancer risk increased as glycated hemoglobin decreased below 5.0%; whereas risk increased and plateaued as glycated hemoglobin increased above 5.0% (p-for-linearity=0.0011, Fig. 1A). Non-diabetic women in the ≥5.7% or <5.0% categories did not have statistically significantly higher incidence of major site-specific cancers compared with those in the 5.0–5.6% category (Table 2).
Figure 1. Multivariable-adjusted hazard ratio of cancer incidence and glycated hemoglobin using restricted quadratic splines with knots at the 10th, 50th, and 90th percentiles.
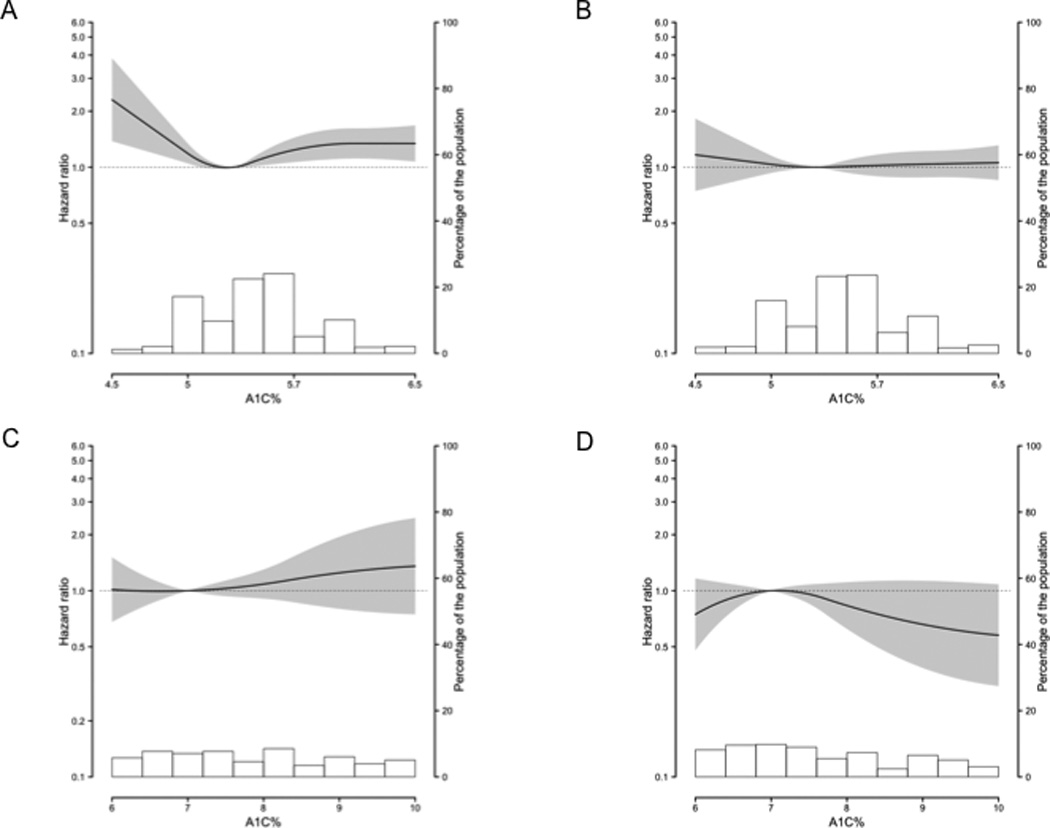
Gray shading represents 95% confidence interval; background histogram, distribution of glycated hemoglobin in the sub-population. All models adjusted for age (continuous) at the second visit, race/ethnicity (white, black), ARIC study site, education level (less than high school, high school/equivalent, college or above), cigarette smoking status (never, former, current), cigarette-years smoked (continuous), body mass index (continuous), and waist circumference (continuous). A: Among non-diabetic women; 5.0% reference; also adjusted for post-menopausal hormone use (no, yes). B: Among non-diabetic men; 5.0% reference. C: Among diabetic women; 7.0% reference; also adjusted for post-menopausal hormone use. D: Among diabetic men; 7.0% reference.
Cancer incidence was not higher in non-diabetic men in the ≥5.7% and <5.0% categories compared with those in the 5.0–5.6% category, even after excluding prostate cancer, which has a known inverse association with diabetes8 (Table 2; Fig. 1B). When evaluated by diabetes diagnostic cut-points, cancer incidence was not higher in men at risk for diabetes (≥5.7–6.4% HR:1.07, 96%CI:0.94–1.23) and men with undiagnosed diabetes (≥6.5% HR:1.10, 96%CI: 0.85–1.43). Non-diabetic men with glycated hemoglobin values ≥5.7% did not have higher site-specific cancer incidence compared with those in the 5.0–5.6% category (Table 2). Non-diabetic men in the <5.0% category had a statistically significantly higher risk of colorectal cancer.
Cancer incidence among diabetic adults
Diabetic women had a 30% higher cancer incidence compared with non-diabetic women in the 5.0–5.6% category (Table 2). Diabetic women did not have statistically significantly higher site-specific cancer incidence compared with non-diabetic women in the 5.0–5.6% category (Table 2). However, diabetic women had a non-significant increased risk of post-menopausal breast cancer and colorectal cancer when compared to non-diabetic women in the 5.0–5.6% category (Table 2). Among diabetic women, cancer incidence did not differ between those with glycated hemoglobin values ≤7.0% and >7.0% (HR:0.89, 96%CI: 0.59–1.33, Fig 1C).
Diabetic men did not have higher overall, or site-specific cancer incidence compared with non-diabetic men in the 5.0–5.6% category (Table 2). However, diabetic men had a non-significant increased risk of colorectal cancer when compared to non-diabetic men in the 5.0–5.6% category (Table 2). Among diabetic men, cancer incidence did not differ between those with glycated hemoglobin values ≤7.0% and >7.0% (all cancer HR:1.11, 96%CI: 0.73–1.68, Fig 1D; all cancer minus prostate cancer HR:0.98, 96%CI: 0.58–1.65).
Cancer mortality among non-diabetic adults
Non-diabetic women in the ≥5.7% category had a 58% higher risk of cancer mortality compared with those in the 5.0–5.6% category (Table 3, Fig. 2A). Cancer mortality was elevated among both women at risk for diabetes (≥5.7–6.4% HR:1.62, 96%CI:1.24–2.11) and women with undiagnosed diabetes (≥6.5% HR:1.45, 96%CI: 0.90–2.32). Non-diabetic women in the <5.0% category had an 82% higher risk of cancer mortality (Table 3); this association was unchanged after excluding cancer deaths in the first half of follow-up (data not shown). When the full spectrum of glycated hemoglobin values was evaluated, the risk of cancer death greatly increased as glycated hemoglobin decreased below 5.0%; risk also increased as glycated hemoglobin increased above 5.0% (p-for-linearity<0.0001, Fig. 2A). Non-diabetic women in the ≥5.7% category did not have higher major site-specific cancer mortality compared with those in the 5.0–5.6% category (Table 3). Non-diabetic women in the <5.0% category had three times the risk of dying of colorectal cancer, but not other cancers.
Figure 2. Multivariable-adjusted hazard ratio of cancer mortality and glycated hemoglobin using restricted quadratic splines with knots at the 10th, 50th, and 90th percentiles.
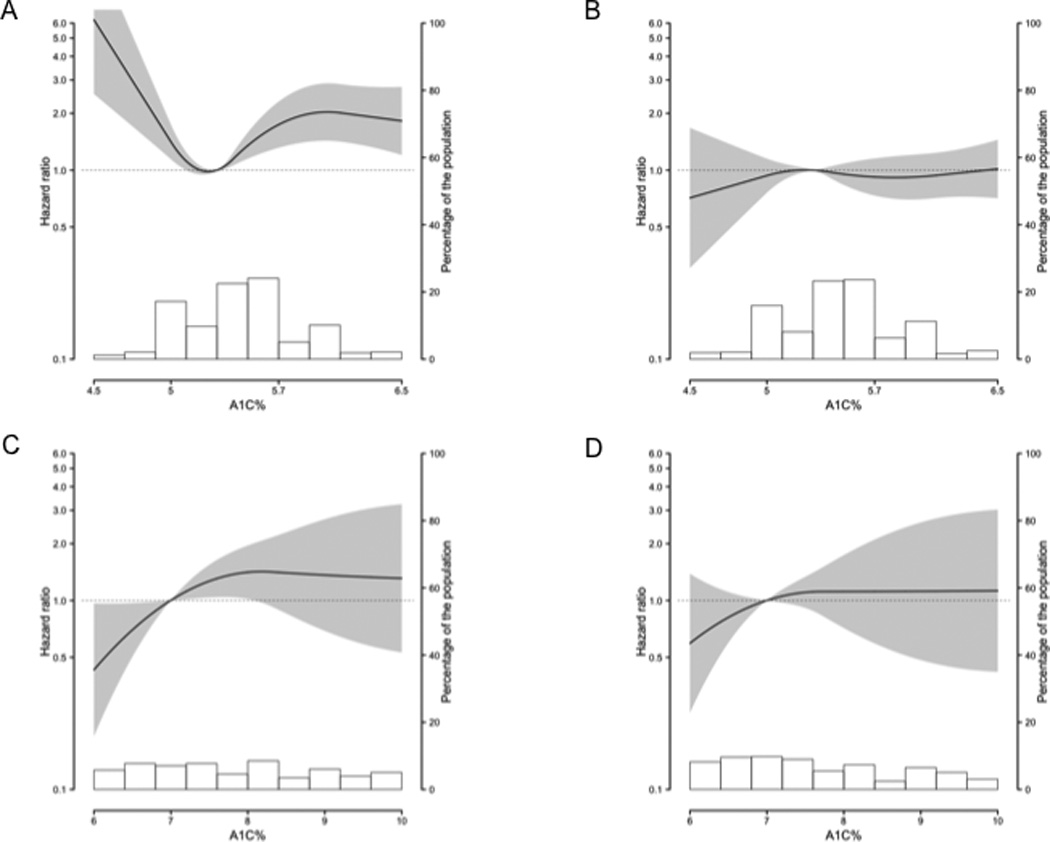
Gray shading represents 95% confidence interval; background histogram, distribution of glycated hemoglobin in the sub-population. All models adjusted for age (continuous) at the second visit, race/ethnicity (white, black), ARIC study site, education level (less than high school, high school/equivalent, college or above), cigarette smoking status (never, former, current), cigarette-years smoked (continuous), body mass index (continuous), and waist circumference (continuous). A: Among non-diabetic women; 5.0% reference; also adjusted for post-menopausal hormone use (no, yes). B: Among non-diabetic men; 5.0% reference. C: Among diabetic women; 7.0% reference; also adjusted for post-menopausal hormone use. D: Among diabetic men; 7.0% reference.
Non-diabetic men in the ≥5.7% or <5.0% categories did not have a higher risk of cancer mortality compared with those in the 5.0–5.6% category, even after excluding prostate cancer (Table 3, Fig. 3B, Fig 3C). Similarly, cancer mortality was not elevated among men at risk for diabetes (≥5.7–6.4% HR:1.04, 96%CI:0.83–1.30) and men with undiagnosed diabetes (≥6.5% HR:1.30, 96%CI: 0.86–1.95). Non-diabetic men in the ≥5.7% or 5.0% categories did not have higher site-specific cancer mortality compared with those in the 5.0–5.6% category (Table 3).
Cancer mortality among diabetic adults
Diabetic women had twice the risk of cancer mortality compared with non-diabetic women in the 5.0–5.6% category (Table 3). Diabetic women did not have a higher risk of site-specific cancer mortality, except possibly for post-menopausal breast cancer (Table 3). Among diabetic women, those with glycated hemoglobin values ≤7.0% had a 52% lower risk of cancer mortality compared with those with values >7.0% (HR:0.48, 96%CI: 0.24–0.97). When the full spectrum of glycated hemoglobin values was evaluated, risk of cancer mortality decreased as glycated hemoglobin decreased below 7.0%; whereas risk of cancer mortality increased as glycated hemoglobin increased above 7.0% (p-for-linearity=0.0224, Fig 2D).
Diabetic men did not have a higher risk of cancer mortality, total cancer mortality minus prostate cancer, or site-specific cancer mortality compared with non-diabetic men in the 5.0–5.6% category (Table 3). Among diabetic men, risk of cancer mortality did not differ between those with glycated hemoglobin values ≤7.0% and >7.0% (all cancer HR:0.79, 96%CI: 0.49–1.57, Fig. 3D; all cancer minus prostate cancer HR:0.72, 96%CI: 0.36–1.45).
Discussion
In this prospective cohort study, non-diabetic women with elevated glycated hemoglobin values, even below the level to diagnose diabetes, had a significantly elevated risk of cancer incidence and mortality compared to those with values in the normal range. Diabetic women also had a significantly increased risk of cancer incidence and mortality. Among diabetic women, those with good glycemic control (glycated hemoglobin ≤7%) had a lower risk of cancer mortality. Interestingly, low glycated hemoglobin values among non-diabetic women were also associated with an increased risk of cancer incidence and mortality. Glycated hemoglobin values in non-diabetic and diabetic men, and diabetes were not statistically significantly associated with total cancer incidence or death; this finding is most likely due to the null association between glycated hemoglobin and the two most common cancers among men in ARIC, prostate and lung. Our findings suggest that glycemia values outside the normal range may influence the burden of cancer in women.
Our findings for non-diabetic women are consistent with most previous prospective studies that have evaluated glycated hemoglobin as a risk factor for cancer incidence,20 and cancer mortality,21–23 but not all.24 While these studies did not stratify by sex, several prospective studies of fasting blood glucose have.12, 13, 15, 16 We found an association between hyperglycemia and cancer risk in women, but not men; this is consistent with two studies of fasting glucose,15, 16 but not two others that found similar associations by sex.12, 13 This discrepancy may be partly due to differences in the proportion of specific cancers represented in the study populations. For example, the prior cohorts that found positive associations in men had higher proportions of liver cancer among men, which was strongly associated with hyperglycemia, than in ARIC. In ARIC, the major cancers among men were prostate and lung, which were not significantly associated with hyperglycemia in this cohort. Our observations were supported by the site-specific analyses among men in the previous prospective studies of fasting blood glucose and cancer risk; all four studies also reported no statistically significant association with prostate cancer risk.12, 13, 15, 16 Similarly, three of the four studies found no statistically significant association between fasting glucose and lung cancer risk among men;12, 13, 15 and one reported a positive association.16 Given the most common cancers among men in ARIC were not associated with glycated hemoglobin, findings supported by previous studies of fasting glucose and cancer risk, our observation that glycated hemoglobin was not statistically significantly associated with total cancer risk among men is not unexpected.
Hyperglycemia may directly influence cancer risk. Cancers require more glucose to generate energy than normal non-proliferative tissue.32 Thus, hyperglycemia may enhance cancer cell growth. Hyperglycemia may also be a surrogate marker for obesity, and/or associated metabolic perturbations, like hyperinsulinemia,10 which has been associated with cancer risk.4 Insulin may influence cancer risk directly by signaling through the insulin receptor or indirectly, by affecting the insulin-like growth factor (IGF) axis, which influences cell proliferation.33 However, our findings were independent of adiposity, as measured by both BMI and waist circumference. Further, though we were unable to adjust for insulin values at the second visit, adjustment for insulin values at the first visit did not change our findings.
We found elevated glycated hemoglobin was more strongly associated with fatal than incident cancers, consistent with the two prospective studies that evaluated fasting blood glucose and both cancer incidence and mortality.12, 16 While the biological mechanisms underlying this observation could differ by cancer site, this may indicate that glucose levels are more relevant to cancer progression than cancer initiation. Alternatively, individuals with abnormal glycated hemoglobin values may be diagnosed with cancer at later stages due to differences in access to care, or in cancer screening behaviors.
We found that while men had an overall higher cancer incidence and cancer mortality rate than women, the cancer incidence and cancer mortality rate among diabetic women was comparable to that of diabetic men. We also observed that diabetic women had a higher risk of cancer incidence and mortality, though diabetic men did not have a statistically significantly higher risk, even after excluding prostate cancer. In a recent meta-analysis, diabetes was associated with an increased risk of cancer incidence and mortality; the association with mortality was stronger for women than men, and there was significant heterogeneity among studies.34 Our results were consistent with approximately half of the studies included in the pooled risk estimates.34 Discrepancies across studies may be partially explained by the specific cancers represented in the diverse study populations. Among site-specific cancers, diabetes has been positively associated with colorectal and breast cancers.10, 17 Our findings were consistent with this previous work. While not statistically significant, diabetes was positively associated with colorectal cancer incidence and mortality in both men and women, and with breast cancer incidence and mortality in women.
Importantly, we observed that diabetic women with good glycemic control (glycated hemoglobin ≤7%),11 had a 52% lower risk of cancer death. This finding is consistent with one prospective study that evaluated cancer mortality and glycated hemoglobin values among diabetic women,22 but not two other studies that evaluated diabetic men and women together.24, 25 More work is needed to determine if glycemic control after diabetes diagnosis can reduce cancer mortality.
To our knowledge, this is the first study to find a positive association between low glycated hemoglobin and cancer incidence in women. Low glycated hemoglobin was also associated with a marked increased risk of cancer death among women. Low glycated hemoglobin may be a marker for poor health overall, or for cancer before it is detected. However, in our analysis, reverse causation did not appear to account for these findings; analyses excluding cases that occurred during the first half of follow-up did not change our inferences. Low glycated hemoglobin, in men and women, has been associated with increased risk of all cause mortality;23, 29, 35–37 and cancer mortality in one,23 but not another study.36 Additional research is needed to better characterize those with low glycated hemoglobin.
Our study had several limitations. We relied on one measurement of glycated hemoglobin as a marker of hyperglycemia. Diagnosis of diabetes was self-reported and not validated, but reports were supplemented participant use of diabetes medication. We could not distinguish between type 1 diabetes and type 2 diabetes; however, type 2 diabetes accounts for up to 95% of all diagnosed diabetes in the United States.38 Although black participants had higher average glycated hemoglobin than white participants, findings were similar between groups. Outcomes were obtained through cancer registries supplemented by community surveillance and participant follow-up, though information on stage and grade of cancer at diagnosis was not available. Sample sizes were small for site-specific cancer evaluation.
In this community-based prospective cohort study, elevated glycated hemoglobin was associated with an approximately 25% increased risk of cancer incidence and 60% increased risk of mortality among non-diabetic women. Diabetic women had double the risk of cancer mortality. Glycated hemoglobin and diabetes were not statistically significantly associated with cancer risk in men. Diabetic women with good glycemic control had a decreased risk of cancer mortality. Our study suggests the maintenance of normal glycated hemoglobin values among non-diabetic adults, and good glycemic control among diabetic adults, may reduce the burden of cancer, especially in women.
Novelty Statement: This is the first prospective cohort study to examine the association between glycated hemoglobin values and cancer incidence and mortality, in both non-diabetic and diabetic men and women.
Impact Statement: Our findings suggest that the maintenance of normal glycated hemoglobin values among non-diabetic women, and good glycemic control among diabetic adults, may be beneficial for the prevention and control of cancer, as well as diabetes.
Acknowledgements
The ARIC study is carried out as a collaborative study supported by National Heart, Lung, and Blood Institute contracts N01-HC-55015, N01-HC-55016, N01-HC-55018, N01-HC-55019, N01-HC-55020, N01-HC-55021, and N01-HC-55022. The authors thank the staff and participants of the ARIC study for their important contributions.
Glycated hemoglobin assays were supported by the National Institute of Diabetes and Digestive and Kidney Diseases (R21 DK080294 and K01 DK076595, to Dr. Selvin). Dr. Selvin was also supported by NIH/NIDDK grant R01 DK089174.
Dr. Joshu, Dr. Menke, and Mr. Dluzniewski were supported by National Cancer Institute grant T32 CA009314 (to Dr. Platz); Dr. Joshu was also supported by The Seraph Foundation. Dr. Prizment was supported by National Cancer Institute grant T32 CA132670.
Footnotes
Disclaimers: The content of this manuscript is solely the responsibility of the authors and does not necessarily represent the official views of the National Heart, Lung, and Blood Institute or the National Cancer Institute or the National Institutes of Health. Some cancer incidence data have been provided by the Maryland Cancer Registry, Center for Cancer Surveillance and Control, Department of Mental Health and Hygiene, 201 W. Preston Street, Room 400, Baltimore, MD 21201. We acknowledge the State of Maryland, the Maryland Cigarette Restitution Fund, and the National Program of Cancer Registries (NPCR of the Centers for Disease Control and Prevention (CDC)) for the funds that helped support the availability of the cancer registry data.
References
- 1.Larsson SC, Wolk A. Diabetes mellitus and incidence of kidney cancer: a meta-analysis of cohort studies. Diabetologia. 2011;54:1013–1018. doi: 10.1007/s00125-011-2051-6. [DOI] [PubMed] [Google Scholar]
- 2.Mitri J, Castillo J, Pittas AG. Diabetes and risk of Non-Hodgkin's lymphoma: a meta-analysis of observational studies. Diabetes Care. 2008;31:2391–2397. doi: 10.2337/dc08-1034. [DOI] [PMC free article] [PubMed] [Google Scholar]
- 3.Friberg E, Orsini N, Mantzoros CS, Wolk A. Diabetes mellitus and risk of endometrial cancer: a meta-analysis. Diabetologia. 2007;50:1365–1374. doi: 10.1007/s00125-007-0681-5. [DOI] [PubMed] [Google Scholar]
- 4.Giovannucci E, Michaud D. The role of obesity and related metabolic disturbances in cancers of the colon, prostate, and pancreas. Gastroenterology. 2007;132:2208–2225. doi: 10.1053/j.gastro.2007.03.050. [DOI] [PubMed] [Google Scholar]
- 5.Larsson SC, Mantzoros CS, Wolk A. Diabetes mellitus and risk of breast cancer: a meta-analysis. Int J Cancer. 2007;121:856–862. doi: 10.1002/ijc.22717. [DOI] [PubMed] [Google Scholar]
- 6.El-Serag HB, Hampel H, Javadi F. The association between diabetes and hepatocellular carcinoma: a systematic review of epidemiologic evidence. Clin Gastroenterol Hepatol. 2006;4:369–380. doi: 10.1016/j.cgh.2005.12.007. [DOI] [PubMed] [Google Scholar]
- 7.Larsson SC, Orsini N, Brismar K, Wolk A. Diabetes mellitus and risk of bladder cancer: a meta-analysis. Diabetologia. 2006;49:2819–2823. doi: 10.1007/s00125-006-0468-0. [DOI] [PubMed] [Google Scholar]
- 8.Kasper JS, Giovannucci E. A meta-analysis of diabetes mellitus and the risk of prostate cancer. Cancer Epidemiol Biomarkers Prev. 2006;15:2056–2062. doi: 10.1158/1055-9965.EPI-06-0410. [DOI] [PubMed] [Google Scholar]
- 9.Tande AJ, Platz EA, Folsom AR. The metabolic syndrome is associated with reduced risk of prostate cancer. Am J Epidemiol. 2006;164:1094–1102. doi: 10.1093/aje/kwj320. [DOI] [PubMed] [Google Scholar]
- 10.Giovannucci E, Harlan DM, Archer MC, Bergenstal RM, Gapstur SM, Habel LA, Pollak M, Regensteiner JG, Yee D. Diabetes and cancer: a consensus report. Diabetes Care. 2010;33:1674–1685. doi: 10.2337/dc10-0666. [DOI] [PMC free article] [PubMed] [Google Scholar]
- 11.Standards of medical care in diabetes--2009. Diabetes Care. 2009;32(Suppl 1):S13–S61. doi: 10.2337/dc09-S013. [DOI] [PMC free article] [PubMed] [Google Scholar]
- 12.Jee SH, Ohrr H, Sull JW, Yun JE, Ji M, Samet JM. Fasting serum glucose level and cancer risk in Korean men and women. Jama. 2005;293:194–202. doi: 10.1001/jama.293.2.194. [DOI] [PubMed] [Google Scholar]
- 13.Rapp K, Schroeder J, Klenk J, Ulmer H, Concin H, Diem G, Oberaigner W, Weiland SK. Fasting blood glucose and cancer risk in a cohort of more than 140,000 adults in Austria. Diabetologia. 2006;49:945–952. doi: 10.1007/s00125-006-0207-6. [DOI] [PubMed] [Google Scholar]
- 14.Dankner R, Chetrit A, Segal P. Glucose tolerance status and 20 year cancer incidence. Isr Med Assoc J. 2007;9:592–596. [PubMed] [Google Scholar]
- 15.Stattin P, Bjor O, Ferrari P, Lukanova A, Lenner P, Lindahl B, Hallmans G, Kaaks R. Prospective study of hyperglycemia and cancer risk. Diabetes Care. 2007;30:561–567. doi: 10.2337/dc06-0922. [DOI] [PubMed] [Google Scholar]
- 16.Stocks T, Rapp K, Bjorge T, Manjer J, Ulmer H, Selmer R, Lukanova A, Johansen D, Concin H, Tretli S, Hallmans G, Jonsson H, et al. Blood glucose and risk of incident and fatal cancer in the metabolic syndrome and cancer project (me-can): analysis of six prospective cohorts. PLoS Med. 2009;6:e1000201. doi: 10.1371/journal.pmed.1000201. [DOI] [PMC free article] [PubMed] [Google Scholar]
- 17.Seshasai SR, Kaptoge S, Thompson A, Di Angelantonio E, Gao P, Sarwar N, Whincup PH, Mukamal KJ, Gillum RF, Holme I, Njolstad I, Fletcher A, et al. Diabetes mellitus, fasting glucose, and risk of cause-specific death. N Engl J Med. 2011;364:829–841. doi: 10.1056/NEJMoa1008862. [DOI] [PMC free article] [PubMed] [Google Scholar]
- 18.Diagnosis and classification of diabetes mellitus. Diabetes Care. 2010;33(Suppl 1):S62–S69. doi: 10.2337/dc10-S062. [DOI] [PMC free article] [PubMed] [Google Scholar]
- 19.Meigs JB, Nathan DM, Cupples LA, Wilson PW, Singer DE. Tracking of glycated hemoglobin in the original cohort of the Framingham Heart Study. J Clin Epidemiol. 1996;49:411–417. doi: 10.1016/0895-4356(95)00513-7. [DOI] [PubMed] [Google Scholar]
- 20.Travier N, Jeffreys M, Brewer N, Wright CS, Cunningham CW, Hornell J, Pearce N. Association between glycosylated hemoglobin and cancer risk: a New Zealand linkage study. Ann Oncol. 2007;18:1414–1419. doi: 10.1093/annonc/mdm135. [DOI] [PubMed] [Google Scholar]
- 21.Nakanishi S, Yamada M, Hattori N, Suzuki G. Relationship between HbA(1)c and mortality in a Japanese population. Diabetologia. 2005;48:230–234. doi: 10.1007/s00125-004-1643-9. [DOI] [PubMed] [Google Scholar]
- 22.Levitan EB, Liu S, Stampfer MJ, Cook NR, Rexrode KM, Ridker PM, Buring JE, Manson JE. HbA1c measured in stored erythrocytes and mortality rate among middle-aged and older women. Diabetologia. 2008;51:267–275. doi: 10.1007/s00125-007-0882-y. [DOI] [PMC free article] [PubMed] [Google Scholar]
- 23.Silbernagel G, Grammer TB, Winkelmann BR, Boehm BO, Marz W. Glycated Hemoglobin Predicts All-Cause, Cardiovascular, and Cancer Mortality in People Without a History of Diabetes Undergoing Coronary Angiography. Diabetes Care. 2011;34:1355–1361. doi: 10.2337/dc10-2010. [DOI] [PMC free article] [PubMed] [Google Scholar]
- 24.Saydah S, Tao M, Imperatore G, Gregg E. GHb level and subsequent mortality among adults in the U.S. Diabetes Care. 2009;32:1440–1446. doi: 10.2337/dc09-0117. [DOI] [PMC free article] [PubMed] [Google Scholar]
- 25.Moss SE, Klein R, Klein BE, Meuer SM. The association of glycemia and cause-specific mortality in a diabetic population. Arch Intern Med. 1994;154:2473–2479. [PubMed] [Google Scholar]
- 26.The Atherosclerosis Risk in Communities (ARIC) Study: design objectives. The ARIC investigators. Am J Epidemiol. 1989;129:687–702. [PubMed] [Google Scholar]
- 27.Selvin E, Coresh J, Zhu H, Folsom A, Steffes MW. Measurement of HbA1c from stored whole blood samples in the Atherosclerosis Risk in Communities study. J Diabetes. 2010;2:118–124. doi: 10.1111/j.1753-0407.2010.00070.x. [DOI] [PMC free article] [PubMed] [Google Scholar]
- 28.Diagnosis and classification of diabetes mellitus. Diabetes Care. 2011;34(Suppl 1):S62–S69. doi: 10.2337/dc11-S062. [DOI] [PMC free article] [PubMed] [Google Scholar]
- 29.Selvin E, Steffes MW, Zhu H, Matsushita K, Wagenknecht L, Pankow J, Coresh J, Brancati FL. Glycated hemoglobin, diabetes, and cardiovascular risk in nondiabetic adults. N Engl J Med. 2010;362:800–811. doi: 10.1056/NEJMoa0908359. [DOI] [PMC free article] [PubMed] [Google Scholar]
- 30.Schmidt MI, Watson RL, Duncan BB, Metcalf P, Brancati FL, Sharrett AR, Davis CE, Heiss G. Clustering of dyslipidemia, hyperuricemia diabetes, and hypertension and its association with fasting insulin and central and overall obesity in a general population Atherosclerosis Risk in Communities Study Investigators. Metabolism. 1996;45:699–706. doi: 10.1016/s0026-0495(96)90134-1. [DOI] [PubMed] [Google Scholar]
- 31.Atherosclerosis Risk in Communities Coordinating Center. Operations manual no. 2: cohort component procedures, version 1.0. Chapel Hill: University of North Carolina School of Public Health; 1987. [Google Scholar]
- 32.Vander Heiden MG, Cantley LC, Thompson CB. Understanding the Warburg effect: the metabolic requirements of cell proliferation. Science. 2009;324:1029–1033. doi: 10.1126/science.1160809. [DOI] [PMC free article] [PubMed] [Google Scholar]
- 33.Pollack MN. Insulin, insulin-like growth factors, insulin resistance, and neoplasia. Am J Clin Nutr. 2007;86:s820–S822. doi: 10.1093/ajcn/86.3.820S. [DOI] [PubMed] [Google Scholar]
- 34.Noto H, Tsujimoto T, Sasazuki T, Noda M. Significantly Increased Risk of Cancer in Patients with Diabetes Mellitus. Endocr Pract. 2011:1–44. doi: 10.4158/EP10357.RA. [DOI] [PubMed] [Google Scholar]
- 35.Stout RL, Fulks M, Dolan VF, Magee ME, Suarez L. Relationship of hemoglobin A1c to mortality in nonsmoking insurance applicants. J Insur Med. 2007;39:174–181. [PubMed] [Google Scholar]
- 36.Brewer N, Wright CS, Travier N, Cunningham CW, Hornell J, Pearce N, Jeffreys M. A New Zealand linkage study examining the associations between A1C concentration and mortality. Diabetes Care. 2008;31:1144–1149. doi: 10.2337/dc07-2374. [DOI] [PubMed] [Google Scholar]
- 37.Carson AP, Fox CS, McGuire DK, Levitan EB, Laclaustra M, Mann DM, Muntner P. Low hemoglobin A1c and risk of all-cause mortality among US adults without diabetes. Circ Cardiovasc Qual Outcomes. 2010;3:661–667. doi: 10.1161/CIRCOUTCOMES.110.957936. [DOI] [PMC free article] [PubMed] [Google Scholar]
- 38.Centers for Disease Control and Prevention. National Diabetes Fact Sheet: national estimates and general information on diabetes and prediabetes in the United States, 2011. Atlanta, GA: Department of Health and Human Services, Centers for Disease Control and Prevention; 2011. [Google Scholar]