

Abstract
Epithelial ovarian cancer (EOC) is the leading cause of gynecological-related cancer deaths in the United States. There is, therefore, an urgent need to develop novel therapeutic strategies for this devastating disease. Cellular senescence is a state of stable cell growth arrest that acts as an important tumor suppression mechanism. Ribonucleotide reductase M2 (RRM2) plays a key role in regulating the senescence-associated cell growth arrest by controlling biogenesis of 2'-deoxyribonucleoside 5′-triphosphates (dNTPs). The role of RRM2 in EOC remains poorly understood. Here we show that RRM2 is expressed at higher levels in EOCs compared with either normal ovarian surface epithelium (P < 0.001) or fallopian tube epithelium (P < 0.001). RRM2 expression significantly correlates with the expression of Ki67, a marker of cell proliferation (P < 0.001). Moreover, RRM2 expression positively correlates with tumor grade and stage, and high RRM2 expression independently predicts a shorter overall survival in EOC patients (P < 0.001). To delineate the functional role of RRM2 in EOC, we knocked down RRM2 expression in a panel of EOC cell lines. Knockdown of RRM2 expression inhibits the growth of human EOC cells. Mechanistically, RRM2 knockdown triggers cellular senescence in these cells. Notably, this correlates with the induction of the DNA damage response, a known mediator of cellular senescence. These data suggest that targeting RRM2 in EOCs by suppressing its activity is a novel pro-senescence therapeutic strategy that has the potential to improve survival of EOC patients.
Keywords: epithelial ovarian cancer, cellular senescence, ribonucleotide reductase M2 (RRM2), DNA damage response, cell proliferation
Introduction
Ovarian cancer is the most lethal gynecological malignancy and the fifth leading cancer-related cause of death among women in the United States.1 The vast majority of ovarian cancers (>85%) are categorized as epithelial ovarian cancer (EOC).2 EOCs are classified into distinct histological types including serous, mucinous, endometrioid, and clear cell.2 The most common histology of EOC is serous (~60% of all cancers), and less common histologies include endometrioid, clear cell, and mucinous.3 Recently, an alternative classification has been proposed, in which EOC is broadly divided into 2 types.4 Type I EOC includes mucinous, low-grade serous, low-grade endometrioid, and clear cell carcinomas, and type II EOC includes high-grade serous and high-grade endometrioid carcinomas.4 Although significant advances have occurred in the field of therapeutics for solid tumors, cancer mortality in women with ovarian cancer has remained at the same level for over 2 decades.5 Unfortunately, the molecular etiology of ovarian cancer remains to be fully elucidated.5 Therefore, there is a great need to identify molecular factors that are predictive of clinical outcome and, more importantly, explore the feasibility of targeting these newly identified factors to develop urgently needed EOC therapies.
Ribonucleotide reductase (RNR) catalyzes the conversion of ribonucleoside 5′-diphosphates into their corresponding 2′-deoxyribonucleoside 5′-triphosphates (dNTPs), the building blocks of DNA that are necessary for both DNA replication and repair.6 Ribonucleotide reductase M2 (RRM2) is the regulatory subunit of RNR that is necessary for dNTP biogenesis during the S phase of the cell cycle when DNA replication occurs.7 Tumor cells are characterized by an uncontrolled proliferation, and synthesis of DNA is necessary for this process. Consistently, RRM2 is known to play an active role during tumorigenesis8 and has been suggested as a potential target for developing cancer therapeutics.9 In addition, RRM2 is implicated in mediating resistance to cancer chemotherapy.10 RRM2 is a known prognostic biomarker for several cancer types such as colon, breast, and pancreas.11-13 Indeed, several inhibitors of RRM2 have entered clinical trials for these cancer types.9,14,15 However, the role of RRM2 in EOC remains poorly understood.
Cellular senescence is a state of stable cell growth arrest that can be induced by a variety of triggers, including critically shortened telomeres, activated oncogenes, DNA damage, and certain cancer therapeutics such as cisplatin.16 Senescent cells have unique morphological and molecular characteristics, including a large, flat morphology and increased activity of β-galactosidase (termed senescence-associated β-galactosidase or SA-β-gal).17 Importantly, reactivation of the senescence-promoting pathways, such as p53 in murine cancer models, leads to senescence of cancer cells and associated tumor regression.18-20 Therefore, induction of senescence represents a novel mechanism for developing cancer therapeutics.21,22 Notably, RRM2 plays a critical role in establishing and maintaining the senescence-associated cell growth arrest induced by activated oncogenes.23 RRM2 is suppressed during senescence, and its overexpression is sufficient to overcome senescence. This correlates with the changes in DNA damage response during senescence.23-26 Interestingly, senescence induced by C-MYC depletion in melanoma cells suppresses RRM2 expression and the subsequent depletion of dNTP pools.24 This raises the possibility that RRM2 is a bona fide target for driving cancer cells to undergo senescence and the associated stable cell growth arrest and, thus, represents a target for the development of pro-senescence therapies. However, this has never been tested in EOCs.
In this study, we determined that RRM2 protein expression is higher in EOC cancer cell lines compared with normal human ovarian surface epithelial cells. Likewise, RRM2 is significantly upregulated in EOC specimens compared with either normal human ovarian surface epithelium or fallopian tube epithelium. RRM2 expression in EOC significantly correlates with an increase in the expression of Ki67, a marker of cell proliferation. Using an independent data set, we validated that RRM2 is expressed at a higher level in EOCs compared with normal human ovarian surface epithelial cells. In addition, RRM2 expression positively correlates with tumor stage and grade in EOC patients. Importantly, there was a significant reverse correlation between RRM2 expression and overall survival in EOC patients. Functionally, suppression of RRM2 activity by knocking down its expression in EOC cells inhibited the proliferation of these cells. Mechanistically, RRM2 knockdown induces senescence of EOC cells, which correlates with an increase of DNA damage in these cells, a known trigger of senescence. These data show that RRM2 expression is an independent prognostic factor for EOC patients and suggest that targeting RRM2 represents a novel strategy for developing urgently needed EOC therapy by inducing EOC cells to undergo senescence.
Results
RRM2 is often upregulated in EOCs compared with either normal human ovarian surface epithelium or fallopian tube epithelium
To determine whether RRM2 is upregulated in EOC cell lines, we examined the protein expression level of RRM2 in 3 individual isolations of normal human ovarian epithelial (HOSE) cells and 9 different human EOC cell lines by immunoblotting. RRM2 protein levels were higher in all examined human EOC cell lines compared with the HOSE cells (Fig. 1A). The RRM2 antibody is specific, because only 1 band appears in immunoblotting analysis, and a short hairpin RNA to the human RRM2 gene (shRRM2) that efficiently knocks down RRM2 expression decreases the intensity of the single band detected by the anti-RRM2 antibody (Fig. S1A). Next, we sought to determine whether RRM2 upregulation also occurs in human EOC specimens. Toward this goal, we examined the expression of RRM2 by immunohistochemical (IHC) staining analysis in 105 cases of EOCs and 35 normal human ovary specimens. Recent evidence suggests that a proportion of EOCs may arise from the distal fallopian tube epithelial cells.27,28 Thus, we also included 36 normal human fallopian tube specimens in our study. The cytoplasm of EOC cells was positive for RRM2 IHC staining (Fig. 1B). In contrast, RRM2 staining in normal human ovarian surface epithelial cells or fallopian tube epithelial cells was nearly negative (Fig. 1B). The anti-RRM2 antibody-staining signal was specific, because blocking anti-RRM2 antibody binding with a specific blocking peptide significantly decreased the IHC signal (Fig. S1B). RRM2 expression was scored as high (H score ≥50) or low (H score <50) based on a histological score as previously described,29,30 which considers both percentage and intensity of the staining signal. RRM2 was scored as high in 43.8% (46/105) of human EOCs. In contrast, RRM2 was scored high in 0% (0/35) and 2.8% (1/36) of normal human ovarian surface epithelium and fallopian tube epithelium, respectively (Table 1). Statistical analysis revealed that RRM2 was expressed at significantly higher levels in human EOCs compared with either normal human ovarian surface epithelium (P < 0.001) or fallopian tube epithelium (P < 0.001) (Table 1). We conclude that RRM2 is expressed at significantly higher levels in EOCs compared with either normal human ovarian surface epithelium or fallopian tube epithelium.
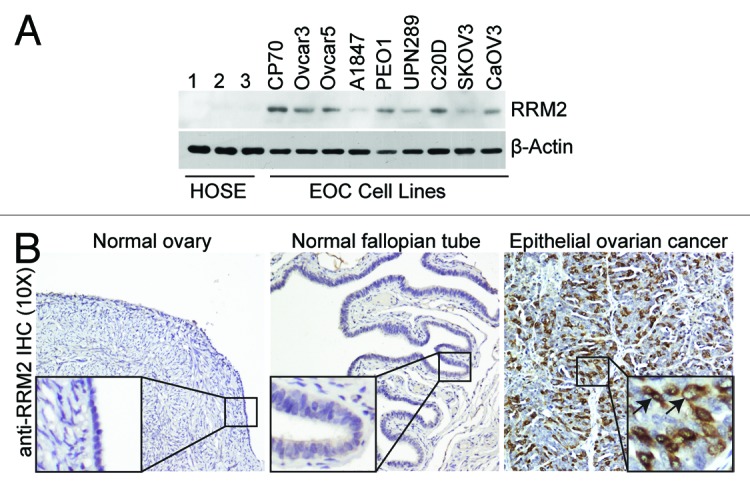
Figure 1. RRM2 is upregulated in EOC cells and tumor specimens. (A) Expression of RRM2 protein in 3 individual isolations of normal human ovarian surface epithelial (HOSE) cells and the indicated human EOC cell lines by immunoblotting. β-actin was used as a loading control. (B) Immunohistochemical staining of RRM2 protein expression in normal ovary, normal fallopian tube, and human EOC tissue specimens. Shown is an example of a high-grade serous EOC tissue specimen. Arrows point to the RRM2 positively stained EOC cells.
Table 1. RRM2 protein expression; correlation between RRM2 expression and Ki67 cell proliferation marker or clinicopathological variables.
| Patient characteristics | low (n) | high (n) | total (n) | high (%) | P |
|---|---|---|---|---|---|
| Normal epithelial tissue | |||||
| Normal ovary | 35 | 0 | 35 | 0.0% | <0.001* |
| Normal fallopian tube | 35 | 1 | 36 | 2.8% | <0.001** |
| Epithelial ovarian cancer | 59 | 46 | 105 | 43.8% | |
| Type I | 14 | 5 | 19 | 26.3% | |
| Low-grade serous | 5 | 0 | 5 | ||
| Mucinous | 3 | 0 | 3 | ||
| Low-grade endometrioid | 2 | 1 | 3 | ||
| Clear cell | 4 | 4 | 8 | ||
| Type II | 45 | 41 | 86 | 47.7% | |
| High-grade serous | 41 | 34 | 75 | ||
| High-grade endometrioid | 4 | 7 | 11 | ||
| Age | |||||
| ≤55 | 20 | 20 | 40 | 50.0% | |
| >55 | 39 | 26 | 65 | 40.0% | 0.316 |
| Ki67# | |||||
| 0–10% | 15 | 1 | 16 | 6.3% | |
| 10–40% | 14 | 5 | 19 | 26.3% | |
| 40–100% | 27 | 40 | 67 | 59.7% | <0.001 |
| Undetermined | 3 | 0 | 3 |
*Compared with epithelial ovarian cancer, P < 0.001; **Compared with high grade serous epithelial ovarian cancer, P < 0.001; #Spearman Rank Order Correlation also showed Ki67 positively corelated with RRM2 (P < 0.001, rs = 0.551).
Since RRM2 expression regulates dNTP biogenesis, which is necessary for DNA replication during cell proliferation,6 we sought to determine whether RRM2 expression correlates with cell proliferation in EOC specimens. Toward this goal, we stained the same set of EOC specimens with an antibody against Ki67, a marker of cell proliferation. Indeed, there is a significant correlation between expression of RRM2 and Ki67 in EOC specimens (Table 1), inferring a role for RRM2 in promoting the proliferation of EOC cells. Thus, we conclude that the RRM2 expression positively correlates with the cell proliferation marker Ki67 in EOCs.
High RRM2 expression positively correlates with tumor stage and grade and independently predicts a shorter overall survival in EOC patients
Next, we wanted to validate our findings in an independent data set. Toward this goal, we analyzed 2 published independent EOC gene expression profile microarray data sets with clinical annotations.31,32 The first data set included 99 individual EOC specimens (37 endometrioid, 41 serous, 13 mucinous, and 8 clear cell histosubtypes) and 4 individual normal ovary samples, while the second data set included 285 EOC specimens (18 borderline tumors and 267 EOC specimens of various grades and stages). Corroborating with our IHC results (Table 1), RRM2 was significantly upregulated in EOC specimens compared with normal tissue (Fig. 2A). There was also a significant increase in RRM2 expression in EOC specimens compared with non-invasive ovarian tumors of low malignant potential (i.e., borderline tumors) (Fig. 2B). Additionally, RRM2 expression was significantly increased in advanced compared with early stage EOCs (Fig. 2C). Further, RRM2 expression significantly increased with tumor grade of EOCs (Fig. 2D). Finally, RRM2 expression was significantly increased in all 4 major EOC histosubtypes compared with normal controls (Fig. 2E).

Figure 2. RRM2 expression correlates with tumor grade and stage and is a poor prognostic marker in EOC patients. (A) RRM2 is upregulated in EOC specimens (n = 99) compared with normal ovarian surface epithelium samples (n = 4).31 * P < 1 × 10⁻⁷, false discovery rate (FDR) < 1 × 10⁻⁷. (B). RRM2 is upregulated in invasive serous EOC specimens (n = 246) compared with non-invasive, borderline serous tumors of low malignant potential (n = 18).32 *P < 1 × 10⁻⁷, FDR < 1 × 10⁻⁷. (C) RRM2 is upregulated in advanced stage (stage 3 and 4) EOC specimens (n = 239) compared with early stage (stage 1 and 2) EOC specimens (n = 42).32 *P = 0.0199, FDR = 0.0199. (D) RRM2 is upregulated in grade 2 EOCs (n = 97) compared with grade 1 EOCs (n = 19) and in grade 3 EOCs (n = 164) compared with grade 1 or grade 2 EOCs.32 * P < 0.001. Grade 1 vs. grade 2: P = 0.0003, FDR = 0.0006. Grade 1 vs. grade 3: P < 1 × 10⁻⁷, FDR < 1 × 10⁻⁷. Grade 2 vs. grade 3: P = 3.04 × 10⁻⁵ FDR = 3.04 × 10⁻⁵. (E) RRM2 is upregulated in serous (41 samples), endometrioid (n = 37), mucinous (n = 13), and clear cell (n = 8) histotypes of EOCs compared with normal human ovarian surface epithelium (n = 4).31 *P < 0.0002. Endometrioid vs. normal P = 2.3 × 10⁻⁶, FDR = 4.6 × 10⁻⁶. Serous vs. normal P = 4.4 × 10⁻⁶ FDR = 8.8 × 10⁻⁶. Mucinous vs. normal P = 0.00013, FDR = 0.0003. Clear cell vs. normal P = 8.4 × 10⁻⁵, FDR = 0.00017. (F) RRM2 is higher in C1 (n = 83), C2 (n = 50), C4 (n = 46), and C5 (n = 36) EOC molecular subtypes compared with C3 (n = 28), and C6 (n = 8).32 * P < 1 × 10⁻⁷, FDR < 1 × 10⁻⁷. C3 vs. C1, C3 vs. C2, C3 vs. C4, and C3 vs. C5: all are statistically significant at the level of P < 0.01 and FDR < 0.01. C6 vs. C1, C6 vs. C2, C6 vs. C4, and C6 vs. C5: all are statistically significant at the level of P < 0.01 and FDR < 0.01. (G) High RRM2 expression predicates a shorter overall survival in EOC patients. Kaplan–Meier curves of overall survival for EOC patients with high RRM2 expression (C1, C2, C4, and C5 EOC molecular subtypes) or low RRM2 expression (C3 and C6 molecular subtypes). Median overall survival 44 mo for high RRM2 vs. 69 mo for low RRM2 in EOC patients.32 Log rank P < 0.001, Cox P = 0.004 and hazard ratio (HR) for high RRM2 EOC patients = 1.77. Adjusted Cox P = 0.02 and HR = 1.58.
We also evaluated RRM2 expression among the 6 molecular subtypes of EOCs as previously defined by Tothill et al. based on gene expression profiling.32 We found that subtypes C3 and C6 had significantly lower RRM2 expression compared with the other subtypes (Fig. 2F). Notably, C3 and C6 molecular subtypes predominantly consist of serous borderline and low-grade and early-stage endometrioid tumors, respectively.32 In contrast, the vast majority of type II high-grade serous and high-grade endometrioid EOCs segregate with C1, C2, C4, and C5 molecular subtypes.32 Consistent with our finding that RRM2 expression correlates with the expression of the cell proliferation marker Ki67 (Table 1), RRM2 low-expressing C3 and C6 molecular subtypes are characterized by low expression of cell proliferation markers.32 Together, these data validate the finding that RRM2 is often upregulated in EOC and show that RRM2 expression positively correlates with tumor grade and stage in EOC specimens.
Next, we sought to determine whether there is an association between RRM2 expression and the survival of EOC patients. Toward this goal, we compared the overall survival of EOC patients with low RRM2 expression (C3 and C6 molecular subtypes) to the patients with high RRM2 expression (C1, C2, C4 and C5 molecular subtypes). EOC patients with high RRM2 expression (n = 215) had significantly worse overall survival compared with those with low RRM2 expression (n = 36) (Fig. 2G, median overall survival 44 vs. 69 m, log rank P < 0.001). Of note, multivariate analysis showed that the association of high RRM2 expression with worse survival was independent of stage and grade (adjusted HR = 1.58, Cox P = 0.02). Thus, we conclude that high RRM2 expression independently predicts a shorter overall survival in EOC patients.
Knockdown of RRM2 inhibits the growth of EOC cells
Our data indicate that RRM2 is often upregulated in EOC, and its expression correlates with the expression of Ki67, a cell proliferation marker (Table 1). Next, we sought to determine the effects of knockdown of RRM2 in EOC cells on the proliferation of these cells. Toward this goal, we developed 2 individual shRRM2s. The knockdown efficacy of shRRM2s was confirmed by immunoblotting in SKOV3 EOC cells (Fig. 3A). Notably, RRM2 knockdown significantly decreased BrdU incorporation, which identifies actively proliferating cells in the S phase of the cell cycle, in SKOV3 cells (Fig. 3B–C). Consistently, the growth of SKOV3 cells was notably inhibited by knockdown of RRM2 as evidenced by cell growth curve analysis (Fig. 3D). Additionally, a decreased ability to form colonies in both anchorage-dependent and anchorage-independent experiments was observed in shRRM2-expressing cells compared with controls (Fig. 3E–G). The growth inhibition was observed in cells expressing 2 individual shRRM2s, and there is a correlation between the efficacy of knockdown and the rate of growth inhibition (Fig. 3). This suggests that the observed phenotypes are not due to potential off-target effects. In addition, similar results were observed in OVCAR5 and PEO1 EOC cells (Fig. S2), showing that this is not a cell line-specific phenomenon. Taken together, we conclude that knockdown of RRM2 expression inhibits the growth of human EOC cells.

Figure 3. Knockdown of RRM2 inhibits cell growth and proliferation of EOC cells. (A) SKOV3 EOC cells were infected with control or 2 individual shRRM2-encoding lentivirus and selected with 3 μg/ml puromycin. The expression of RRM2 was determined in drug-selected cells by immunoblotting. β-actin was used as a loading control. (B) Same as (A) but labeled with 10 μM BrdU for 30 min to identify the cells that are actively undergoing DNA replication, and the incorporated BrdU was visualized by immunofluorescence staining. DAPI counterstaining was used to visualize cell nuclei. (C) Quantification of (B) 200 cells from each of the indicated groups were examined for BrdU incorporation. Mean of 3 independent experiments with SEM *P < 0.01 compared with controls. (D) Same as (A) but an equal number of cells (3000 cells/well) were seeded in 6-well plates, and the number of cells was counted at the indicated time points. Mean of 3 independent experiments with SD *P < 0.05 compared with controls. (E) Same as (D), but after 2 weeks of culture the plates were stained with 0.05% crystal violet in PBS to visualize focus formation. Shown are representative images of 3 independent experiments. (F) Same as (D), but cells were seeded into soft agar, and 2 weeks later, the colonies were visualized with bright field fluorescence. Shown are representative images of 3 independent experiments. (G) Quantification of (F). Colonies were stained with 1% crystal violet and counted. Mean of 3 independent experiments with SEM *P < 0.05 compared with controls.
Knockdown of RRM2 induces senescence of EOC cells, which correlates with an increase in DNA damage
Next, we sought to determine the mechanism by which RRM2 knockdown suppresses the growth of human EOC cells. Notably, markers of apoptosis such as cleaved caspase 3, cleaved Lamin A, and cleaved PARP p85 were not induced by RRM2 knockdown in human EOC cells (Fig. S3A). RRM2 plays a key role in regulating the establishment and maintenance of senescence and the associated cell growth arrest.23 Thus, we sought to determine whether RRM2 knockdown induces senescence of human EOC cells. Toward this goal, we examined the expression of SA-β-gal activity, a universal marker of cellular senescence,17 in control and RRM2 knocking down EOC cells. Indeed, knockdown of RRM2 in SKOV3 EOC cells significantly increased SA-β-gal activity compared with control cells (Fig. 4A and B). It has been shown that RRM2 expression regulates senescence through affecting the DNA damage response due to its role in dNTP biogenesis, which is necessary for both DNA replication and repair.23 In addition, it has been demonstrated that the DNA damage is a trigger for cellular senescence.22 Thus, we sought to determine whether senescence induced by RRM2 knockdown is due to an increase in DNA damage. Toward this goal, we examined the expression of markers of DNA damage such as protein expression of γH2AX and γH2AX and 53BP1 foci formation in RRM2-knockdown cells. Compared with controls, there was a significant increase in γH2AX protein expression and γH2AX and 53BP1 foci formation in RRM2-knockdown cells (Fig. 4C–E). Similar results were observed in multiple EOC cell lines such as OVCAR5 and PEO1 cells (Fig. S3B–G), suggesting that the observed effects are not cell line-specific. We next sought to determine whether inhibition of RRM2 activity mimics RRM2 knockdown in inducing senescence and the DNA damage response in EOC cells. Indeed, treatment of EOC cells with 3-AP, a known inhibitor of RRM2 activity,33,34 also induced a significant increase in expression of markers of senescence and DNA damage in EOC cells (Fig. S3H–L). These data indicate that knockdown or inhibition of RRM2 activity induces senescence through an increase in DNA damage. Finally, we wanted to determine whether addition of exogenous nucleosides suppresses the senescence phenotype induced by RRM2 knockdown. Toward this goal, we supplemented the media with exogenous nucleosides in RRM2-knockdown cells. Exogenous nucleosides significantly decreased the SA-β-gal activity in RRM2-knockdown cells (Fig. 4F–G). Additionally, exogenous nucleosides significantly decreased the DNA damage observed in RRM2-knockdown cells (Fig. 4H–J). This was not due to an increase in RRM2 levels, because addition of nucleosides had no effect on RRM2 knockdown (Fig. 4H). These results support the idea that senescence and DNA damage induced by RRM2 knockdown is mediated by a decrease in dNTP levels. Taken together, these results demonstrate that knockdown or inhibition of RRM2 activity suppresses the growth of human EOC cells by triggering the DNA damage response and, ultimately, inducing cellular senescence.

Figure 4. Knockdown of RRM2 induces senescence of EOC cells, which correlates with an increase in DNA damage. (A) SKOV3 cells were infected with control or 2 individual shRRM2-encoding lentivirus and selected with 3 μg/ml puromycin. After 7 d in culture, cells were stained for SA-β-gal activity. (B) Quantification of (A). Two hundred cells from each of the indicated groups were examined for SA-β-gal activity. Mean of 3 independent experiments with SEM *P < 0.05 compared with controls. (C) Same as (A), but RRM2 and γH2AX expression were determined by immunoblotting. β-actin was used as a loading control. (D) Same as (A), but γH2AX and 53BP1 foci formation were determined by immunofluorescence. (E) Quantification of (D). Two hundred cells from each of the indicated groups were examined for γH2AX and 53BP1 foci. Mean of 3 independent experiments with SEM *P < 0.05 compared with controls. (F) SKOV3 cells were infected with control or an shRRM2-encoding lentivirus with or without addition of 250 nM of exogenous nucleosides and selected with in with 3 μg/ml puromycin. After 7 d in culture, cells were stained for SA-β-gal activity. (G) Quantification of (F). Two hundred cells from each of the indicated groups were examined for SA-β-gal activity. Mean of 3 independent experiments with SEM. *P < 0.05 compared with controls. #P < 0.05 compared with shRRM2 alone cells. (H) Same as (F) but γH2AX and RRM2 protein expression was determined by immunoblotting. β-actin was used as a loading control. (I) Same as (F) but γH2AX and 53BP1 foci formation were determined by immunofluorescence. (J) Quantification of (I). Two hundred cells from each of the indicated groups were examined for γH2AX and 53BP1 foci. Mean of 3 independent experiments with SEM *P < 0.05 compared with controls. #P < 0.05 compared with shRRM2 alone cells.
Discussion
In this study, we found that RRM2 is often upregulated in EOC cell lines and in EOC specimens compared with normal controls, which positively correlates with expression of the cell proliferation marker Ki67 and independently predicts a shorter overall survival in EOC patients. We also found that knockdown of RRM2 in EOC cells inhibits the proliferation and growth of these cells. Mechanistically, we found that knockdown of RRM2 induces a DNA damage response, which ultimately causes the EOC cells to senesce. Taken together, these data indicate that RRM2 is a poor prognostic factor for EOC, and inhibiting its activity represents a novel strategy for developing urgently needed EOC therapeutics by driving EOC cells to undergo senescence.
We found that RRM2 is significantly upregulated in EOC compared with normal tissue or borderline ovarian tumors in 3 independent cohorts (Fig. 1 and 2; Table 1), which corroborates with data from recent studies that show RRM2 is overexpressed in EOCs.35,36 RRM2 upregulation is sufficient to overcome the senescence-associated cell growth arrest tumor suppression mechanism,23-26 implying that RRM2 may drive proliferation of transformed cells. Indeed, we observed that RRM2 expression positively correlates with the expression of the cell proliferation marker Ki67 (Table 1). Consistently, RRM2 knockdown or activity inhibition using 3-AP in human EOC cells suppresses the proliferation of these cells by triggering cellular senescence (Fig. 4; Fig. S3). Together, these data indicate that the elevated levels of RRM2 observed in human EOC cells promote the proliferation of these cells by inhibiting the cellular senescence tumor-suppressing mechanism. Inducing cancer cells to undergo senescence has recently been described as a potential therapeutic strategy.21,22 Indeed, recent studies from our lab and others have shown that induction of senescence pathways in tumor cells can cause tumor growth inhibition or regression.19,20,37 The current study establishes that RRM2 is a potential target for developing pro-senescence therapy for EOC.
Here, we found that there was a significant increase in RRM2 expression in invasive EOCs compared with borderline ovarian tumors (Fig. 2B). Additionally, RRM2 expression increased with increasing tumor stage and grade (Fig. 2C and D) and in more invasive molecular subtypes (Fig. 2F), suggesting that RRM2 expression could delineate early vs. late-stage and aggressive tumors. Consistently, there was a significant inverse correlation between RRM2 expression and the overall survival of EOC patients (Fig. 2G). However, the association between RRM2 and overall survival is independent of tumor stage and grade (adjusted HR = 1.58, Cox P = 0.02). This indicates that RRM2 expression correlates with disease progression and could be used as a novel independent prognostic biomarker for EOC patients.
The p53 and pRB tumor-suppressor pathways are key senescence effectors.16,38,39 Notably, p53 is null in both the OVCAR5 and SKOV3 cell lines and is mutated in the PEO1 cell line.37,40 In addition, p16 is deleted in all 3 EOC cell lines used.41 As knockdown of RRM2 in these cells was able to induce senescence (Fig. 4; Fig. S3), it must be independent of both p53 and p16. This indicates that human cancer cells that lack functional p53 and p16 retain the capacity to undergo senescence through suppressing RRM2. These data suggest that RRM2 is a bona fide target for driving EOC cells to undergo senescence. Several drugs, such as hydroxyurea, gemcitabine, and triapine, are thought to inhibit RRM2 activity; however, none of them is specific, which results in adverse side effects.9 Indeed, nonspecific toxicities associated with these drugs hamper their clinical applications. Therefore, more specific RRM2 inhibitors will need to be tested to determine whether specific RRM2 inhibition is sufficient to drive the senescence of EOC cells.
Interestingly, an increase in DNA damage was observed in human EOC cells with RRM2 knockdown (Fig. 4; Fig. S3) or treated with the RRM2 inhibitor 3-AP (Fig. S3J–L). This phenotype was rescued by addition of exogenous nucleosides (Fig. 4H–J), supporting the notion that RRM2 regulates senescence through its role in dNTP biosynthesis. This suggests that senescence induced by RRM2 knockdown is mediated by the DNA damage response, one of the hallmarks of senescence and a known inducer of senescence.16,22,42 These results are consistent with previous reports from our lab and others.23-26 Cisplatin, which is the primary front-line chemotherapy used for EOC,5 also induces DNA damage.43 Therefore, it is interesting to speculate whether there might be synergism between RRM2 inhibition and cisplatin treatment to increase the DNA damage to a threshold beyond which senescence would occur. This may lead to the conversion of transient growth arrest induced by a low dose of cisplatin to a stable senescence-associated cell growth, which may have less side effects and a better clinical outcome.22 Furthermore, in patients with BRCA1 or BRCA2 mutations, poly ADP ribose polymerase (PARP) inhibitors have shown promise due to synthetic lethality after DNA damage.44 It will be interesting to test whether RRM2 inhibition in combination with PARP inhibitors could lead to synthetic lethality in cells with mutated BRCA1/BRCA2.
In conclusion, the present study showed that RRM2 is often upregulated in EOC, and high RRM2 expression independently predicts poor prognosis for EOC patients. We also found that suppressing RRM2 activity leads to growth inhibition through a cellular senescence mechanism via the DNA damage response. Together, our data suggest that inhibition of RRM2 to induce senescence of human EOC cells is a potential novel EOC therapeutic strategy.
Materials and Methods
Cells and culture conditions
Primary human ovarian surface epithelial (HOSE) cells were isolated and cultured as described previously.45 Human EOC cell lines were cultured in RPMI-1640 medium supplemented with 10% FBS according to ATCC and as previously described.45 Nucleosides were purchased from Sigma-Aldrich and used at a concentration of 250 nM. 3-AP (Sigma) was used at a concentration of 1 μM.
Human ovarian specimens and immunohistochemistry
The protocol to evaluate de-identified human tissue specimens was approved by the institutional review board. Ovarian tumor microarray and normal human ovary and fallopian tube specimens were obtained from the Fox Chase Cancer Center Biosample Repository Core Facility (BRCF). Histopathology of the selected specimens was provided by BRCF. Immunohistochemistry (IHC) was conducted by using goat anti-RRM2 polyclonal antibody (Santa Cruz Biotechnology) and mouse anti-Ki67 (Dako) with a Dako EnVision System and the Peroxidase (DAB) kit following the manufacturer’s instructions and as previously described.17 The RRM2 blocking peptide used to raise the anti-RRM2 antibody was purchased from Santa Cruz Biotechnologies and used undiluted to block the binding of the antibody.
Plasmids and antibodies
pLKO.1-shRRM2 plasmids were obtained from Open Biosystems (Waltham, MA). The following antibodies were obtained from the indicated suppliers: goat anti-RRM2 (Santa Cruz Biotechnology), mouse anti-γH2AX (Millipore), rabbit anti-53BP1 (Bethyl), mouse anti-BrdU FITC (BD Biosciences), rabbit anti-PARP p85 fragment (Promega), rabbit anti-cleaved caspase 3 (Cell Signaling), and mouse anti-β-actin (Sigma-Aldrich).
Lentivirus infections
Lentivirus was packaged using the Virapower Kit from Invitrogen following the manufacturer’s instructions as described previously.45-47 Cells infected with viruses encoding the puromycin-resistance gene were selected in 1 μg/ml puromycin.
Immunofluorescence, BrdU labeling, and SA-β-gal staining
Immunofluorescence staining and BrdU labeling for cultured cells was performed as described previously using antibodies described above.47-50 SA-β-Gal staining was performed as previously described.17
Colony formation assay, soft agar assay, and growth curve analysis
Growth curves were generated by plating an equal amount of cells (20 000 cells/well) and counting the cell number at the indicated time points. For colony formation, equal number of cells (3000 cells/well) was inoculated in 6-well plates and cultured for additional 2 wk. The colony formation was visualized by staining the plates with 0.05% crystal violet as previously described.47 Soft agar assays were performed as previously described.45
Data sets and statistical analysis
Raw gene expression data (Affymetrix CEL files) were retrieved from 2 previously reported clinically annotated microarray data sets31,32 from different institutions (University of Michigan31 and Peter MacCallum Cancer Center in Australia32). Both data sets are publicly available in Gene Expression Omnibus (GSE6008 and GSE9891, respectively) and were profiled on Affymetrix HG_U133A arrays (University of Michigan) and Affymetrix Human Genome U133 Plus 2.0 Array. Raw data were imported in BRB-ArrayTools Version: 4.2.0 (Biometrics Research Branch, National Cancer Institute) and were processed using Robust Multi-Array (RMA) analysis. The first data set included 99 individual epithelial ovarian tumors (37 endometrioid, 41 serous, 13 mucinous, and 8 clear cell carcinomas) and 4 individual normal ovary samples. The second data set included 285 epithelial ovarian cancers (18 borderline tumors and 267 invasive tumors) of various grades and stages.
Comparison of RRM2 expression levels between different classes (i.e., grades, histologies, stages, etc.) was performed using the class Comparison Between Groups of Arrays Tool of BRB-ArrayTools. Parametric t test or F test P values were reported for 2 or more classes, respectively. Overall survival curves were generated by the Kaplan–Meier method, and differences between survival curves were assessed for statistical significance with the log-rank test. SPSS (version 16; SPSS Inc) package was used for the survival analysis. The P values of all statistical tests were 2-sided.
Supplementary Material
Glossary
Abbreviations:
- dNTPs
2’-deoxyribonucleoside 5′-triphosphates
- EOC
epithelial ovarian cancer
- IHC
immunohistochemical
- RNR
ribonucleotide reductase
- RRM2
ribonucleotide reductase M2
- SA-β-gal
senescence-associated β-galactosidase
- shRRM2
short hairpin RNA to the human RRM2 gene
Disclosure of Potential Conflicts of Interest
No potential conflicts of interest were disclosed.
Grant Support
NIH/NCI grants (R01CA160331 and R01CA163377 to RZ), a DoD Ovarian Cancer Academy Award (OC093420 to RZ) and a NIH/NCI training grant (T32CA9171–35 to KMA).
Support of Core Facilities used in this study was provided by Cancer Center Support Grant (CCSG) CA010815 to The Wistar Institute.
Supplemental Materials
Supplemental materials may be found here: www.landesbioscience.com/journals/cc/article/26953
Footnotes
Previously published online: www.landesbioscience.com/journals/cc/article/26953
References
- 1.Siegel R, Naishadham D, Jemal A. Cancer statistics, 2013. CA Cancer J Clin. 2013;63:11–30. doi: 10.3322/caac.21166. [DOI] [PubMed] [Google Scholar]
- 2.Arulkumaran S, Regan L, Farquharson DIM. Obstetrics and gynaecology. Oxford: Oxford University Press, 2011. [Google Scholar]
- 3.Farley J, Ozbun LL, Birrer MJ. Genomic analysis of epithelial ovarian cancer. Cell Res. 2008;18:538–48. doi: 10.1038/cr.2008.52. [DOI] [PMC free article] [PubMed] [Google Scholar]
- 4.Shih IeM, Kurman RJ. Ovarian tumorigenesis: a proposed model based on morphological and molecular genetic analysis. Am J Pathol. 2004;164:1511–8. doi: 10.1016/S0002-9440(10)63708-X. [DOI] [PMC free article] [PubMed] [Google Scholar]
- 5.Vaughan S, Coward JI, Bast RC, Jr., Berchuck A, Berek JS, Brenton JD, Coukos G, Crum CC, Drapkin R, Etemadmoghadam D, et al. Rethinking ovarian cancer: recommendations for improving outcomes. Nat Rev Cancer. 2011;11:719–25. doi: 10.1038/nrc3144. [DOI] [PMC free article] [PubMed] [Google Scholar]
- 6.Nordlund P, Reichard P. Ribonucleotide reductases. Annu Rev Biochem. 2006;75:681–706. doi: 10.1146/annurev.biochem.75.103004.142443. [DOI] [PubMed] [Google Scholar]
- 7.Engström Y, Eriksson S, Jildevik I, Skog S, Thelander L, Tribukait B. Cell cycle-dependent expression of mammalian ribonucleotide reductase. Differential regulation of the two subunits. J Biol Chem. 1985;260:9114–6. [PubMed] [Google Scholar]
- 8.Furuta E, Okuda H, Kobayashi A, Watabe K. Metabolic genes in cancer: their roles in tumor progression and clinical implications. Biochim Biophys Acta. 2010;1805:141–52. doi: 10.1016/j.bbcan.2010.01.005. [DOI] [PMC free article] [PubMed] [Google Scholar]
- 9.Shao J, Zhou B, Chu B, Yen Y. Ribonucleotide reductase inhibitors and future drug design. Curr Cancer Drug Targets. 2006;6:409–31. doi: 10.2174/156800906777723949. [DOI] [PubMed] [Google Scholar]
- 10.Lin ZP, Belcourt MF, Cory JG, Sartorelli AC. Stable suppression of the R2 subunit of ribonucleotide reductase by R2-targeted short interference RNA sensitizes p53(-/-) HCT-116 colon cancer cells to DNA-damaging agents and ribonucleotide reductase inhibitors. J Biol Chem. 2004;279:27030–8. doi: 10.1074/jbc.M402056200. [DOI] [PubMed] [Google Scholar]
- 11.Liu X, Zhang H, Lai L, Wang X, Loera S, Xue L, He H, Zhang K, Hu S, Huang Y, et al. Ribonucleotide reductase small subunit M2 serves as a prognostic biomarker and predicts poor survival of colorectal cancers. Clin Sci (Lond) 2013;124:567–78. doi: 10.1042/CS20120240. [DOI] [PMC free article] [PubMed] [Google Scholar]
- 12.Fujita H, Ohuchida K, Mizumoto K, Itaba S, Ito T, Nakata K, Yu J, Kayashima T, Souzaki R, Tajiri T, et al. Gene expression levels as predictive markers of outcome in pancreatic cancer after gemcitabine-based adjuvant chemotherapy. Neoplasia. 2010;12:807–17. doi: 10.1593/neo.10458. [DOI] [PMC free article] [PubMed] [Google Scholar]
- 13.Jones DT, Lechertier T, Mitter R, Herbert JM, Bicknell R, Jones JL, Li JL, Buffa F, Harris AL, Hodivala-Dilke K. Gene expression analysis in human breast cancer associated blood vessels. PLoS One. 2012;7:e44294. doi: 10.1371/journal.pone.0044294. [DOI] [PMC free article] [PubMed] [Google Scholar]
- 14.Wadler S, Makower D, Clairmont C, Lambert P, Fehn K, Sznol M. Phase I and pharmacokinetic study of the ribonucleotide reductase inhibitor, 3-aminopyridine-2-carboxaldehyde thiosemicarbazone, administered by 96-hour intravenous continuous infusion. J Clin Oncol. 2004;22:1553–63. doi: 10.1200/JCO.2004.07.158. [DOI] [PubMed] [Google Scholar]
- 15.Chao J, Synold TW, Morgan RJ, Jr., Kunos C, Longmate J, Lenz HJ, Lim D, Shibata S, Chung V, Stoller RG, et al. A phase I and pharmacokinetic study of oral 3-aminopyridine-2-carboxaldehyde thiosemicarbazone (3-AP, NSC #663249) in the treatment of advanced-stage solid cancers: a California Cancer Consortium Study. Cancer Chemother Pharmacol. 2012;69:835–43. doi: 10.1007/s00280-011-1779-5. [DOI] [PMC free article] [PubMed] [Google Scholar]
- 16.Campisi J, d’Adda di Fagagna F. Cellular senescence: when bad things happen to good cells. Nat Rev Mol Cell Biol. 2007;8:729–40. doi: 10.1038/nrm2233. [DOI] [PubMed] [Google Scholar]
- 17.Dimri GP, Lee X, Basile G, Acosta M, Scott G, Roskelley C, Medrano EE, Linskens M, Rubelj I, Pereira-Smith O, et al. A biomarker that identifies senescent human cells in culture and in aging skin in vivo. Proc Natl Acad Sci U S A. 1995;92:9363–7. doi: 10.1073/pnas.92.20.9363. [DOI] [PMC free article] [PubMed] [Google Scholar]
- 18.Alimonti A, Nardella C, Chen Z, Clohessy JG, Carracedo A, Trotman LC, Cheng K, Varmeh S, Kozma SC, Thomas G, et al. A novel type of cellular senescence that can be enhanced in mouse models and human tumor xenografts to suppress prostate tumorigenesis. J Clin Invest. 2010;120:681–93. doi: 10.1172/JCI40535. [DOI] [PMC free article] [PubMed] [Google Scholar]
- 19.Ventura A, Kirsch DG, McLaughlin ME, Tuveson DA, Grimm J, Lintault L, Newman J, Reczek EE, Weissleder R, Jacks T. Restoration of p53 function leads to tumour regression in vivo. Nature. 2007;445:661–5. doi: 10.1038/nature05541. [DOI] [PubMed] [Google Scholar]
- 20.Xue W, Zender L, Miething C, Dickins RA, Hernando E, Krizhanovsky V, Cordon-Cardo C, Lowe SW. Senescence and tumour clearance is triggered by p53 restoration in murine liver carcinomas. Nature. 2007;445:656–60. doi: 10.1038/nature05529. [DOI] [PMC free article] [PubMed] [Google Scholar]
- 21.Nardella C, Clohessy JG, Alimonti A, Pandolfi PP. Pro-senescence therapy for cancer treatment. Nat Rev Cancer. 2011;11:503–11. doi: 10.1038/nrc3057. [DOI] [PubMed] [Google Scholar]
- 22.Ewald JA, Desotelle JA, Wilding G, Jarrard DF. Therapy-induced senescence in cancer. J Natl Cancer Inst. 2010;102:1536–46. doi: 10.1093/jnci/djq364. [DOI] [PMC free article] [PubMed] [Google Scholar]
- 23.Aird KM, Zhang G, Li H, Tu Z, Bitler BG, Garipov A, et al. Suppression of Nucleotide Metabolism Underlies the Establishment and Maintenance of Oncogene-Induced Senescence. Cell Rep 2013. [DOI] [PMC free article] [PubMed] [Google Scholar]
- 24.Mannava S, Moparthy KC, Wheeler LJ, Leonova KI, Wawrzyniak JA, Bianchi-Smiraglia A, Berman AE, Flanagan S, Shewach DS, Zeitouni NC, et al. Ribonucleotide reductase and thymidylate synthase or exogenous deoxyribonucleosides reduce DNA damage and senescence caused by C-MYC depletion. Aging (Albany NY) 2012;4:917–22. doi: 10.18632/aging.100512. [DOI] [PMC free article] [PubMed] [Google Scholar]
- 25.Mannava S, Moparthy KC, Wheeler LJ, Natarajan V, Zucker SN, Fink EE, Im M, Flanagan S, Burhans WC, Zeitouni NC, et al. Depletion of deoxyribonucleotide pools is an endogenous source of DNA damage in cells undergoing oncogene-induced senescence. Am J Pathol. 2013;182:142–51. doi: 10.1016/j.ajpath.2012.09.011. [DOI] [PMC free article] [PubMed] [Google Scholar]
- 26.Darzynkiewicz Z. Perturbation of nucleotide metabolism--the driving force of oncogene-induced senescence. Oncotarget. 2013;4:649–50. doi: 10.18632/oncotarget.1023. [DOI] [PMC free article] [PubMed] [Google Scholar]
- 27.Kurman RJ, Shih IeM. The origin and pathogenesis of epithelial ovarian cancer: a proposed unifying theory. Am J Surg Pathol. 2010;34:433–43. doi: 10.1097/PAS.0b013e3181cf3d79. [DOI] [PMC free article] [PubMed] [Google Scholar]
- 28.Levanon K, Crum C, Drapkin R. New insights into the pathogenesis of serous ovarian cancer and its clinical impact. J Clin Oncol. 2008;26:5284–93. doi: 10.1200/JCO.2008.18.1107. [DOI] [PMC free article] [PubMed] [Google Scholar]
- 29.McCarty KS, Jr., Szabo E, Flowers JL, Cox EB, Leight GS, Miller L, Konrath J, Soper JT, Budwit DA, Creasman WT, et al. Use of a monoclonal anti-estrogen receptor antibody in the immunohistochemical evaluation of human tumors. Cancer Res. 1986;46(Suppl):4244s–8s. [PubMed] [Google Scholar]
- 30.McCarty KS, Jr., Miller LS, Cox EB, Konrath J, McCarty KS., Sr. Estrogen receptor analyses. Correlation of biochemical and immunohistochemical methods using monoclonal antireceptor antibodies. Arch Pathol Lab Med. 1985;109:716–21. [PubMed] [Google Scholar]
- 31.Hendrix ND, Wu R, Kuick R, Schwartz DR, Fearon ER, Cho KR. Fibroblast growth factor 9 has oncogenic activity and is a downstream target of Wnt signaling in ovarian endometrioid adenocarcinomas. Cancer Res. 2006;66:1354–62. doi: 10.1158/0008-5472.CAN-05-3694. [DOI] [PubMed] [Google Scholar]
- 32.Tothill RW, Tinker AV, George J, Brown R, Fox SB, Lade S, Johnson DS, Trivett MK, Etemadmoghadam D, Locandro B, et al. Australian Ovarian Cancer Study Group Novel molecular subtypes of serous and endometrioid ovarian cancer linked to clinical outcome. Clin Cancer Res. 2008;14:5198–208. doi: 10.1158/1078-0432.CCR-08-0196. [DOI] [PubMed] [Google Scholar]
- 33.Cory JG, Cory AH, Rappa G, Lorico A, Liu MC, Lin TS, Sartorelli AC. Inhibitors of ribonucleotide reductase. Comparative effects of amino- and hydroxy-substituted pyridine-2-carboxaldehyde thiosemicarbazones. Biochem Pharmacol. 1994;48:335–44. doi: 10.1016/0006-2952(94)90105-8. [DOI] [PubMed] [Google Scholar]
- 34.Finch RA, Liu MC, Cory AH, Cory JG, Sartorelli AC. Triapine (3-aminopyridine-2-carboxaldehyde thiosemicarbazone; 3-AP): an inhibitor of ribonucleotide reductase with antineoplastic activity. Adv Enzyme Regul. 1999;39:3–12. doi: 10.1016/S0065-2571(98)00017-X. [DOI] [PubMed] [Google Scholar]
- 35.Wang LM, Lu FF, Zhang SY, Yao RY, Xing XM, Wei ZM. Overexpression of catalytic subunit M2 in patients with ovarian cancer. Chin Med J (Engl) 2012;125:2151–6. [PubMed] [Google Scholar]
- 36.Zhang M, Wang J, Yao R, Wang L. Small interfering RNA (siRNA)-mediated silencing of the M2 subunit of ribonucleotide reductase: a novel therapeutic strategy in ovarian cancer. Int J Gynecol Cancer. 2013;23:659–66. doi: 10.1097/IGC.0b013e318287e2b3. [DOI] [PubMed] [Google Scholar]
- 37.Bitler BG, Nicodemus JP, Li H, Cai Q, Wu H, Hua X, Li T, Birrer MJ, Godwin AK, Cairns P, et al. Wnt5a suppresses epithelial ovarian cancer by promoting cellular senescence. Cancer Res. 2011;71:6184–94. doi: 10.1158/0008-5472.CAN-11-1341. [DOI] [PMC free article] [PubMed] [Google Scholar]
- 38.Courtois-Cox S, Jones SL, Cichowski K. Many roads lead to oncogene-induced senescence. Oncogene. 2008;27:2801–9. doi: 10.1038/sj.onc.1210950. [DOI] [PubMed] [Google Scholar]
- 39.Kuilman T, Michaloglou C, Mooi WJ, Peeper DS. The essence of senescence. Genes Dev. 2010;24:2463–79. doi: 10.1101/gad.1971610. [DOI] [PMC free article] [PubMed] [Google Scholar]
- 40.Yaginuma Y, Westphal H. Abnormal structure and expression of the p53 gene in human ovarian carcinoma cell lines. Cancer Res. 1992;52:4196–9. [PubMed] [Google Scholar]
- 41.Watson JE, Gabra H, Taylor KJ, Rabiasz GJ, Morrison H, Perry P, Smyth JF, Porteous DJ. Identification and characterization of a homozygous deletion found in ovarian ascites by representational difference analysis. Genome Res. 1999;9:226–33. [PubMed] [Google Scholar]
- 42.Halicka HD, Zhao H, Li J, Lee YS, Hsieh TC, Wu JM, Darzynkiewicz Z. Potential anti-aging agents suppress the level of constitutive mTOR- and DNA damage- signaling. Aging (Albany NY) 2012;4:952–65. doi: 10.18632/aging.100521. [DOI] [PMC free article] [PubMed] [Google Scholar]
- 43.Siddik ZH. Cisplatin: mode of cytotoxic action and molecular basis of resistance. Oncogene. 2003;22:7265–79. doi: 10.1038/sj.onc.1206933. [DOI] [PubMed] [Google Scholar]
- 44.Banerjee S, Kaye SB, Ashworth A. Making the best of PARP inhibitors in ovarian cancer. Nat Rev Clin Oncol. 2010;7:508–19. doi: 10.1038/nrclinonc.2010.116. [DOI] [PubMed] [Google Scholar]
- 45.Li H, Cai Q, Godwin AK, Zhang R. Enhancer of zeste homolog 2 promotes the proliferation and invasion of epithelial ovarian cancer cells. Mol Cancer Res. 2010;8:1610–8. doi: 10.1158/1541-7786.MCR-10-0398. [DOI] [PMC free article] [PubMed] [Google Scholar]
- 46.Ye X, Zerlanko B, Kennedy A, Banumathy G, Zhang R, Adams PD. Downregulation of Wnt signaling is a trigger for formation of facultative heterochromatin and onset of cell senescence in primary human cells. Mol Cell. 2007;27:183–96. doi: 10.1016/j.molcel.2007.05.034. [DOI] [PMC free article] [PubMed] [Google Scholar]
- 47.Wainstock DH. A decade of Developmental Cell. Dev Cell. 2011;21:1. doi: 10.1016/j.devcel.2011.07.002. [DOI] [PubMed] [Google Scholar]
- 48.Zhang R, Poustovoitov MV, Ye X, Santos HA, Chen W, Daganzo SM, Erzberger JP, Serebriiskii IG, Canutescu AA, Dunbrack RL, et al. Formation of MacroH2A-containing senescence-associated heterochromatin foci and senescence driven by ASF1a and HIRA. Dev Cell. 2005;8:19–30. doi: 10.1016/j.devcel.2004.10.019. [DOI] [PubMed] [Google Scholar]
- 49.Zhang R, Chen W, Adams PD. Molecular dissection of formation of senescence-associated heterochromatin foci. Mol Cell Biol. 2007;27:2343–58. doi: 10.1128/MCB.02019-06. [DOI] [PMC free article] [PubMed] [Google Scholar]
- 50.Zhang R, Liu ST, Chen W, Bonner M, Pehrson J, Yen TJ, Adams PD. HP1 proteins are essential for a dynamic nuclear response that rescues the function of perturbed heterochromatin in primary human cells. Mol Cell Biol. 2007;27:949–62. doi: 10.1128/MCB.01639-06. [DOI] [PMC free article] [PubMed] [Google Scholar]
Associated Data
This section collects any data citations, data availability statements, or supplementary materials included in this article.