

Abstract
Drug resistance is a major obstacle in the targeted therapy of melanoma using BRAF/MEK inhibitors. This study was to identify BRAF V600E-associated oncogenic pathways that predict resistance of BRAF-mutated melanoma to BRAF/MEK inhibitors. We took in silico approaches to analyze the activities of 24 cancer-related pathways in melanoma cells and identify those whose activation was associated with BRAF V600E and used the support vector machine (SVM) algorithm to predict the resistance of BRAF-mutated melanoma cells to BRAF/MEK inhibitors. We then experimentally confirmed the in silico findings. In a microarray gene expression dataset of 63 melanoma cell lines, we found that activation of multiple oncogenic pathways preferentially occurred in BRAF-mutated melanoma cells. This finding was reproduced in 5 additional independent melanoma datasets. Further analysis of 46 melanoma cell lines that harbored BRAF mutation showed that 7 pathways, including TNFα, EGFR, IFNα, hypoxia, IFNγ, STAT3, and MYC, were significantly differently expressed in AZD6244-resistant compared with responsive melanoma cells. A SVM classifier built on this 7-pathway activation pattern correctly predicted the response of 10 BRAF-mutated melanoma cell lines to the MEK inhibitor AZD6244 in our experiments. We experimentally showed that TNFα, EGFR, IFNα, and IFNγ pathway activities were also upregulated in melanoma cell A375 compared with its sub-line DRO, while DRO was much more sensitive to AZD6244 than A375. In conclusion, we have identified specific oncogenic pathways preferentially activated in BRAF-mutated melanoma cells and a pathway pattern that predicts resistance of BRAF-mutated melanoma to BRAF/MEK inhibitors, providing novel clinical implications for melanoma therapy.
Keywords: melanoma, BRAF mutation, MEK inhibitor, BRAF V600E inhibitor, drug resistance, oncogenic pathway
Introduction
Melanoma is a highly aggressive skin cancer that originates from melanocytes, and its incidence has been rising substantially over the past decades worldwide.1 A prominent molecular pathological characteristic of melanoma is that gene mutations in the BRAF/MEK pathway are highly prevalent.2,3 Among them is the BRAF T1799A, which results in BRAFV600E that possesses constitutively activated BRAF kinase activities. This is the most common mutation in melanoma, occurring in about 50% of cases.2,3
Several BRAF/MEK signaling pathway inhibitors, including inhibitors selectively against BRAFV600E or its downstream molecular MEK, have shown prominent effects in melanoma patients in recent clinical trials.2,4 One of the major clinical obstacles in this molecular-targeted therapy is, however, the commonly seen innate drug resistance. As an example, about 20 to 40% of patients with BRAF-mutated melanoma do not respond to the BRAFV600E inhibitor PLX4032.2-5 Thus, novel treatment strategies and biomarkers for prediction of such drug resistance are urgently needed to improve the response rates and the duration of clinical benefit. In this context, it is interesting that several molecular abnormalities, such as the activation of hepatocyte growth factor (HGF)/MET signaling, amplification of cyclin D1 (CCND1), CDK4-activating mutations, and loss of phosphatase and tensin homolog (PTEN) or retinoblastoma protein (RB1), have been recently found to be associated with the innate resistance to BRAF/MEK signaling inhibitors in a small range of BRAF-mutated cancer cells (reviewed in refs. 2, 3, and 5). Identification of more universal biomarkers for predicting drug resistance is in need to facilitate the development of novel strategies tacking the drug resistance issues in melanoma.
Several approaches, such as gene set enrichment analysis (GSEA) and Bayesian binary regression (BinReg), have been developed to generate cell signaling pathway profiling based on gene expression data.6,7 The advantage of the BinReg approach is that it can provide a quantitative measure of pathway activation for individual samples. Pathway profiling based on this approach has been successfully used to differentiate tumor subtypes, identify molecular pathologies of diseases, and predict clinical outcomes and drug response of cancer patients.7-11 In the present study, we used BinReg approach to analyze the activities of 24 cancer-related pathways in melanoma cells and identified a pathway pattern that was able to predict the resistance of BRAF-mutated melanoma cells to BRAF/MEK signaling inhibitors. Moreover, we also examined and identified patterns of the activation of multiple oncogenic pathways that occurred preferentially in BRAF-mutated melanoma cells, especially in cells carrying both BRAF and PTEN abnormalities, which uniquely linked the molecular pathologies and clinical features of melanoma.
Results
Generation of pathway signatures for BRAF, IGF1, and ALK signaling pathways
A total of 24 cancer-related pathways were analyzed in this study. The signatures for 21 of the 24 pathways were reported previously.7,8,10 The signatures for the other 3 pathways, including BRAF, IGF1 and ALK pathways, were generated in this study based on the gene expression datasets published in GEO, as described in the Supplementary Materials and Methods. As shown in Fig. S1, the signatures generated by training set were able to predict well the pathway activities of samples from both training and test sets.
Activation of multiple oncogenic pathways preferentially occurring in BRAF-mutated melanoma cells, particularly in cells with both BRAF and PTEN alterations
The 24 pathway activities in 63 melanoma cell lines were analyzed based on the gene expression data of the Johansson dataset (GSE7127)12 (Fig. S2). According to the genetic alterations of BRAF, RAS, PTEN, and PIK3CA in the 63 cell lines,12 we divided the 63 lines into 4 groups. Group WT (wild-type) included 7 cell lines that did not harbor any mutations in the 4 genes; group BRAF included 30 lines carrying BRAF mutation alone; group BRAF&PTEN (B&P) included 16 lines carrying BRAF mutation and PTEN deletion/mutation and one line carrying BRAF and PIK3CA mutations; the remaining 9 cell lines, with RAS mutation alone, were classified as group RAS.
Sixteen of the 24 pathways were significantly differently expressed at least in one pairwise comparison among the 4 groups (P ≤ 0.025, randomization test) (Fig. 1). As expected, the cells with BRAF or RAS mutations showed higher activity in the BRAF and RAS signaling pathways, while cells with PTEN, PIK3CA, or RAS alterations showed higher activity in the PI3K pathway (Fig. 1A–C). Compared with group WT, melanoma cells with any of the genetic alterations in the 4 genes also had higher activities in another 6 cancer-related pathways, including E2F1, Wnt/β-catenin (BCAT), IGF1, ALK, MYC, and p63 signaling pathways (Fig. 1D–I), which were all putative oncogenic pathways,13-16 except for the p63 pathway that is uncertain.17 By contrast, cells in group WT had higher activity than the other 3 groups in only 3 cancer-related pathways, including EGFR, progesterone receptor (PR) and lactic acidosis (LacAcid) pathways (Fig. 1J–L).

Figure 1. Activities of multiple cancer-related pathways were associated with specific genetic alterations in melanoma cells. WT, Cell lines did not harbor genetic alterations of BRAF, PTEN, PI3K, and RAS (n = 7); BRAF, Cells carried BRAF mutation alone (n = 30); B&P, cells carried BRAF mutation and PTEN deletion/mutation or PI3K mutation (n = 17); RAS, cells carried RAS mutation alone (n = 9). Only the pathways that were significantly differently (P ≤ 0.025, randomization test) expressed at least in one pairwise comparison among the 4 groups are shown. Each point represents one cell line, and the average value for each group is shown by a horizontal bar.
Interestingly, the cells in group BRAF&PTEN showed higher activities than cells in group BRAF in 13 of the 16 cancer-related pathways (Fig. 1A–G, J, and L–P), of which 8 pathways had the P values < 0.025 (Fig. 1A, B, D, J, and M–P). Among the 13 pathways, 8 pathways, including BRAF, RAS, PI3K, E2F1, BCAT, IGF1, EGFR, and HER2, were well-known oncogenic pathways, and the rest of the pathways, including p63, TGFβ, IFNα, and IFNγ, had cellular context-dependent oncogenic roles.3,13-16,18,19
Analysis on 5 additional microarray datasets confirmed the activation of multiple oncogenic pathways in BRAF-mutated melanoma
We further analyzed the 24 pathways in one large dataset that was merged from 5 microarray datasets. ComBat program20 was used to merge these datasets to remove dataset-specific biases (Fig. S3). Among the 196 samples of the 5 datasets, 169 melanoma samples had confirmed BRAF and RAS mutation information (Fig. S4). As the genetic alteration of PTEN or PIK3CA were not available for the merged dataset, to make the results comparable between this merged dataset and the Johansson dataset, we combined the BRAF and BRAF&PTEN groups in the Johansson dataset into one group (n = 47) and analyzed the pathway activity difference between the combined group and group WT.
As shown in Table 1, a total of 7 pathways were significantly differently expressed between WT and BRAF-mutated cells in either the Johansson dataset or the merged dataset (P ≤ 0.025, randomization test). Among these 7 pathways, BRAF, RAS, BCAT, and ALK pathways were upregulated in BRAF-mutated cells, while PR pathway was upregulated in WT cells in both datasets (Figs. 1A, C, E, H, K and 2A–C, E, and I). P63 and MYC pathways showed a significantly higher activity in BRAF-mutated cells in the merged dataset (Fig. 2D and F) and a statistically non-significant higher trend in the Johansson dataset (Fig. 1G and I). The E2F1 and IGF1 pathways showed a significantly higher activity in BRAF-mutated cells in the Johansson dataset (Fig. 1D, F; Table 1) and a statistically non-significant higher trend in the merged dataset (Fig. 2G and H). These highly consistent results between the 2 datasets strengthened further that BRAF mutation was associated with activation of multiple oncogenic signaling pathways, including RAS, BCAT, ALK, E2F1, IGF1, MYC, and p63 pathways, in melanoma cells.
Table 1. Pathways differently expressed between the WT and BRAF-mutated cells in the Johansson and merged datasets.
| Gene expression Dataset | P value for the pathway activity difference (WT vs. BRAF- mutated melanoma)‡ | ||||||||
|---|---|---|---|---|---|---|---|---|---|
| BRAF | RAS | E2F1 | BCAT | IGF | ALK | PR | MYC | p63 | |
| Johansson dataset* | 0.019 | 0.011 | 0.025 | 0.008 | 0.008 | 0.004 | 0.008 | 0.036 | 0.082 |
| Merged dataset† | < 0.001 | < 0.001 | 0.062 | 0.002 | 0.119 | 0.010 | 0.011 | 0.015 | < 0.001 |
*We combined the BRAF and B&P groups in the Johansson dataset into one group and calculated the p-values for the differently expressed pathways between the combined group (n = 47) and the WT group (n = 7). †For the merged dataset, we calculated the p-values for the differently expressed pathways between the melanoma samples carrying BRAF mutation alone (n = 80) and the WT (wild-type in both BRAF and RAS) group (n = 59). ‡The BRAF, RAS, E2F1, BCAT, IGF1, ALK, p63 and MYC pathways were upregulated in BRAF-mutated cells while the PR pathway was upregulated in WT cells in both datasets. p ≤ 0.025 was set as statistic significance (randomization test).

Figure 2. Analysis on 5 additional microarray datasets confirmed the activation of multiple oncogenic pathways in BRAF-mutated melanoma. The activities of individual oncogenic pathways were shown by Box–Whisker plots. The box plot shows the 5 statistics (the lower whisker is 5% minimum, the lower box part is the 25th percentile, the solid line in the box presents the median, the upper box part is 75th percentile, and the upper whisker is 95% maximum). Randomization test was used to calculate the P values for the pairwise comparison of pathway activities among the 3 groups of melanoma, i.e., WT (n = 59), BRAF mutation (n = 80), and RAS mutation (n = 30) groups.
Only the E2F1 pathway in the Johansson dataset and the BRAF pathway in the merged dataset showed significantly different activities between RAS-mutated and WT cells (Figs. 1D and 2A). These 2 pathways, as well as RAS, MYC and PR pathways, showed the same pattern between RAS-mutated and WT cells in both datasets (Figs. 1C, I, K and 2B, F, and I). The patterns of several other pathways, such as BCAT, IGF1, p63, and ALK, were, however, not consistent between the 2 datasets (Figs. 1E–H and 2C–E and H).
Identification of a pathway pattern associated with AZD6244 resistance in BRAF-mutated melanoma cells
Forty-seven of the 63 melanoma cell lines in the Johansson dataset harbored BRAF mutation. Based on the sensitivity to the MEK inhibitor AZD6244, we divided the 46 of 47 cell lines (GI50 is not available for one BRAF-mutated line) into AZD6244-responsive (GI50 < 1 μM) and -resistant (GI50 value > 1 μM) groups (Fig. 3A). Randomization test showed that 7 of the 24 pathways had significantly different activity between these 2 groups of melanoma cells, including TNFα, EGFR, IFNα, hypoxia, IFNγ, and STAT3 pathways (upregulated in AZD6244-resistant cells) and MYC pathway (downregulated in the resistant cells) (Fig. 3). We named this signature profile as the 7-pathway pattern.

Figure 3. Identification of a 7-pathway pattern that distinguish AZD6244-resistant and -responsive melanoma cells.(A)Heatmap of the predicted 24 pathway activities in the 46 melanoma cells with BRAF mutation. The GI50 value of AZD6244 were used to define whether the cells were AZD6244-resistant (>1 µM) or -responsive (<1 µM). The pathways that showed statistical significance (P ≤ 0.025, randomization test) in predicted activities between the 2 groups are highlighted with red color. The GI50 data for these cell lines were from ref. 53. (B–H) Distribution of the predicted activities of the 7 pathways that were significantly differently expressed between AZD6244-resistant and -responsive melanoma cells. Each point represents one cell line, and the average value for each group is shown by a horizontal bar.
No difference in the BRAF pathway activity was observed between the 2 groups of melanoma cells, nor was that in PI3K and Akt pathway activities (Fig. 3A). In fact, 14 of the 16 melanoma cells harboring BRAF mutation and PTEN inactivation were responsive to AZD6244 (Fig. S2). In addition, no difference in the expression level was observed for CCND1, HGF, MET, PTEN, and RB1 that could potentially be related with the innate resistance of cancer cells to BRAF/MEK signaling inhibitors,2,3,5 suggesting that these genes were not associated with resistance to AZD6244 in these melanoma cells lines (Fig. S5).
The 7-pathway pattern predicts the response of BRAF-mutated melanoma cells to BRAF/MEK inhibitors
In machine learning, support vector machines (SVMs) are a set of supervised learning models with associated learning algorithms that are primarily used in pattern recognition, classification, and regression. To test the prognostic value of the 7-pathway pattern we identified here, LIBSVM, which was developed by Chang et al.21 and is currently one of the most widely used SVM, was employed to build a classifier to predict the response of a BRAF-mutated melanoma cells to AZD6244. The pathway signatures of the 46 BRAF-mutated melanoma cell lines (Johansson dataset) were used as a training set. At the initial step, all the 7 differently expressed pathways (Fig. 3B–H) were applied to build a SVM classifier. By using appropriate parameter c and γ that were obtained by the grid-search approach, the classifier achieved a predictive accuracy of 95.6% on whether the 46 melanoma cells were responsive or resistant to AZD6244 (Fig. 4A). When performed in the test set that contained 10 melanoma cell lines (GSE36133), the classifier predicted that 2 of the cell lines RPMI-7951 and SK-MEL-24 were highly likely to be resistant to AZD6244 (with a possibility >90%), while the other 8 cell lines were not (with a possibility <10%, except COLO829 line) (Fig. 4B). We performed a cell proliferation assay in these 10 cell lines and confirmed that only RPMI-7951 and SK-MEL-24 cells had high GI50 values (>1 μM) to AZD6244 (Fig. 4B), which means that the SVM classifier achieved 100% accuracy on the test set prediction. As expected, RPMI-7951 and SK-MEL-24 cells were also resistant to BRAFV600E-specific inhibitor PLX4032 (Fig. S6).

Figure 4. Prediction of AZD6244 resistance of melanoma cells with SVM classifier based on the 7-pathway pattern.(A)Best c and γ values for SVM model were obtained by grid-search approach.(B)Prediction of AZD6244 resistance by SVM and experimental validation of the SVM results. The SVM predicted results (possibility as AZD6244 resistance, right y-axis) for 10 melanoma cell lines tested are shown as the yellow columns, and the actual sensitivities of the cell lines to AZD6244 (GI50 values, left y-axis) are shown as the blue columns. By default, the SVM classifier classified the cells, with a >50% possibility into the AZD6244-resistant group, while the rest into the AZD6244-responsive group.(C)Heatmap of the predicted 24 pathway activities in the 10 melanoma cells from the test dataset. The components (pathways) of the 7-pathway pattern are highlighted in red.(D)Western blot analysis of the proteins related to the EGFR, STAT3, TNFα, or MYC pathways. The blotting results obtained from the same membrane are boxed together.(E)Heatmap of the relative pathway activities obtained by experimental approach. The pathway activities of EGFR, STAT3, IκB, and MYC were based on the results in Figure 4D and were calculated as the relative level of corresponding proteins (normalized by β-actin level). Theoretically, the IκB level is negatively correlated with TNFα pathway activities. The pathway activities of the hypoxia and IFN were based on hypoxia and IFN scores that were calculated from the qRT-PCR results (Table S1).(F)Pathway ranking list based on their statistical P values calculated by the randomization test or their weight vector values computed by RFE-SVM.(G)Prediction accuracy using different top numbers of pathways (ranking based on the P values) to build SVM classifier. The pathways ranked from 1st to 7th are listed in Figure 4F, and pathways ranked from 8th to 24th are estrogen receptor (ER), IGF1, glucose deprivation (GluDepr), RAS, BCAT, TGFβ, PR, LacAci, p63, p53, ALK, PI3K, AKT, E2F1, SRC, BRAF, and HER2, respectively.(H)Prediction accuracy using different top numbers of pathways (ranking based on RFE-SVM analysis) to build SVM classifier.
Figures 3B–H and 4C showed that RPMI-7951 and SK-MEL-24 cells had a similar pattern in the 7 pathways as that of the AZD6244-resistant melanoma cell lines from the training set. To confirm that the 7-pathway patterns were truly present in the AZD6244-resistant cells, we detected the level of phosphor-EGFR (pEGFR), phosphor-STAT3 (pSTAT3), IκB (TNFα signaling inhibitor), and MYC by western blot (Fig. 4D), and calculated IFN score and hypoxia score based on the expression data of several related gene (Table S1). Although the 7 pathway activities predicted by BinReg were based on the expression of numerous genes in the 10 melanoma cell lines (Fig. 4C), their overall pattern was in line with the data obtained by experimental detection of only one or several gene products, except for several data values across the 10 cell lines such as the STAT3 activity in RPMI-7951 cells (Fig. 4E).
Using the top 4, 5, or 6 pathways that have lowest randomization test P values (Fig. 4F) to build SVM classifier also achieved the same accuracies for both training set and test set, while using less or more pathways decrease the prediction accuracy (Fig. 4G). To optimize the pathway combinations for better SVM performance, we used SVM-based recursive feature elimination (RFE-SVM) to rank the 7 pathways (Fig. 4F) and then tested the top number of pathways, respectively, for SVM analysis. Figure 4H showed that using as few as 3 pathways, including TNFα, hypoxia, and EGFR pathways, could successfully distinguish the AZD6244-resistant melanoma cell lines from the drug-responsive cell lines, although it could not further increase the overall prediction accuracy.
TNFα, EGFR, IFNα and IFNγ pathway activities decreased following the increase in the sensitivity to AZD6244 in 2 syngeneic cell lines
DRO cell line is a sub-line derived from A375 cells after regular passaging, which was confirmed by DNA profiling analysis using 10 STR markers.22 DRO line is much more sensitive than its parent line A375 to AZD6244 or PLX4032-induced proliferation inhibition (Fig. 5A and B). AZD6244 and PLX4032 induced significant cleavage of poly-ADP-ribose polymerase (PARP) and DNA ladder (Fig. 5C and D), representing robust apoptosis, mainly in DRO cells, but not in A375 cells.

Figure 5. DRO cell line is more sensitive to V600E BFAF/MEK inhibitors than its parent line A375 and has lower activities of TNFα, EGFR, IFNα, and IFNγ pathways. MTT assay showed that DRO cell line was more sensitive than A375 cell line to AZD6244 (A) or PLX4032 (B) induced proliferation inhibition. AZD6244 and PLX4032 induced significant cleavage of PARP (C) and DNA ladder (D) in DRO but not A375 cells.(E)Activities of the 7 pathways of the 7-pathway pattern in DRO and A375 cells.
Except homozygous T1799A BRAF mutation and 2 rare homozygous CDKN2A mutations, no RAS, PTEN, PIK3CA, or other types of BRAF mutations were detected in A375 and DRO cells (data not shown). In addition, genes CCND1, HGF, MET, PTEN, and RB1, which might be related with the resistance of melanoma cells to BRAF/MEK inhibitors,2,3,5 did not show different expression levels between A375 and DRO cells, except CCND1 and HGF (Fig. S7). HGF level in DRO cells was even about 9-fold higher than that in A375 cells. Interestingly, pathway analysis based on the microarray gene expression data showed that TNFα, EGFR, IFNα, and IFNγ pathway activities were much lower in DRO cells and STAT3 pathway activity was moderately lower in DRO cells than that in A375 cells (Fig. 5E), further suggesting the association between these pathways and response of BRAF-mutated melanoma cells to BRAF/MEK inhibitors.
Discussion
Correlations of oncogenic pathways with the genetic alterations in melanoma cells
Our data showed that melanoma cells with BRAF mutations have higher activities in multiple oncogenic pathways than the cells with wild-type BRAF and RAS, including BRAF, RAS, E2F1, BCAT, IGF1, ALK, and MYC signaling pathways that have been previously reported to be associated with the progression or malignant phenotype of melanoma.3,13-16,18,19 This result, together with our pervious finding that mutant BRAF was associated with silence of multiple tumor-suppressor genes through epigenetic regulation,23 indicate that mutant BRAF may shift the regulated equilibrium of cell renewal and proliferation to the side that favors melanoma cells acquiring higher malignant capability. This may also explain the clinical observation that melanoma patients with BRAF mutation have worse clinical features than patients with wild-type genotypes.24 It is worth noting that cells with both BRAF and PTEN alterations showed higher activities in most of the oncogenic pathways than the cells with BRAF mutation alone, which is in line with previous reports that the BRAF/MEK and PI3K pathways cooperated to promote tumor progression and enhance malignant potential of melanoma.25
Melanoma cells with wild-type BRAF and RAS have higher activity in PR pathway than cells with BRAF or RAS mutations. Receptor activator of nuclear factor κB ligand and Inhibitor of DNA binding 4, 2 major downstream effectors of PR pathway, were reported to be overexpressed in melanoma and might be involved in the metastatic spreading and development of melanoma-initiating cells.26,27 Further studies are needed to clarify whether PR pathway is important in the pathogenesis of the melanoma without BRAF or RAS mutations.
Cross-talks among the 7 pathways that were differently expressed between the AZD6244-responsive and -resistant BRAF-mutated melanoma cells
We found that 7 pathways showed significantly different activities between the AZD6244-responsive and -resistant BRAF-mutated melanoma cells, including TNFα, EGFR, IFNα, hypoxia, IFNγ, and STAT3 pathways (upregulated in AZD6244-resistant cells) and MYC pathway (downregulated in AZD6244-resistant cells). Previous studies showed that activation of EGFR and STAT3 signaling was involved in the acquired resistance of BRAF-mutated melanoma cells to BRAF/MEK inhibitors.28,29 To our knowledge, the correlations between activities of TNFα, IFNα, hypoxia, IFNγ, and MYC pathways and sensitivities of cancer cells to BRAF/MEK inhibitors, have not been reported.
Cytokins TNFα, IFNα, and IFNγ are well known for their broad-spectrum anti-tumorigenic effects and have been employed for biotherapy for several cancers.30,31 In recent years, the concept that these cytokines have pure antitumor activities has been challenged, as numerous data also revealed that in certain cellular contexts the TNFα and IFN pathways could mediate tumor cell growth by promoting proliferation, survival, or metastasis of cancer cells.30,31 In addition, TNFα and IFN pathways could induce resistance of cancer cells to fractionated ionizing radiation and some chemotherapy drugs such as doxyrubicin and fludarabin,30-32 suggesting double-faced biological effects of these pathways.
As TNFα and IFN pathways transduce both anti- and pro-survival signaling, the final output effects of these pathways probably depend on whether the anti- and pro-survival signaling are suppressed or enhanced by other signaling pathways that crosstalk with the TNFα or IFN pathways. Studies have shown that MYC induced cellular susceptibility to the cytotoxic action of TNFα or IFNs in normal and cancer cells,33,34 while EGF signaling could protect normal and cancer cells from TNFα or IFNs-induced cell death.35,36 It was further demonstrated that MYC impaired TNF-induced activation of NF-kappaB transcription factor complex, while it had no effect on TNF-induced accumulation of the wild-type p53 mRNA and protein.34 Consequently, it was speculated that the activation of EGF pathway or inactivation of MYC pathway might switch the TNFα and IFN signaling from a pro-survival side to an anti-survival side. Interestingly, the TNFα or IFN pathways themselves could increase the expression or phosphorylation of EGFR while they decreased MYC expression.36-39
Hypoxia and STAT3 pathways are also in close cross-talk with the other 6 pathways in the 7-pathway pattern. For example, hypoxia promoted activation of the EGFR, IFN, and TNFα signaling40-42 and degraded MYC protein in a number of cancer cells.43 On the other hand, EGF, IFNs, and TNFα could increase the activity of hypoxia-inducible factor-1 (HIF-1) in multiple cell types.44,45 Activation of STAT3, which promotes cell proliferation, survival, angiogenesis, metastasis, and is associated with a poor prognosis in many cancers, was induced by multiple potential upstream inputs including EGF, TNFα, IFNs, and HIF-1.46,47 Conversely, activated STAT3 can also induce the expression of these important molecules or increase their activities.46,47
Based on the above discussion, we have summarized the close cross-talks among the 7 pathways in Fig. 6A. The co-regulation of the 7 pathways was also supported by pathway correlation analysis of the Johansson dataset and merged dataset (Fig. 6B and C). Overall, the activities of TNFα, EGFR, IFNα, hypoxia, IFNγ, and STAT3 pathways were positively correlated with each other, while all these 6 pathways were negatively correlated with the MYC pathway in both datasets, except that no apparent correlation was observed between hypoxia pathway and TNFα, IFNα, and IFNγ in the merged dataset. This correlation indicates that melanoma cells that have activated TNFα, IFNα, and IFNγ pathways are inclined to have low activity in the MYC pathway but high activities in the EGFR, hypoxia, and STAT3 pathways, which is the exact pathway pattern we observed in AZD6244-resistant BRAF-mutated melanoma cell lines. From the view point of Darwin’s evolution theory, the universality of the co-regulation of the 7 pathways across the melanoma cells suggested that achieving some kind of balance through the crosstalk among these pathways might be vital for the progression of melanoma; as one type of such balance, the 7-pathway pattern that exists in AZD6244-resistant melanoma cells might favor the growth and survival of these melanoma cells and protect cells against some unfavorable growth conditions, such as the AZD6244 treatment.
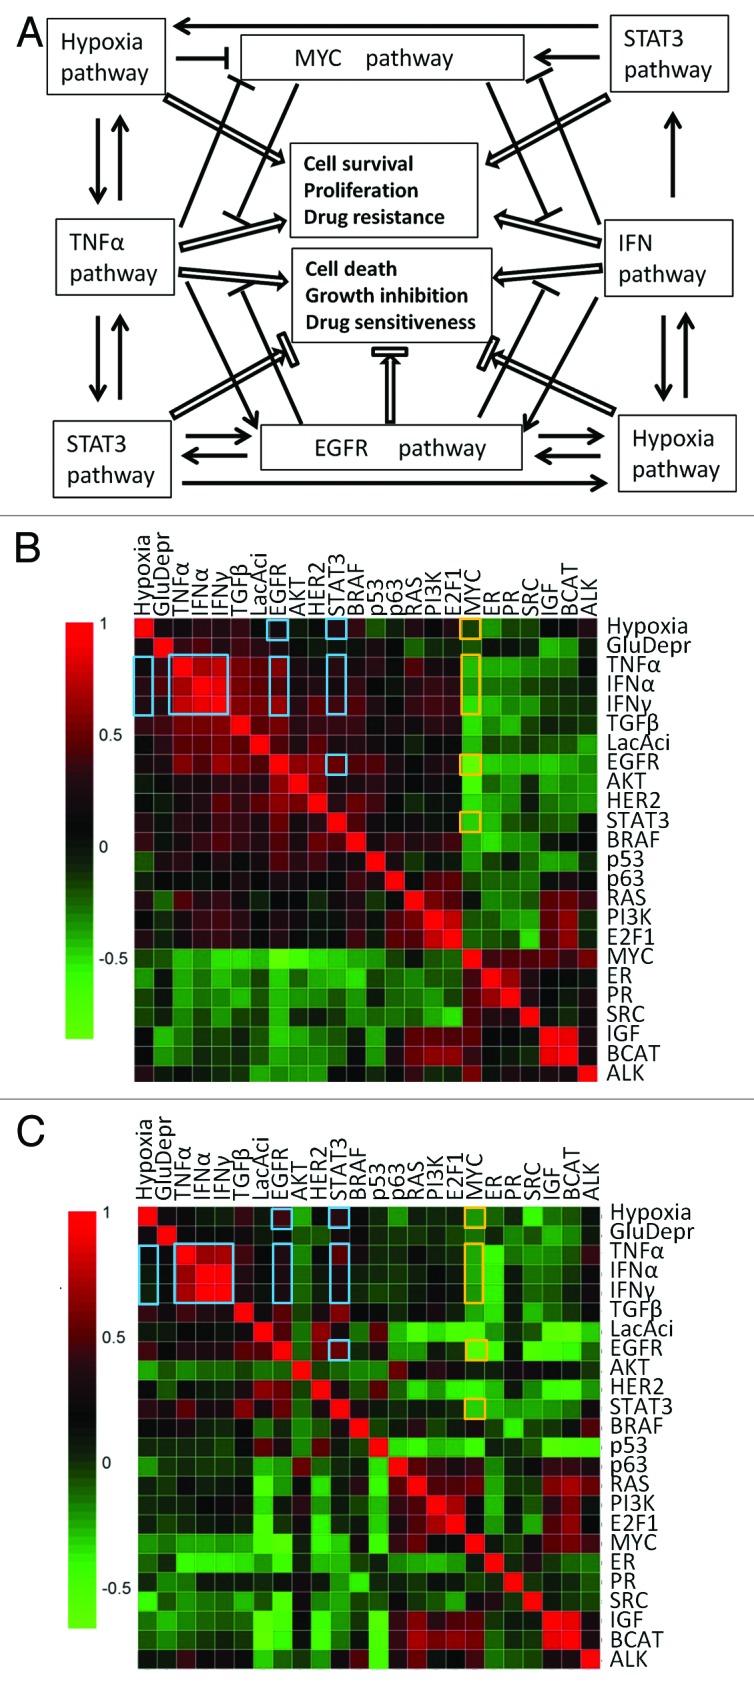
Figure 6. Cross-talks and co-regulations among the cancer-related pathways.(A)Illustrations of the cross-talks among the 7 pathways in the 7-pathway pattern. Arrows represent promotion, while flat-ended lines represent inhibition. (BandC) Pearson’s correlation analysis of pathway activities based on the Johansson dataset (B) and the merged dataset (C). Heatmaps were used to depict the Pearson correlation coefficients between any 2 of the 24 cancer-related pathways across the 63 (Johansson dataset) and 169 (merged dataset) melanoma samples. The red color indicates a positive correlation while blue a negative correlation. The correlation coefficients between any 2 of the 7 pathways in the 7-pathway pattern are highlighted with either orange (for the MYC pathway) or blue (for the other 6 pathways) boxes.
Association between the 7-pathway pattern and the response of melanoma cells to BRAF/MEK inhibitors
The 7-pathway pattern we identified in this study—low activity in the MYC pathway but high activities in the TNFα, EGFR, IFNα, hypoxia, IFNγ, and STAT3 pathways—only exist in the AZD6244-resistant melanoma cell lines from both the training and test datasets. Moreover, in A375/DRO syngeneic cell lines, the decrease of the TNFα, EGFR, IFNα, IFNγ, and STAT3 pathway activities was correlated with the increase of sensitivities of cells to AZD6244/PLX4032-induced apoptosis and proliferation inhibition. These results further confirmed the close association between the 7-pathway pattern and the response of melanoma cells to BRAF/MEK inhibitors.
It was recently reported that activation of EGFR pathway was involved in the development of acquired resistance of several melanoma cell lines to PLX4032.28 Moreover, the EGFR inhibitor Lapatinib had apparently synergistic effects with PLX4032 in 2 PLX4032-resistant melanoma cell lines.29 These data suggested that activation of EGFR pathway alone has the potential to cause innate resistance to BRAF/MEK inhibitors in melanoma cells. However, some melanoma cell lines with high EGFR pathway activity were still sensitive to AZD6244 (Fig. S2). This suggests that the inhibitory effects of EGFR signaling on the cytotoxicity of AZD6244/PLX4032 to melanoma cells might rely on certain cellular contexts. As discussed above, cross-talks among the 7 pathways are expected to suppress the pro-apoptotic effects while enhancing the anti-apoptotic effects of TNFα and IFN in melanoma cells. Moreover, activation of TNFα, IFN and hypoxia pathways could cause resistance of cancer cells to chemotherapy and radiotherapy.31,32,48 Therefore, activation of the EGFR pathway, with the cooperation of several other pathways, as indicated in the 7-pathway pattern, is more likely to cause resistance of BRAF-mutated melanoma cells to the BRAF/MEK inhibitors than EGFR pathway activation alone. Further studies to experimentally test this hypothesis may shed new light on the treatment of melanomas that are resistant to BRAF/MEK inhibitors.
Over the past decade, many multi-gene expression signatures have been demonstrated to be useful as bio-markers for risk assessment, prognostication, prediction of response to treatment, or monitoring of disease progression for various cancers. Several of these biomarkers are already in clinical application to guide treatment decisions for cancer patients.49 In the present study, the SVM classifier built with the 7-pathway pattern could predict well whether a melanoma cell will be resistant to BRAF/MEK inhibitors. It will be interesting and important to test whether this SVM classifier can be used to predict responses of melanoma patients to BRAF/MEK inhibitors.
Materials and Methods
Melanoma cells and cell culture
Melanoma cell lines A375, COLO829, SK-MEL-1, SK-MEL-3, and SK-MEL-24 were purchased from American Type Culture Collection (ATCC); cell lines Malme-3M, UACC62, RPMI-7951, SK-MEL-5, and SK-MEL-28 were purchased from National Cancer Institute (NCI). DRO, a sub-line derived from melanoma cell A375, was a kind gift from Dr Guy JF Juillard (University of California-Los Angeles School of Medicine). All these cell lines harbor BRAFV600E mutation, which we confirmed by genomic DNA sequencing (data not shown). Cells were cultured and maintained following the protocols recommended by ATCC or NCI.
Microarray datasets
The raw microarray data used in this study (listed in Table S2), except the expression data for the A375/DRO syngeneic cell lines, were downloaded from Gene Expression Omnibus (GEO) and normalized by Microarray Suite 5.0 (MAS5.0) and/or Robust Multi-array Average (RMA) approach, respectively, in R environment (http://www.r-project.org).
Pathway signatures and pathway activity prediction
The generation of pathway signatures and prediction of pathway activity of individual sample were performed using BinReg tool as described previously in detail by Gatza et al.8 In this approach, the gene expression patterns of two training sample sets (for example, pathway “on” and pathway “off”) are compared, and the pathway-specific informative genes were identified. Principal components were then used to compute weights for each of these genes, such that the weighted average of expression levels showed a clear ability to distinguish the pathway “on” and “off” group. Binary regression on the principal components is then applied to an unknown test sample, producing estimated relative probability (score) of pathway activity, which can be considered as a correlative measure of in vivo pathway activity.
The training datasets and signatures for the 24 pathways analyzed in this study, except for BRAF, ALK, and IGF1 pathways, were previously reported by Gatza et al.8,10 As suggested by the authors,8,10 MAS5.0 normalized gene expression data was used for prediction of AKT, MYC, p53, p63, RAS, STAT3, and TNFα pathway activities, while RMA normalized data was used for Wnt/β-catenin (BCAT), E2F1, EGFR, estrogen receptor (ER), GlucoseDeprivation (GluDepr), HER2, hypoxia, IFNα, IFNγ, LacticAcidosis (LacAcid), PI3K, progesterone receptor (PR), SRC, and TGFβ pathways.
The details for the generation of BRAF, ALK and IGF1 pathway signatures are described in the online Supplementary Materials and Methods. We included ALK pathway for this study since ALK signaling has been shown to activate MEK/ERK and phosphatidylinositol 3-kinase (PI3K)/Akt pathways.50 We also tried to generate the signatures for multiple growth factor pathways, including HGF, FGF, PDGF, and IGF1 pathways as they are reported to be involved in the generation of acquired resistance of melanoma cells to BRAFV600E inhibitors.2,3,5 However, except for IGF1 pathway, the signatures for these growth factor pathways that we generated basing on the GEO datasets failed to accurately predict the corresponding pathway activities in validation datasets (data not shown).
Prediction of AZD6244-resistant melanoma cells by support vector machine (SVM) algorithm
LIBSVM (version 3.0), a freely available software package,21 was employed for learning and prediction process in this study. Radial basis function kernel (RBF) and 5-fold cross validation were chosen to build SVM classifier, and best values for model parameter c and γ were obtained by a grid-search method. The pathway signatures of the 46 BRAF-mutated melanoma cell lines from Johansson dataset (GSE7127)12 were used as training set, while those of 10 melanoma cell lines from Barretina dataset (GSE36133),51 including A375, COLO829, SK-MEL-1, SK-MEL-3, SK-MEL-5, SK-MEL-24, SK-MEL-28, Malme-3M, UACC62, and RPMI7951, were used as test set. We choose these 10 cell lines because our laboratory has stocks of these cell lines and thus the results obtained by bioinformatics analysis on these lines could be further examined by experimental approaches. Both the training and test datasets were derived from same microarray platform, making the gene expression data comparable cross arrays. The 7 pathways, which showed significantly different activity (randomization test, one-tail, P ≤ 0.025) between AZD6244-responsive and -resistant BRAF-mutated melanoma cell lines from Johansson dataset, were chosen as feature pathways to build prediction model. To search the best pathway combinations for prediction of drug-resistant cells, we further use the RFE-SVM to rank the 7 pathways basing on their weight vector values. The RFE-SVM algorithm is a weight-based feature selection method that generates the ranking of features using backward feature elimination.52 The features are eliminated according to a criterion related to their support of the discrimination function. In our study RBF kernel was applied as kernel function for RFE-SVM analysis, and the ranking coefficient is defined as:
rank(i) = (1/2) αTQα − (1/2)αTQ(−i)α
where Hij = K(xi,xj), K is the kernel function, α is the Lagrange multiplier, and (−i) means that the feature i has been removed.
Statistics
Differences in mean pathway activities between 2 tumor groups were evaluated using randomization test as we described previously.23 Briefly, the prediction values of one specific pathway activity in 2 tumor groups (for example, melanoma with BRAF mutation and melanoma with RAS mutation) were resampled without replacement for 50 000 times, and the delta value (difference between the average values of the 2 groups) was computed each time. The incidence (T) of which the random delta values were higher than the actual delta value (if the actual delta value >0), or less than the actual delta value (if the actual delta value <0), was counted, and the P value for an individual pathways was obtained by dividing T with 50 000 (T/50000). A P value of ≤0.025 was set as statistically significant, as the test is a one-tail test.
Additional methodology is described in the online Supplementary Materials and Methods.
Supplementary Material
Acknowledgments
This work was supported, in part, by an ATA Young Investigator Award to DL and the NIH R01 CA134225 to MX. We thank Drs Juillard GJ at University of California-Los Angeles for kindly providing us DRO cell line used in this study. We also want to thank members of the Nevins laboratory at Duke University for their valuable suggestions on pathway activity analysis using BinReg approach.
Disclosure of Potential Conflicts of Interest
No potential conflicts of interest were disclosed.
Supplemental Materials
Supplemental materials may be found here: www.landesbioscience.com/journals/cc/article/26971
Footnotes
Previously published online: www.landesbioscience.com/journals/cc/article/26971
Reference List
- 1.Lens MB, Dawes M. Global perspectives of contemporary epidemiological trends of cutaneous malignant melanoma. Br J Dermatol. 2004;150:179–85. doi: 10.1111/j.1365-2133.2004.05708.x. [DOI] [PubMed] [Google Scholar]
- 2.Bollag G, Tsai J, Zhang J, Zhang C, Ibrahim P, Nolop K, Hirth P. Vemurafenib: the first drug approved for BRAF-mutant cancer. Nat Rev Drug Discov. 2012;11:873–86. doi: 10.1038/nrd3847. [DOI] [PubMed] [Google Scholar]
- 3.Sullivan RJ, Flaherty K. MAP kinase signaling and inhibition in melanoma. Oncogene. 2013;32:2373–9. doi: 10.1038/onc.2012.345. [DOI] [PubMed] [Google Scholar]
- 4.Chapman PB, Hauschild A, Robert C, Haanen JB, Ascierto P, Larkin J, Dummer R, Garbe C, Testori A, Maio M, et al. BRIM-3 Study Group Improved survival with vemurafenib in melanoma with BRAF V600E mutation. N Engl J Med. 2011;364:2507–16. doi: 10.1056/NEJMoa1103782. [DOI] [PMC free article] [PubMed] [Google Scholar]
- 5.Fedorenko IV, Paraiso KH, Smalley KS. Acquired and intrinsic BRAF inhibitor resistance in BRAF V600E mutant melanoma. Biochem Pharmacol. 2011;82:201–9. doi: 10.1016/j.bcp.2011.05.015. [DOI] [PMC free article] [PubMed] [Google Scholar]
- 6.Subramanian A, Tamayo P, Mootha VK, Mukherjee S, Ebert BL, Gillette MA, Paulovich A, Pomeroy SL, Golub TR, Lander ES, et al. Gene set enrichment analysis: a knowledge-based approach for interpreting genome-wide expression profiles. Proc Natl Acad Sci U S A. 2005;102:15545–50. doi: 10.1073/pnas.0506580102. [DOI] [PMC free article] [PubMed] [Google Scholar]
- 7.Bild AH, Yao G, Chang JT, Wang Q, Potti A, Chasse D, Joshi MB, Harpole D, Lancaster JM, Berchuck A, et al. Oncogenic pathway signatures in human cancers as a guide to targeted therapies. Nature. 2006;439:353–7. doi: 10.1038/nature04296. [DOI] [PubMed] [Google Scholar]
- 8.Gatza ML, Lucas JE, Barry WT, Kim JW, Wang Q, Crawford MD, Datto MB, Kelley M, Mathey-Prevot B, Potti A, et al. A pathway-based classification of human breast cancer. Proc Natl Acad Sci U S A. 2010;107:6994–9. doi: 10.1073/pnas.0912708107. [DOI] [PMC free article] [PubMed] [Google Scholar]
- 9.Freedman JA, Tyler DS, Nevins JR, Augustine CK. Use of gene expression and pathway signatures to characterize the complexity of human melanoma. Am J Pathol. 2011;178:2513–22. doi: 10.1016/j.ajpath.2011.02.037. [DOI] [PMC free article] [PubMed] [Google Scholar]
- 10.Gatza ML, Kung HN, Blackwell KL, Dewhirst MW, Marks JR, Chi JT. Analysis of tumor environmental response and oncogenic pathway activation identifies distinct basal and luminal features in HER2-related breast tumor subtypes. Breast Cancer Res. 2011;13:R62. doi: 10.1186/bcr2899. [DOI] [PMC free article] [PubMed] [Google Scholar]
- 11.West M, Ginsburg GS, Huang AT, Nevins JR. Embracing the complexity of genomic data for personalized medicine. Genome Res. 2006;16:559–66. doi: 10.1101/gr.3851306. [DOI] [PubMed] [Google Scholar]
- 12.Johansson P, Pavey S, Hayward N. Confirmation of a BRAF mutation-associated gene expression signature in melanoma. Pigment Cell Res. 2007;20:216–21. doi: 10.1111/j.1600-0749.2007.00375.x. [DOI] [PubMed] [Google Scholar]
- 13.Zhuang D, Mannava S, Grachtchouk V, Tang WH, Patil S, Wawrzyniak JA, Berman AE, Giordano TJ, Prochownik EV, Soengas MS, et al. C-MYC overexpression is required for continuous suppression of oncogene-induced senescence in melanoma cells. Oncogene. 2008;27:6623–34. doi: 10.1038/onc.2008.258. [DOI] [PMC free article] [PubMed] [Google Scholar]
- 14.Pützer BM, Steder M, Alla V. Predicting and preventing melanoma invasiveness: advances in clarifying E2F1 function. Expert Rev Anticancer Ther. 2010;10:1707–20. doi: 10.1586/era.10.153. [DOI] [PubMed] [Google Scholar]
- 15.Damsky WE, Curley DP, Santhanakrishnan M, Rosenbaum LE, Platt JT, Gould Rothberg BE, Taketo MM, Dankort D, Rimm DL, McMahon M, et al. β-catenin signaling controls metastasis in Braf-activated Pten-deficient melanomas. Cancer Cell. 2011;20:741–54. doi: 10.1016/j.ccr.2011.10.030. [DOI] [PMC free article] [PubMed] [Google Scholar]
- 16.Satyamoorthy K, Li G, Vaidya B, Patel D, Herlyn M. Insulin-like growth factor-1 induces survival and growth of biologically early melanoma cells through both the mitogen-activated protein kinase and beta-catenin pathways. Cancer Res. 2001;61:7318–24. [PubMed] [Google Scholar]
- 17.Li Y, Prives C. Are interactions with p63 and p73 involved in mutant p53 gain of oncogenic function? Oncogene. 2007;26:2220–5. doi: 10.1038/sj.onc.1210311. [DOI] [PubMed] [Google Scholar]
- 18.Davies MA, Samuels Y. Analysis of the genome to personalize therapy for melanoma. Oncogene. 2010;29:5545–55. doi: 10.1038/onc.2010.323. [DOI] [PMC free article] [PubMed] [Google Scholar]
- 19.Croce CM. Oncogenes and cancer. N Engl J Med. 2008;358:502–11. doi: 10.1056/NEJMra072367. [DOI] [PubMed] [Google Scholar]
- 20.Johnson WE, Li C, Rabinovic A. Adjusting batch effects in microarray expression data using empirical Bayes methods. Biostatistics. 2007;8:118–27. doi: 10.1093/biostatistics/kxj037. [DOI] [PubMed] [Google Scholar]
- 21.Chang C, Lin LIBSVM. a library for support vector machines. ACM Transactions on Intelligent Systems and Technology. 2011;2:1–27. doi: 10.1145/1961189.1961199. [DOI] [Google Scholar]
- 22.Schweppe RE, Klopper JP, Korch C, Pugazhenthi U, Benezra M, Knauf JA, Fagin JA, Marlow LA, Copland JA, Smallridge RC, et al. Deoxyribonucleic acid profiling analysis of 40 human thyroid cancer cell lines reveals cross-contamination resulting in cell line redundancy and misidentification. J Clin Endocrinol Metab. 2008;93:4331–41. doi: 10.1210/jc.2008-1102. [DOI] [PMC free article] [PubMed] [Google Scholar]
- 23.Liu D, Liu X, Xing M. Epigenetic genes regulated by the BRAFV600E signaling are associated with alterations in the methylation and expression of tumor suppressor genes and patient survival in melanoma. Biochem Biophys Res Commun. 2012;425:45–50. doi: 10.1016/j.bbrc.2012.07.046. [DOI] [PMC free article] [PubMed] [Google Scholar]
- 24.Ellerhorst JA, Greene VR, Ekmekcioglu S, Warneke CL, Johnson MM, Cooke CP, Wang LE, Prieto VG, Gershenwald JE, Wei Q, et al. Clinical correlates of NRAS and BRAF mutations in primary human melanoma. Clin Cancer Res. 2011;17:229–35. doi: 10.1158/1078-0432.CCR-10-2276. [DOI] [PMC free article] [PubMed] [Google Scholar]
- 25.Dankort D, Curley DP, Cartlidge RA, Nelson B, Karnezis AN, Damsky WE, Jr., You MJ, DePinho RA, McMahon M, Bosenberg M. Braf(V600E) cooperates with Pten loss to induce metastatic melanoma. Nat Genet. 2009;41:544–52. doi: 10.1038/ng.356. [DOI] [PMC free article] [PubMed] [Google Scholar]
- 26.Hoek KS. DNA microarray analyses of melanoma gene expression: a decade in the mines. Pigment Cell Res. 2007;20:466–84. doi: 10.1111/j.1600-0749.2007.00412.x. [DOI] [PubMed] [Google Scholar]
- 27.Kupas V, Weishaupt C, Siepmann D, Kaserer ML, Eickelmann M, Metze D, Luger TA, Beissert S, Loser K. RANK is expressed in metastatic melanoma and highly upregulated on melanoma-initiating cells. J Invest Dermatol. 2011;131:944–55. doi: 10.1038/jid.2010.377. [DOI] [PubMed] [Google Scholar]
- 28.Girotti MR, Pedersen M, Sanchez-Laorden B, Viros A, Turajlic S, Niculescu-Duvaz D, Zambon A, Sinclair J, Hayes A, Gore M, et al. Inhibiting EGF receptor or SRC family kinase signaling overcomes BRAF inhibitor resistance in melanoma. Cancer Discov. 2013;3:158–67. doi: 10.1158/2159-8290.CD-12-0386. [DOI] [PMC free article] [PubMed] [Google Scholar]
- 29.Held MA, Langdon CG, Platt JT, Graham-Steed T, Liu Z, Chakraborty A, Bacchiocchi A, Koo A, Haskins JW, Bosenberg MW, et al. Genotype-selective combination therapies for melanoma identified by high-throughput drug screening. Cancer Discov. 2013;3:52–67. doi: 10.1158/2159-8290.CD-12-0408. [DOI] [PMC free article] [PubMed] [Google Scholar]
- 30.Bertazza L, Mocellin S. The dual role of tumor necrosis factor (TNF) in cancer biology. Curr Med Chem. 2010;17:3337–52. doi: 10.2174/092986710793176339. [DOI] [PubMed] [Google Scholar]
- 31.Khodarev NN, Roizman B, Weichselbaum RR. Molecular pathways: interferon/stat1 pathway: role in the tumor resistance to genotoxic stress and aggressive growth. Clin Cancer Res. 2012;18:3015–21. doi: 10.1158/1078-0432.CCR-11-3225. [DOI] [PubMed] [Google Scholar]
- 32.Wang LC, Okitsu CY, Zandi E. Tumor necrosis factor alpha-dependent drug resistance to purine and pyrimidine analogues in human colon tumor cells mediated through IKK. J Biol Chem. 2005;280:7634–44. doi: 10.1074/jbc.M413384200. [DOI] [PubMed] [Google Scholar]
- 33.Yasuoka Y, Naomoto Y, Yamatsuji T, Takaoka M, Kimura M, Uetsuka H, Matsubara N, Fujiwara T, Gunduz M, Tanaka N, et al. Combination of tumor necrosis factor alpha and interferon alpha induces apoptotic cell death through a c-myc-dependent pathway in p53 mutant H226br non-small-cell lung cancer cell line. Exp Cell Res. 2001;271:214–22. doi: 10.1006/excr.2001.5383. [DOI] [PubMed] [Google Scholar]
- 34.Klefstrom J, Arighi E, Littlewood T, Jäättelä M, Saksela E, Evan GI, Alitalo K. Induction of TNF-sensitive cellular phenotype by c-Myc involves p53 and impaired NF-kappaB activation. EMBO J. 1997;16:7382–92. doi: 10.1093/emboj/16.24.7382. [DOI] [PMC free article] [PubMed] [Google Scholar]
- 35.Boccellino M, Giuberti G, Quagliuolo L, Marra M, D’Alessandro AM, Fujita H, Giovane A, Abbruzzese A, Caraglia M. Apoptosis induced by interferon-alpha and antagonized by EGF is regulated by caspase-3-mediated cleavage of gelsolin in human epidermoid cancer cells. J Cell Physiol. 2004;201:71–83. doi: 10.1002/jcp.20058. [DOI] [PubMed] [Google Scholar]
- 36.Yamaoka T, Yan F, Cao H, Hobbs SS, Dise RS, Tong W, Polk DB. Transactivation of EGF receptor and ErbB2 protects intestinal epithelial cells from TNF-induced apoptosis. Proc Natl Acad Sci U S A. 2008;105:11772–7. doi: 10.1073/pnas.0801463105. [DOI] [PMC free article] [PubMed] [Google Scholar]
- 37.Caraglia M, Leardi A, Corradino S, Ciardiello F, Budillon A, Guarrasi R, Bianco AR, Tagliaferri P. alpha-Interferon potentiates epidermal growth factor receptor-mediated effects on human epidermoid carcinoma KB cells. Int J Cancer. 1995;61:342–7. doi: 10.1002/ijc.2910610312. [DOI] [PubMed] [Google Scholar]
- 38.Carlberg AL, Moberg KH, Hall DJ. Tumor necrosis factor and gamma-interferon repress transcription from the c-myc P2 promoter by reducing E2F binding activity. Int J Oncol. 1999;15:121–6. doi: 10.3892/ijo.15.1.121. [DOI] [PubMed] [Google Scholar]
- 39.Harvey WH, Harb OS, Kosak ST, Sheaffer JC, Lowe LR, Heerema NA. Interferon-alpha-2b downregulation of oncogenes H-ras, c-raf-2, c-kit, c-myc, c-myb and c-fos in ESKOL, a hairy cell leukemic line, results in temporal perturbation of signal transduction cascade. Leuk Res. 1994;18:577–85. doi: 10.1016/0145-2126(94)90039-6. [DOI] [PubMed] [Google Scholar]
- 40.Wang Y, Roche O, Xu C, Moriyama EH, Heir P, Chung J, Roos FC, Chen Y, Finak G, Milosevic M, et al. Hypoxia promotes ligand-independent EGF receptor signaling via hypoxia-inducible factor-mediated upregulation of caveolin-1. Proc Natl Acad Sci U S A. 2012;109:4892–7. doi: 10.1073/pnas.1112129109. [DOI] [PMC free article] [PubMed] [Google Scholar]
- 41.Terui K, Haga S, Enosawa S, Ohnuma N, Ozaki M. Hypoxia/re-oxygenation-induced, redox-dependent activation of STAT1 (signal transducer and activator of transcription 1) confers resistance to apoptotic cell death via hsp70 induction. Biochem J. 2004;380:203–9. doi: 10.1042/BJ20031891. [DOI] [PMC free article] [PubMed] [Google Scholar]
- 42.Yu X, Deng L, Wang D, Li N, Chen X, Cheng X, Yuan J, Gao X, Liao M, Wang M, et al. Mechanism of TNF-α autocrine effects in hypoxic cardiomyocytes: initiated by hypoxia inducible factor 1α, presented by exosomes. J Mol Cell Cardiol. 2012;53:848–57. doi: 10.1016/j.yjmcc.2012.10.002. [DOI] [PubMed] [Google Scholar]
- 43.Li Q, Kluz T, Sun H, Costa M. Mechanisms of c-myc degradation by nickel compounds and hypoxia. PLoS One. 2009;4:e8531. doi: 10.1371/journal.pone.0008531. [DOI] [PMC free article] [PubMed] [Google Scholar]
- 44.Gerber SA, Pober JS. IFN-alpha induces transcription of hypoxia-inducible factor-1alpha to inhibit proliferation of human endothelial cells. J Immunol. 2008;181:1052–62. doi: 10.4049/jimmunol.181.2.1052. [DOI] [PMC free article] [PubMed] [Google Scholar]
- 45.Hellwig-Bürgel T, Stiehl DP, Wagner AE, Metzen E, Jelkmann W. Review: hypoxia-inducible factor-1 (HIF-1): a novel transcription factor in immune reactions. J Interferon Cytokine Res. 2005;25:297–310. doi: 10.1089/jir.2005.25.297. [DOI] [PubMed] [Google Scholar]
- 46.Johnston PA, Grandis JR. STAT3 signaling: anticancer strategies and challenges. Mol Interv. 2011;11:18–26. doi: 10.1124/mi.11.1.4. [DOI] [PMC free article] [PubMed] [Google Scholar]
- 47.Grivennikov SI, Karin M. Dangerous liaisons: STAT3 and NF-kappaB collaboration and crosstalk in cancer. Cytokine Growth Factor Rev. 2010;21:11–9. doi: 10.1016/j.cytogfr.2009.11.005. [DOI] [PMC free article] [PubMed] [Google Scholar]
- 48.Mamlouk S, Wielockx B. Hypoxia-inducible factors as key regulators of tumor inflammation. Int J Cancer. 2013;132:2721–9. doi: 10.1002/ijc.27901. [DOI] [PubMed] [Google Scholar]
- 49.Majewski IJ, Bernards R. Taming the dragon: genomic biomarkers to individualize the treatment of cancer. Nat Med. 2011;17:304–12. doi: 10.1038/nm.2311. [DOI] [PubMed] [Google Scholar]
- 50.Chiarle R, Voena C, Ambrogio C, Piva R, Inghirami G. The anaplastic lymphoma kinase in the pathogenesis of cancer. Nat Rev Cancer. 2008;8:11–23. doi: 10.1038/nrc2291. [DOI] [PubMed] [Google Scholar]
- 51.Barretina J, Caponigro G, Stransky N, Venkatesan K, Margolin AA, Kim S, Wilson CJ, Lehár J, Kryukov GV, Sonkin D, et al. The Cancer Cell Line Encyclopedia enables predictive modelling of anticancer drug sensitivity. Nature. 2012;483:603–7. doi: 10.1038/nature11003. [DOI] [PMC free article] [PubMed] [Google Scholar]
- 52.Guyon I, Weston J, Barnhill S, Vapnik V. Gene Selection for Cancer Classification using Support Vector Machines. Mach Learn. 2002;46:389–422. doi: 10.1023/A:1012487302797. [DOI] [Google Scholar]
- 53.Dry JR, Pavey S, Pratilas CA, Harbron C, Runswick S, Hodgson D, Chresta C, McCormack R, Byrne N, Cockerill M, et al. Transcriptional pathway signatures predict MEK addiction and response to selumetinib (AZD6244) Cancer Res. 2010;70:2264–73. doi: 10.1158/0008-5472.CAN-09-1577. [DOI] [PMC free article] [PubMed] [Google Scholar]
Associated Data
This section collects any data citations, data availability statements, or supplementary materials included in this article.