

Abstract
GFP and luciferase are used extensively as markers both in vitro and in vivo although both have limitations. The utility of GFP fluorescence is restricted by high background signal and poor tissue penetrance. Luciferase throughput is limited in vitro by the requirement for cell lysis, while in vivo, luciferase readout is complicated by the need for substrate injection and the dependence on endogenous ATP. Here we show that near-infrared fluorescent protein in combination with widely available near-infrared scanners overcomes these obstacles and allows for the accurate determination of cell number in vitro and tumor growth in vivo in a high-throughput manner and at negligible per-well costs. This system represents a significant advance in tracking cell proliferation in tissue culture as well as in animals, with widespread applications in cell biology.
Keywords: near-infrared fluorescence, iRFP cell number quantification, in vivo, cancer
Introduction
Quantifying luminescence or fluorescence of genetically encoded markers within cells is a well-established tool to measure many aspects of cell behavior, including cell proliferation in vitro and in vivo.1-3 Although used ubiquitously for these applications, both of these techniques have major drawbacks. Fluorescent proteins (FPs) like GFP are useful in single-cell studies but are undesirable for macroscopic, high-throughput, and animal studies due to their high background and limited tissue penetrance. Luciferase addresses some of these problems but has its own drawbacks: in vitro luciferase assays work best with lysates, making time-course analyses extremely cumbersome and adding variability. Moreover, non-destructive luciferase assays depend on cellular ATP and the diffusion of exogenous luciferin. These issues make absolute quantification of experiments difficult. In vivo, this problem is multiplied, as poor diffusion of the substrate into target tissues with poor vascularization (like solid tumors) results in low luciferin bioavailability. Furthermore, luciferase is only active in living cells, as its bioluminescence relies on ATP. Indirect detection in tissue sections by immunohistochemistry is difficult due to the poor quality of luciferase antibodies for immunohistochemistry. Also, sections stained in this way cannot be used again to counterstain for another protein of interest.
Here we demonstrate that near-infrared fluorescent protein (iRFP) in combination with readily available high-throughput, near-infrared scanners can overcome many of the obstacles demonstrated by FPs and luciferase. The iRFP excitation and emission wavelengths are in the near-infrared spectrum,4 resulting in a much lower background fluorescence (particularly in biological samples) in comparison to visible light FPs. Use of iRFP as a marker allows for the accurate real-time determination of cell number in vitro, tumor growth in vivo, and in frozen sections in a high-throughput manner with minimal technical intervention.
Results
The LI-COR Odyssey is a near-infrared scanner offering high-throughput detection of fluorescence in the 700 and 800 nm spectra. Transiently transfected HCT116 cells with piRFP or peGFP as control were scanned 36 h post-transfection (Fig. 1A), showing that the LI-COR 700 nm channel was suitable to specifically detect iRFP expression in live cells.

Figure 1. iRFP can be detected in the LI-COR to monitor cell growth. (A) LI-COR 700 nm scan of parental HCT116 cells and HCT116 cells transiently transfected with iRFP expression plasmid. (B) HCT116 WT and p53R248W/-mutant cells stably expressing iRFP were plated and counted, or Odyssey quantified at the indicated times. Error bars represent SEM of 3 technical replicates. (C) HCT116 WT and p53R248W/- mutant cells stably expressing iRFP were treated with the indicated doses of Nutlin and quantified using the Odyssey at the indicated times. Error bars represent SEM of 3 parallel processed replicates.
Next, we cloned the iRFP open reading frame in an IRES puro backbone and generated stable iRFP-overexpressing HCT116 cell lines (parental HCT116, which express wild-type p53 [WT], and HCT116 expressing mutant p53R248W/-) by transfection and subsequent puromycin selection. During this process, we did not detect obvious cytotoxicity, consistent with previously published data.4 Cells were then seeded into 96-well plates, and, over a time-course, wells were scanned to obtain fluorescence readings and then harvested to allow for manual counting of cell number using a hemocytometer (Fig. 1B). Comparison between the graphs demonstrates that iRFP fluorescence is an excellent proxy for cell number. The clear advantages of iRFP fluorescence quantification are the speed and precision by which data can be collected and processed without the requirement to harvest cells. This allows for real-time monitoring of cell growth in a single well, with high-throughput at very low acquisition and running costs. To determine whether iRFP can detect drug-induced changes in proliferation, we investigated the effect of Nutlin on WT and mutant p53 HCT116 cells. Nutlin inhibits p53 degradation by MDM2, thereby leading to p53 accumulation, which in the case of WT p53, leads to a p21-dependent cell cycle arrest. p53R248W/- cells, which express mutant p53 that is unable to bind DNA, do not undergo a p21-dependent cell cycle arrest in response to Nutlin. As expected, HCT116 WT cells grew exponentially if left untreated, but showed a strong growth inhibition when treated with 1 µM Nutlin. Higher doses completely inhibited any detectable cell growth (Fig. 1C). Untreated mutant p53R248W/- HCT116 cells proliferated comparably to WT p53 cells, but even 10 µM Nutlin incubation did not show any significant effect on cell proliferation in these cells. Taken together, this shows that iRFP is a robust and sensitive measure for cell proliferation in HCT116 cells and suitable to analyze drug effects on proliferation.
Encouraged by these initial findings, we generated several cell lines stably expressing iRFP to determine the versatility of the technique. iRFP expressing U2OS, HeLa, 3T3, and cMyc/Ha-RasG12V-transformed 3T3 cells were plated in doubling dilutions in replicates of 12, or 6 in the case of the 3T3 cells. After 8 h attachment time, the plates were scanned (Fig. 2A–C, left), the iRFP signal quantified and plotted against the plated cell number (Fig. 2A–C, right). This demonstrated that there is a linear correlation between cell number and relative fluorescence over several orders of magnitude with minimal error and background. Moreover, the scans also allowed for the documentation of equal cell distribution within a well.

Figure 2. iRFP as a marker for cell number in vitro. Doubling dilution of U2OS (A), HeLa (B), and parental or cMyc/Ha-RasG12V-transformed 3T3 cells (C) stably expressing iRFP. Cells were seeded in 96-well plates at the indicated numbers by doubling dilutions. After 8 h, plates were scanned (left) the iRFP signal determined and and plotted against cell number. Error bars indicate SEM of 12 (A and B) or 6 (C) replicate wells.
By repeatedly re-scanning the same plate over time, we could determine the growth curves for different cell lines and verify in several cell lines that the iRFP signal stopped increasing as cells reached confluency (Fig. 3A–C), suggesting that iRFP protein does not further accumulate in confluent cells over time. iRFP detection by LI-COR, therefore, provided accurate growth curve measurements for several cell lines with minimal error and at extremely high-throughput. Interestingly, these measurements revealed that at low density, cMyc/Ha-RasG12V-transformed 3T3 fibroblasts did not proliferate more quickly than untransformed 3T3s, but reached a higher cell density (so continued to proliferate for longer) due to reduced contact inhibition. Nevertheless, these cells also reached a saturation point (as indicated by plateauing of the fluorescence curve) at a defined point (Fig. 3C).
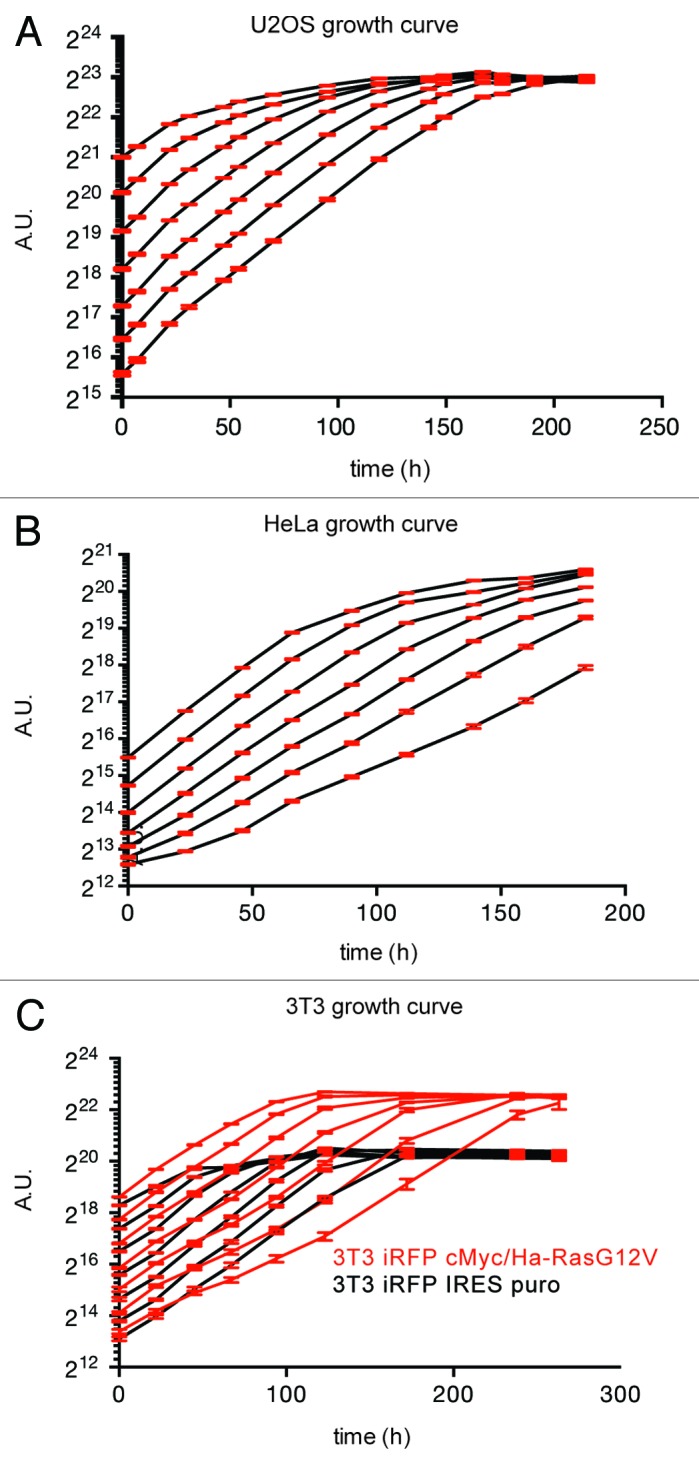
Figure 3. iRFP as a marker for cell proliferation in vitro. (A–C) Plates as described in Figure 2 were scanned at the indicated time points, quantified, and plotted over time. Error bars indicate SEM of 12 replicate wells.
To demonstrate that scanning 96-well plates is a suitable method to screen for cell viability and proliferation over time during drug treatment, we incubated iRFP-expressing HeLa cells with 3 chemotherapeutic drugs. These experiments were performed in replicates of 4, and iRFP fluorescence was monitored over 90 h (Fig. 4A and B). The growth curves showed exponential growth in untreated cells, while the addition of chemotherapeutics caused cell cycle arrest and cell death, resulting in a reduction of iRFP signal over time. The cells showed varying responses to each drug, but growth as measured by iRFP fluorescence correlated well with the concentration of each drug used. These studies demonstrated that analyses using iRFP intensity are well suited to high-throughput screening of compounds with good temporal resolution, sufficient sensitivity and robustness to detect modest effects on proliferation.
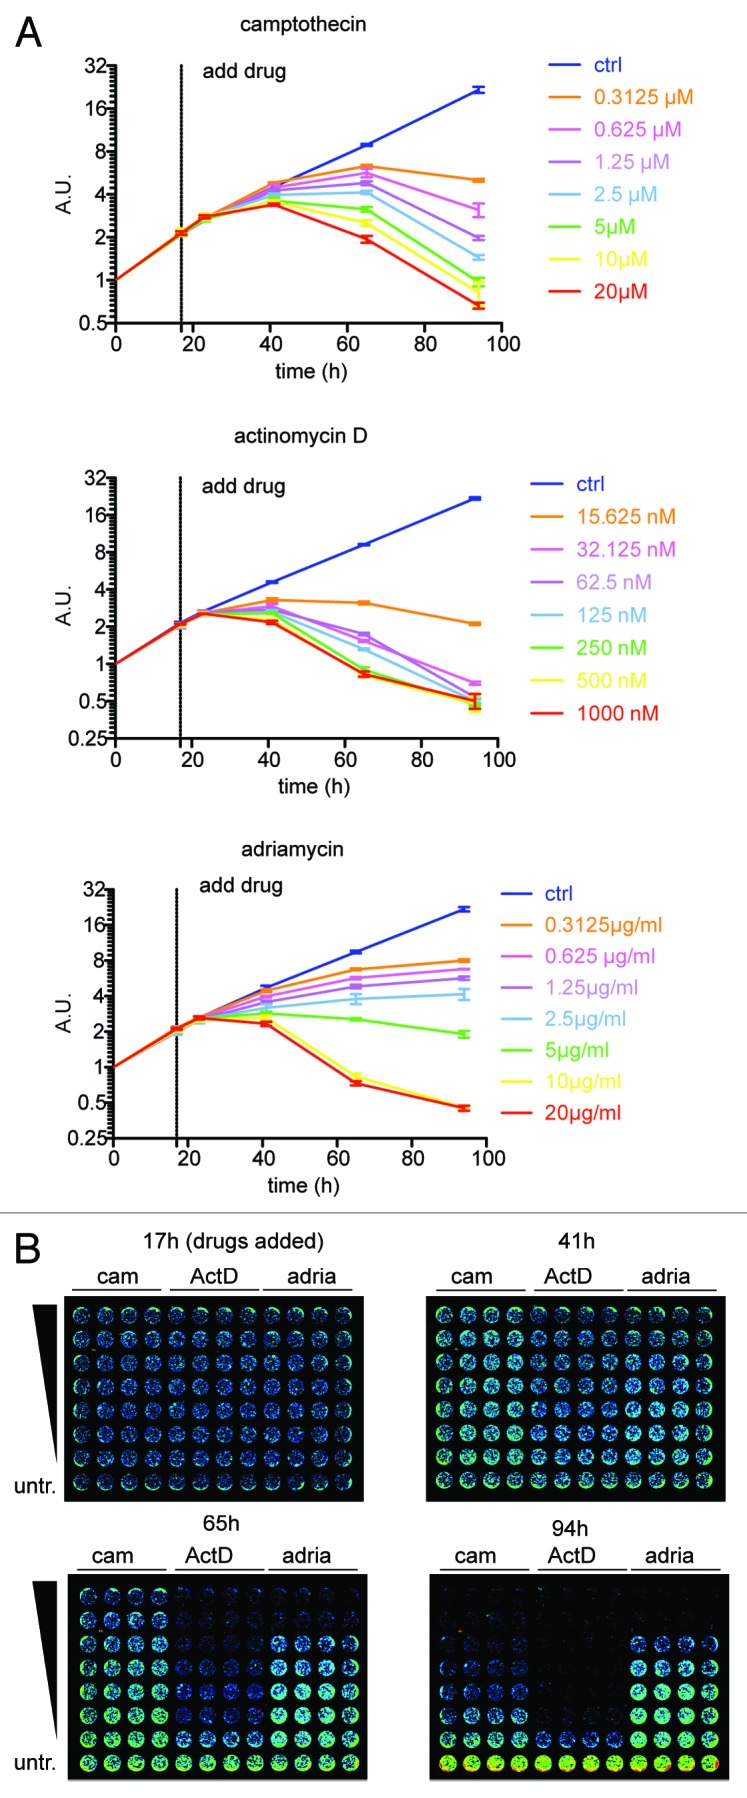
Figure 4. iRFP quantification to monitor the effect of drugs on cell growth. (A) HeLa cells described in Figures 2Band3B were plated at 7500 cells per well, quantified after 7 h settling time (t0), and treated after 17 h with the indicated drugs. Error bars indicate SEM of 4 replicate wells. (B) Selected Odyssey 700 nm scans of iRFP expressing HeLa cells treated at the indicated time points with several concentrations of chemotherapeutics.
As iRFP showed such a close correlation with cell number, and its excitation and emission wavelengths have superior tissue penetration in comparison to visible light FPs (along with lower non-specific background signal), we reasoned that iRFP would be a good marker to quantify tumor growth in vivo. While other studies have shown that iRFP is detectable in an IVIS imaging system,4,5 the impact of iRFP expression on the growth of cells as xenografts has, until now, not been carefully analyzed.
A potential complication for using iRFP in vivo is that it binds biliverdin in order to work as a fluorophore, and so may affect the availability of biliverdin to other processes in the cell. Although no toxicity was observed in vitro,4 biliverdin levels may be limiting in vivo, so iRFP expression could potentially affect cell growth under these conditions. To exclude this complication, we compared a number of parental HeLa cells to iRFP-overexpressing clones in a xenograft model. Analysis of tumor growth did not reveal a significant difference between the 2 groups of cells (Fig. 5A), suggesting that iRFP overexpression does not alter tumor development, consistent with our in vitro data. To test whether the LI-COR scanner is suitable to detect iRFP signal in high resolution in whole mice, we analyzed 2 iRFP HeLa xenografts in comparison with 2 control HeLa xenografts (Fig. 5B). Even at the lowest excitation setting, the LI-COR detected a strong signal of over 500-fold above background in larger tumors (e.g. 953 mm3, mouse 2, Fig. 5C). At these settings, even smaller tumors (e.g. 219 mm3, mouse 1) gave a robust signal that was 29-fold higher than control tumors of comparable size (Fig. 5C).

Figure 5. iRFP as a marker for tumor growth in vivo: (A) 3 × 10⁶ HeLa cells were subcutaneously injected into CD1 nude mice. Tumor volumes were determined by caliper measurement at indicated time-points. Comparison of parental with iRFP expressing HeLa tumors did not reveal any significant differences. Error bars represent the SEM of tumor measurements shown on the left (B) 700 nm Odyssey scans of the indicated mice in Figure 5A. (C) Odyssey quantification of Figure 5B. (D) Left: Odyssey scans of mice 21 days after IP injection with 2 × 10⁶ iRFP expressing HeLa cells. An untreated mouse is shown as control. 700-nm scan (red) was used to visualize the tumors, and 800 nm scan (green) to show the outline of the mouse. Right: Pseudo-color representation of the 700 nm channel. (E) Frozen sections of tumor and surrounding tissue of mouse 2 and 4. Tumors were frozen, cut, and fixed with PFA followed by an actin stain. Top panels: Odyssey scan with the iRFP signal in the 700 nm channel (red) and the anti-actin antibody signal in the 800 nm channel (green). Bottom panel: Pseudo-color representations of the iRFP signal detected by Odyssey scan in the 700 nm channel.
To determine if the iRFP signal is also suitable to detect tumor growth in deeper tissues that cannot be monitored by calipers or other commonly used fluorescence markers, we used the same iRFP-overexpressing HeLa cell line in nude mice and analyzed intra-peritoneal (IP) injected or control mice side-by-side in the LI-COR (Fig. 5D). This revealed that iRFP-positive tumors in the intra-peritoneal cavity are detected without any additional technical intervention and without moving animals to a special in vivo imaging diet, thus demonstrating that even in deeper tissues, iRFP fluorescence is strong enough to be detected by a LI-COR scanner.
To test if the infrared signal could be used to detect tumor cells in tissue sections, the tumors from mice 2 and 4 were removed, frozen on dry ice, and sectioned in a cryo-microtome. These frozen sections were fixed in PFA for 10 min, counterstained with anti-actin antibodies (secondary anit-mouse antibody labeled with IRDye 800CW), and then scanned using the LI-COR (Fig. 5E). The sections retained iRFP fluorescence and clearly delineated the extent of tumor cell spread, while the tumors derived from the parental cell line showed no significant background signal in the 700 nm channel. The actin staining could be visualized in the 800 nm channel without any bleed through. Clearly the iRFP signal is not inactivated by PFA fixation and can be used as a direct marker for tumors, demonstrating that LI-COR scanning of cryosections is suitable for the rapid imaging of multiple tumor sections with high-throughput and minimal histological work. Since the iRFP signal does not show any significant “bleed through” in the 800 nm channel, sections can be co-stained with another antibody, as demonstrated by the actin stain.
Discussion
The data presented demonstrate that the combination of iRFP and the LI-COR system is a robust, powerful, and efficient tool to monitor cell number in vitro and in vivo. Advantages of the system include the ability to make rapid and sequential real-time measurements with a high degree of accuracy. Although the data shown here focus on the use of iRFP in typical cancer biology assays, this method is not limited to this field and can be easily adapted to a wide range of assays, allowing for high-throughput data generation in basic screening scenarios and seamless migration to more detailed dose-response analyses over time both in vitro and in vivo.
Materials and Methods
Plasmids
pcDNA3.1+ (Invitrogen) was used as empty vector (EV) control. peGFP-C1 (Clontech) was used as GFP control. All iRFP derivatives were based on piRFP neo (Addgene Plasmid: 31857). Plasmids encoding iRFP IRES puro were generated by PCR amplification (KOD Hot Start Master Mix, TOYOBO, 71842) and ligation into pIRES puro2 by InFusion reaction (InFusion HD Eco Dry system, Clontech, 639684) according to manufacturer’s instructions. pBABE iRFP IRES puro was generated by amplifying the iRFP IRES puro cassette described above by PCR and inserting it into a pBABE vector by InFusion according to manufacturer’s instructions.
Cell culture
Stable HeLa (human cervical cancer, from ATCC) and U2OS (human osteosarcoma, from ATCC) clones were generated by transfecting parental cell lines with the indicated plasmids using Genejuice (Merck Millipore, 70967) according to manual, followed by selection with either puromycin 0.5 µg/ml (Sigma) or 500 µg/ml G-418 (Formedium). Drug resistant cells were then seeded sparsely, and clonal colonies were picked.
3T3 (mouse fibroblast) iRFP lines were generated by infection with the Phoenix eco system followed by puromycin selection. These cells were then re-infected with both cMyc and Ha-RasG12V to generate cMyc/Ha-RasG12V transformed 3T3s.
3T3 cells and derived lines were cultured in DMEM + 20 mM glutamine, 10% DCS and 2.5 µg/ml puromycin. All other cell lines and clones were cultured in DMEM + glutamine, 10% FCS and appropriate selection markers (G-418 for U2OS, puromycin for HeLa) in a 37 °C incubator at 5% CO2. Camptothecin, actinomycin D and adriamycin (all from Sigma) were used at the indicated concentrations and times.
Antibodies
Actin (Millipore, C4, MAB1501), anti-mouse secondary antibody (LI-COR, IRDye 800CW donkey anti-mouse, 926-32212)
Xenografts
Subcutaneous (3 × 10⁶ cells) and IP (2 × 10⁶ cells) injections of HeLa iRFP cells were performed on CD-1-Foxn1nu female mice (Charles River). Mice were housed in sterile IVC cages, monitored thrice weekly, and killed humanely when tumors reached clinical endpoint of predetermined size (volume = [length × width2]/2) or ulceration as previously described.6 All animal work was approved by Ethical Review Process (University of Glasgow) and undertaken in line with the UK Animals (Scientific Procedures) Act of 1986 and the EU Directive 2010. Tumor volume data in Figure 5A and C represent volume determinations by caliper measurements.
iRFP imaging
All images where generated by scanning the samples in a LI-COR Odyssey with settings that allow representative display of iRFP signal. All cell quantification assays were performed in CellBIND flat clear bottom black polystyrene microplates (Corning, 3340), on a LI-COR Odyssey. For quantification, plates were scanned at 169 µm resolution, 3.5 mm offset and a low intensity setting, depending on sample brightness. Image Studio software (LI-COR, V2.1.10) was used to scan and quantify the plates. Prism (Graph Pad, Mac V5.0C) was used for data plotting, background correction, and statistical analysis. R2 values and graph of the dilution series (Fig. 2A–C) represent the outcome of Graph Pad Prism log–log fit.
Histology
Mouse tumors were extracted, snap frozen on dry ice, and cut using a cryo-microtome. Sections were fixed in 4% PFA/PBS for 10 min at room temperature, washed 3 times, and blocked/permeabilized in BloPerm buffer (PBS 0.25%/Triton X-100/10% FCS) for 10 min. Slides were then incubated with anti-actin antibody (1:200 in PBS-T/10% FCS) for 30 min at room temperature and washed 3 times in PBS. This was followed by 20 min of incubation with secondary antibody (LI-COR IRDye 800CW donkey anti-mouse 1:200 in PBS-T/10% FCS), 3 washing steps in PBS, and a LI-COR scan.
Acknowledgments
We would like to acknowledge funding from Cancer Research UK and an MRC studentship (PL). The authors thank the Biological Services at the Cancer Research UK Beatson Institute for technical assistance.
Disclosure of Potential Conflicts of Interest
No potential conflicts of interest were disclosed.
Author Contribution Statement
The majority of the experiments were designed by AH and KV and performed by AH, PL, and OM. Animal work was planned and performed by KB, AH, and SM. KV supervised the project; AH and KV wrote the paper.
Footnotes
Previously published online: www.landesbioscience.com/journals/cc/article/26985
References
- 1.Chudakov DM, Matz MV, Lukyanov S, Lukyanov KA. Fluorescent proteins and their applications in imaging living cells and tissues. Physiol Rev. 2010;90:1103–63. doi: 10.1152/physrev.00038.2009. [DOI] [PubMed] [Google Scholar]
- 2.Hong H, Yang Y, Cai W. Imaging gene expression in live cells and tissues. Cold Spring Harb Protoc. 2011;2011:top103. doi: 10.1101/pdb.top103. [DOI] [PMC free article] [PubMed] [Google Scholar]
- 3.Lyons SK, Patrick PS, Brindle KM. Imaging mouse cancer models in vivo using reporter transgenes. Cold Spring Harb Protoc. 2013;2013:685–99. doi: 10.1101/pdb.top069864. [DOI] [PubMed] [Google Scholar]
- 4.Filonov GS, Piatkevich KD, Ting LM, Zhang J, Kim K, Verkhusha VV. Bright and stable near-infrared fluorescent protein for in vivo imaging. Nat Biotechnol. 2011;29:757–61. doi: 10.1038/nbt.1918. [DOI] [PMC free article] [PubMed] [Google Scholar]
- 5.Shcherbakova DM, Verkhusha VV. Near-infrared fluorescent proteins for multicolor in vivo imaging. Nat Methods. 2013;10:751–4. doi: 10.1038/nmeth.2521. [DOI] [PMC free article] [PubMed] [Google Scholar]
- 6.Maddocks ODK, Berkers CR, Mason SM, Zheng L, Blyth K, Gottlieb E, Vousden KH. Serine starvation induces stress and p53-dependent metabolic remodelling in cancer cells. Nature. 2013;493:542–6. doi: 10.1038/nature11743. [DOI] [PMC free article] [PubMed] [Google Scholar]