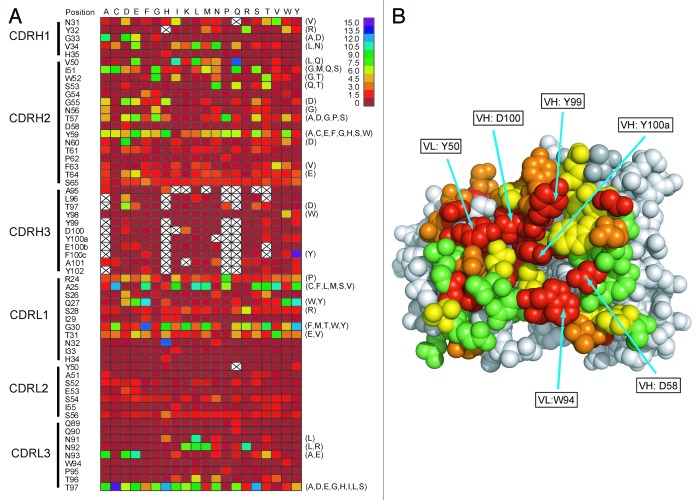
Figure 4. Structural analysis and positional tolerance to mutation. (A) Heatmap showing color coded ERs for each hu225 point mutation (where applicable data are average of multiple codons). To right of the heatmap in parentheses are indicated 67 higher affinity point mutations confirmed by FACS-based assay. Blank spaces indicate variants for which fewer than 10 total occurrences were found in the expression gate and which were eliminated from the analysis. (B) Average ER for all codon variants at each position color-coded and plotted onto the cetuximab Fab / EGFR crystal structure.11 Color code: average ER 0–0.125 (red), 0.125–0.75 (orange), 0.75–1.5 (yellow) and greater than 1.5 (green).

An official website of the United States government
Here's how you know
Official websites use .gov
A
.gov website belongs to an official
government organization in the United States.
Secure .gov websites use HTTPS
A lock (
) or https:// means you've safely
connected to the .gov website. Share sensitive
information only on official, secure websites.
