Abstract
Objectives:
To evaluate the efficacy of ultrasonography (USG) as a non-invasive tool in assessing the severity of oral submucous fibrosis (OSMF) and also to assess the relationship between OSMF and hypertrophy of the masseter muscle.
Materials and Methods:
The submucosal thickness in buccal mucosa and masseteric muscle hypertrophy were measured using ultrasound (10-15 MHz) in 60 patients comprising 30 OSMF patients and 30 controls.
Results:
Results were analyzed by one way analysis of variance, Chi-square test and t-test. As the stages of OSMF advanced there was an increase in submucosal thickness of the buccal mucosa as well as masseter muscle thickness in both relaxed and contracted state in the study group when compared with controls (P < 0.005).
Conclusion:
USG is an effective non-invasive zero radiation tool for assessing the progression of OSMF.
Keywords: Ultrasonography, oral submucous fibrosis, masseter hypertrophy, submucosal thickness
INTRODUCTION

Oral submucous fibrosis (OSMF) is a potentially malignant disorder that primarily affects any part of the oral cavity and sometimes even the pharynx. People with OSMF carry a high risk of developing oral cancer. OSMF is found predominantly among the people of South Asia and is closely linked with the habit of chewing betel quid and tobacco containing products.[1] The tissues most frequently affected by OSMF in the oral cavity are buccal mucosa and retromolar area, followed by the soft palate, palatal fauces, uvula, tongue, and labial mucosa.[2] Clinical diagnosis of OSMF is usually made based on several characteristic features of OSMF, including intolerance to spicy foods, blanching and stiffness of the oral mucosa, fibrous bands in the buccal or labial mucosa, and progressive inability to open the mouth.[3]
The overall prevalence of OSMF in India is about 0.5% with a range of 0.2-1.2% in different regions of the country. The exact etiology of OSMF is not well understood. The different causative agents include intake of spicy food, chewing of betel nut, betel quid, and preparations containing tobacco (pan masala, gutka, khaini, etc.).[4] OSMF has a high rate of morbidity because it causes a progressive inability to open the mouth, resulting in poor eating and consequent nutritional deficiencies. OSMF also has a significant mortality rate because it is a precursor to oral cancer, particularly squamous cell carcinoma, seen in 7.6% of the cases.[5]
Masseter muscle hypertrophy usually presents as a relatively firm painless preauricular swelling but may cause considerable diagnostic difficulty. The thickness and functions of the masseter muscle can be assessed by various modalities.[6] Fibrosed buccal mucosa causes constriction of tissue and results in flattening of the cheek or appearance of sunken cheek, which might also exacerbate the appearance of the masseter muscle.
Ultrasonography (USG) is particularly suitable for imaging superficial structures of the head and neck region. USG provides both qualitative and quantitative assessment. Qualitatively, it provides information on the nature of a lesion and its relation to adjacent normal structures. Quantitatively, it assesses the dimensions of the lesion, its distance from the skin surface and its relative proximity to skin and mucosal surfaces.[7] Up till now and despite extensive studies, there is no conclusive evidence of adverse biological effects of the use of USG as it does not produce ionizing radiation.[6]
MATERIALS AND METHODS
The present study was conducted in the outpatient department of Oral Medicine Diagnosis and Radiology. A total of 60 patients were involved in the study. The study population was divided into 2 groups. Group I consisted of 30 patients who were nonsmokers but who chewed tobacco and were clinically diagnosed as having OSMF and Group II consisted of 30 normal people who were nonsmokers and who did not chew tobacco and were clinically diagnosed as not having OSMF. Permission from the Institutional Ethical Committee was obtained before starting the study. Informed consent was obtained from patients to participate in this study.
The inclusion criteria included patients with a positive history of chewing areca nut (also called betel nut) or one of the commercial preparations containing areca nut and tobacco with clinical symptoms such as a burning sensation on eating spicy food, difficulty in swallowing, chewing, blanching of the oral mucosa, palpable fibrous bands, and restricted mouth opening. The exclusion criteria were fibrosis of the oral mucosa leading to decreased mouth opening due to anemia, scleroderma, post radiation therapy, and masseter muscle hypertrophy due to malocclusion, bruxism, and other deleterious habits.
Clinical staging of OSMF was based on the classification by Khanna and Andrade.[8]
Stage I
Very early cases, normal mouth opening, burning sensation, excessive salivation, acute ulceration and recurrent stomatitis. (N = 1)
Stage II
Early cases, mouth opening: 26-35 mm (interincisal opening), soft palate and faucial pillars are areas primarily affected, buccal mucosa appears mottled and marbled, with dense, pale, depigmented, and fibrosed areas alternating with pink normal mucosa, red erythematous patches, and widespread sheets of fibrosis. (N = 5)
Stage III
Moderately advanced cases, mouth opening: 15-25 mm (interincisal opening), trismus, vertical fibrous bands can be palpated and are firmly attached to underlying tissue, patient unable to puff out the cheeks or whistle, soft palate-fibrous bands seen to radiate from the pterygomandibular raphe or anterior faucial pillar in a scar-like appearance, atrophy of vermillion border of the lips, unilateral posterior cheek involvement with only ipsilateral involvement of the faucial pillar and soft palate, and reduced mouth opening. (N = 16)
Stage IVa
Advanced cases, stiffness/inelasticity of the oral mucosa, trismus, mouth opening: 2-15 mm (interincisal opening), fauces thickened, shortened and firm on palpation, uvula seen to be involved as a shrunken, small and fibrous bud, tongue movement restricted, papillary atrophy (diffuse), lips-circular band felt around entire mouth, intraoral examination is difficult. (N = 8)
Stage IVb
Advanced cases with premalignant and malignant changes, OSMF and leukoplakia, OSMF and squamous cell carcinoma. (N = 0)
In the study group, all were male patients in the age range of 19-50 years with a mean age of 31.0 ± 3.9 years. All 30 patients were nonsmokers but used tobacco products, 15 patients (50%) chewed pan (betel nut), 10 (33%) chewed gutkha (preparation containing tobacco), and 5 (17%) chewed tobacco. The chewing of tobacco and betel nut products had been a habit for less than 5 years in 9 patients (30%), 5-10 years in 18 patients (60%), and more than 10 years in 3 patients (10%). Regarding frequency, 8 (27%) patients consumed <5 packets of raw tobacco, betel nut or tobacco containing products per day, 18 (60%) patients consumed 5-10 packets/day, and 4 (13%) patients consumed >10 packets/day. All patients kept the substances in the mouth for different lengths of time; 6 patients (20%) for less than 15 min, 20 (68%) for 15-30 min, and 4 (12%) for more than 30 min.
Age and sex matched 30 apparently healthy subjects with no history of areca nut and/or gutkha or tobacco chewing habit and with no appreciable malocclusion, bruxism, or any other mucosal lesions were selected. In the control group, all patients were males within the age group of 20-50 years with a mean age of 32.0 ± 3.0 years.
Ultrasonographic imaging was performed by a single trained general radiologist with the patient in the supine position. The USG device was an LOGIQ 5 PRO (GE medical systems, Milwaulkee, USA) with a multifrequency linear transducer with a frequency ranging from 10 to 15 MHz. Before starting USG for measuring submucosal thickness in buccal mucosa, participants were instructed to indicate the mucosa by placing the forefinger against the lining mucosa so as to delineate the empty space of the oral cavity. The transducer probe was placed in such a way that the soft tissues were not unduly compressed, because excess contact pressure while imaging might affect the measurements. Hence, to obtain exact measurements of the thickness of submucosa the probe was brought softly into contact with the surface. For ultrasonographic imaging of the buccal mucosa, an imaginary line was drawn between two points.
The first point was 1 cm anterior to the anterior border of the masseter muscle, indicating the posterior buccal mucosa (PBM) and the second was 1 cm posterior to the commissure of the lip, indicating the anterior buccal mucosa (ABM) [Figure 1]. The submucosal thickness was measured in cm along this line on both the right and left sides. Ultrasonographic imaging was performed with an extraoral approach by placing the linear transducer parallel to the lower border of the mandible [Figure 2]. The USG scan constituted a full representation of the cross-section of the buccal mucosa, in the submucosal and muscular planes. The mucosal lining was seen as a hyperechoic line and the submucosa as a hypoechoic band supported by muscle planes. This band of hypoechogenicity between the hyperechoic mucosa and muscle layer was measured as the submucosa thickness. The distance between the two hyperechoic lines i.e., mucosal lining and the muscle layer shown as ‘+’ marks on ABM and ‘x’ marks on PBM is measured with the help of the measuring tool in USG [Figures 3 and 4]. The measurements of right and left anterior and PBM were noted, two scans were taken per patient, one on the right side and the other on the left side.
Figure 1.
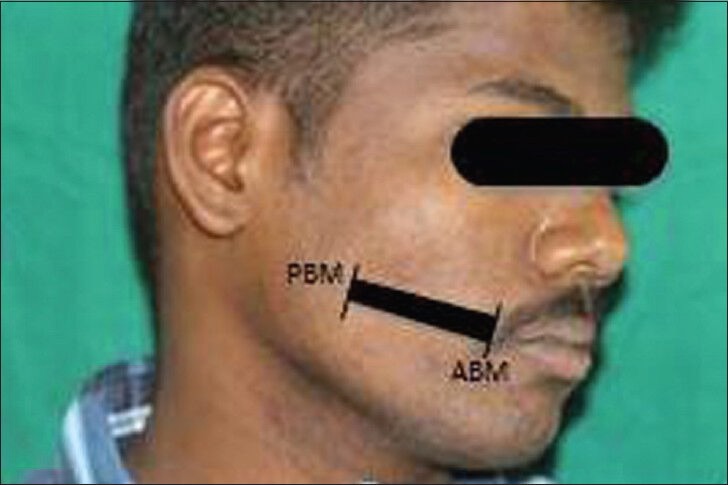
Photograph shows the side of the face marked with points for measuring submucosal thickness in the buccal mucosa region by ultrasonogram. The anterior buccal mucosa and posterior buccal mucosa points are connected by a line for placement of the transducer.
Figure 2.
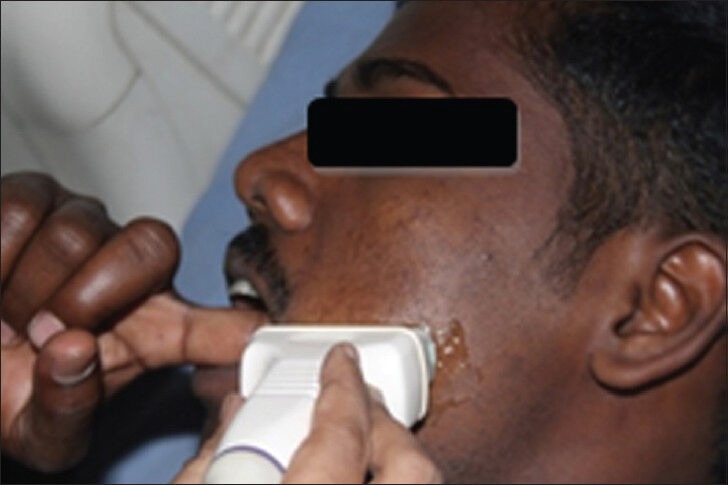
Photograph shows the placement position of the linear transducer and the patient's finger in the buccal mucosa for measuring the submucosal thickness by ultrasonogram.
Figure 3.
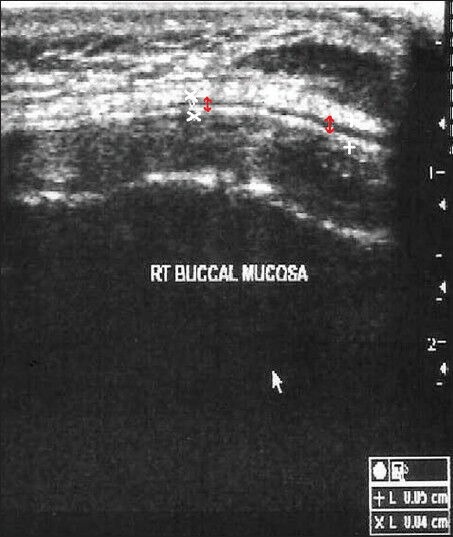
Ultrasonogram image of the submucosal thickness in buccal mucosa of a control patient, shows the submucosal thickness (red arrows).
Figure 4.
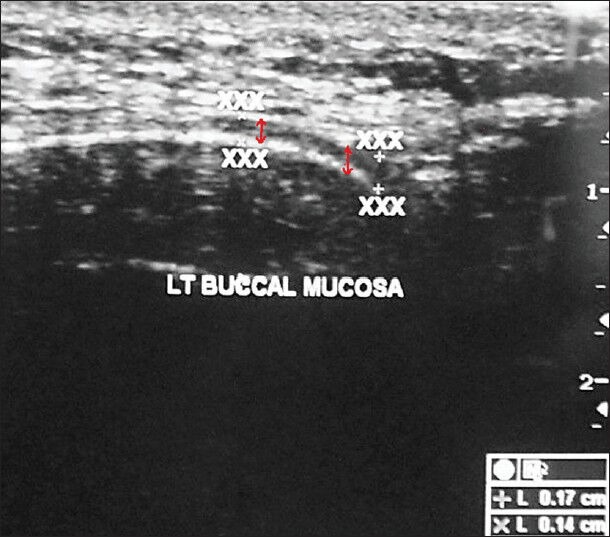
Ultrasound image of the buccal mucosa in a patient with oral submucous fibrosis shows the submucosal thickness (red arrows mark the thickness).
Ultrasonographic examination of the masseter muscle was done by a line drawn on the skin parallel to and 2 cm above the inferior border of the mandible, approximately corresponding to the most bulky part of the superficial portion of the masseter muscle. The ultrasonographic imaging of the masseter muscle was performed bilaterally both in relaxed and contracted state. The measuring sites were taken between P and A points where P is posterior, 1 cm from the posterior border of the ramus of the mandible and A is anterior near the anterior border of the ramus of the mandible [Figures 5 and 6]. The ultrasound scans from these measuring sites constitute a full representation of cross-section of superficial portion of the masseter muscle. The measurements of right and left masseter muscle hypertrophy were recorded in centimeter in both relaxed and contracted positions of the masseter muscle [Figures 7 and 8]. The distance between the two hyperechoic lines i.e., the superior most and inferior most shown as ‘+’ mark in a relaxed state and ‘x’ mark in contracred state was measured in centimeters with the help of the measuring tool in USG.
Figure 5.
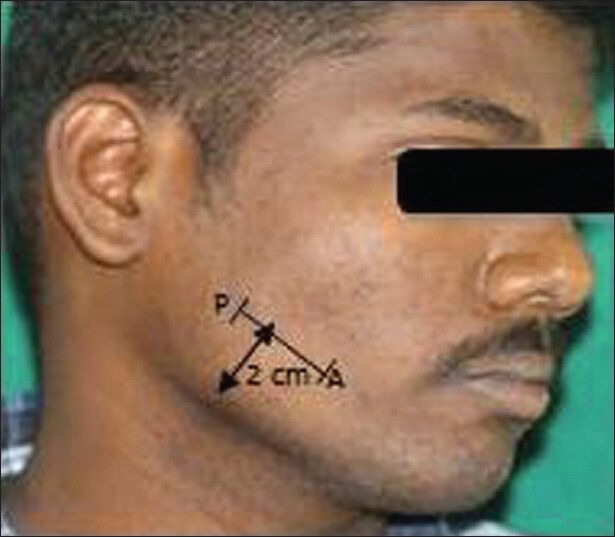
Photograph of the patient's face shows the anterior and posterior points of the masseter muscle connected by a line 2 cm above the lower border of mandible. This marks the position over which the transducer is placed.
Figure 6.
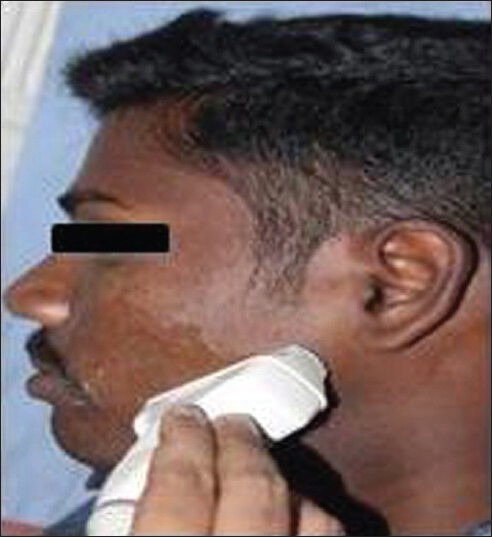
Photograph shows the placement position of the linear transducer such that it is over the masseter muscle for measuring the masseter muscle hypertrophy by ultrasonogram.
Figure 7.
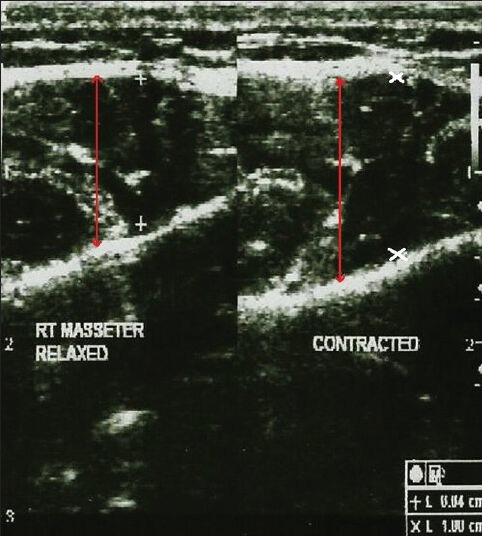
Ultrasonogram image of the masseter muscle in a control patient shows the masseter muscle thickness in both the relaxed and contracted state (red arrows).
Figure 8.
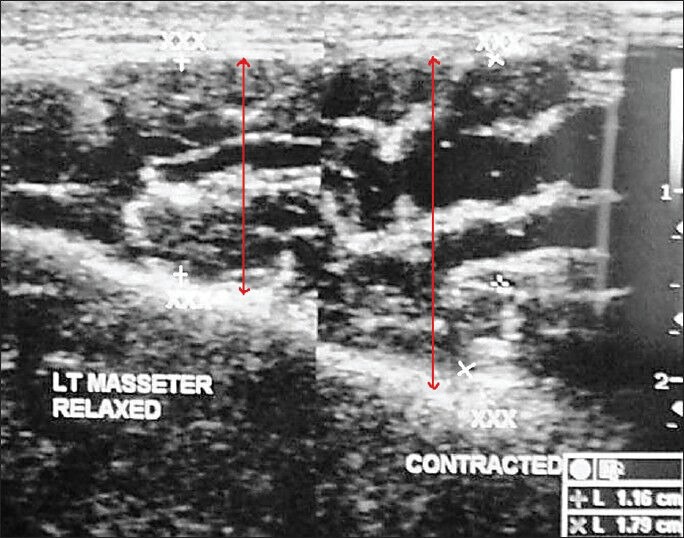
Ultrasonogram image of the masseter muscle in a patient with oral submucous fibrosis shows the masseter muscle hypertrophy in both the relaxed and contracted state (red arrow).
Statistical analysis
One way analysis of variance was used for multiple group comparison and t-test for two group comparisons. Chi-square test was used for analysis of categorical data. P < 0.05 was considered statistically significant.
RESULTS
The study group of 30 patients were identified as being in different stages of OSMF – Stage I (N = 1), Stage II (N = 5), Stage III (N = 16) and Stage IVa (N = 8). All 30 patients had a burning sensation in the mouth and varying degrees of restricted mouth opening. On intra-oral examination, maximum interincisal mouth opening ranged from 13 to 45 mm. Blanching and buccal fibrous bands were present in 29 patients (96.3%) in Stages II, III, and IVa. Floor of the mouth was involved in 8 (26.6%) Stage IVa patients, the uvula and faucial pillars in 24 (80%) Stages III and IVa patients, and the soft palate in 24 (80%) Stages III and IVa patients. Restricted movement of the soft palate was seen in 16 (53.6%) patients and restricted tongue movement in 8 (26.6%) patients. As the stage of OSMF advances, there was a significant decrease in the ability to open the mouth [Chart 1].
Chart 1.
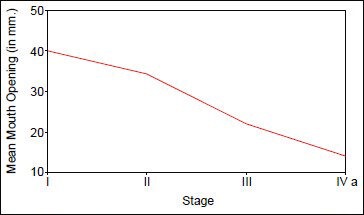
Correlation between mouth opening (in cm) and stages of OSMF
Table 1 data represents a startistically significant correlation between ultrasonographic readings of submucosal thickness, masseter hypertrophy, and clinical stages of OSMF. The range of the normal submucosal thickness was between 0.045 and 0.056 cm. In the study group submucosal thickness was more in the PBM than in the ABM probably due to the increased tendency of the people to keep the tobacco or betel nut in the region of the buccal pouch.
Table 1.
Correlation between USG measurements of submucossal thickness and masseter muscle hypertrophy (measured in cm) and clinical stage of OSMF

Table 2 data represents the comparison in ultrasonographic measurements of submucosal thickness, masseter hypertrophy between different stages of OSMF. In this comparison, the average ultrasonographic readings of submucosal thickness on the right and left side were taken. Similarly, average ultrasonographic readings of masseter hypertrophy in relaxed and contracted state of the right and left side was taken.
Table 2.
Comparison of the average submucossal thickness and masseter muscle hypertrophy (measured in cm) between the different stages of OSMF

Tables 3 and 4 data show that there was a statistically significant difference between ultrasonographic measurements of submucosal thickness and masseteric hypertrophy in OSMF and Control group (P < 0.001).
Table 3.
USG readings of submucosal thickness in OSMF patients and control group

Table 4.
Comparison of USG measurements of masseter hypertrophy in OSMF patients and control group

As the frequency of use (packets/day), time of retention in the mouth, and duration of the chewing habit increased, the stages of OSMF also advanced indicating the severity of OSMF was directly proportional to the above parameters [Table 5]. No significant difference is noted among patients using different commercial brands of smokeless tobacco products and their ultrasonographic measurements of submucosal thickness of buccal mucosa and co-existing masseter muscle hypertrophy [Table 6].
Table 5.
Correlation between clinical stages and chewing habits

Table 6.
Correlation between different commercial products of tobacco and USG measurements (cm)

DISCUSSION
OSMF is predominantly found among the people of South Asia and is closely associated with the habit of chewing betel nut and tobacco products.[1] The overall prevalence of oral submucous fibrosis in India is about 0.5% with a range of 0.2-1.2% in different regions of the country. Various etiological factors are being studied, such as genetic, autoimmune, nutritional, and environmental factors. Also studied are habits like intake of spicy food, chewing of betel nut, betel quid, and tobacco preparations (pan masala, gutka, tobacco, etc.).[4] OSMF also has a significant mortality rate because it can transform into oral cancer, particularly squamous cell carcinoma as seen in 7.6% of the cases.[5] The geographical distribution of OSMF shows confinement to tropical areas primarily the Indian subcontinent. OMSF can occur at any decade, but majority of the patients are between 20 and 40 years of age.[9] Recent epidemiological data indicates that, the number of of cases of OSMF has increased rapidly in India, The reasons for the rapid increase of the disease being an upsurge in the popularity of commercially manufactured tobacco preparations (pan masala) in India and an increase in their usage among young people.[10]
Submucosal thickness and masseter hypertrophy increases with advancing stage of OSMF as shown in Table 1. When the different stages were compared there was no statistical difference between Stage II and Stage III in submucosal thickness of buccal mucosa and masseter hypertrophy. But there were statistically significant differences between Stage II and Stage IVa and Stage III and Stage IVa as shown in Table 2. This difference shows that there is an increase in severity of submucosal fibrosis as the lesion advances beyond Stage II. This also helps in assessing prognosis after treatment. Between patients in the study group and the control group, there were statistically significant differences as shown in Tables 3 and 4.
Further analysis showed a significant correlation between frequency of chewing, number of packets used per day, duration of habit in years, length of time of retention of the product in the mouth (minutes) and submucosal thickness and masseter hypertrophy as measured by USG in OSMF patients (P < 0.005). There is no statistically significant difference between the commercial brands of smokeless tobacco products and submucosal thickness of buccal and co-existing masseter muscle hypertrophy (P > 0.080).
This study was consistent with that of the previous studies done by Manjunath et al.,[11] Rangaiah et al.,[7] Kamala et al.,[6] and Ariji et al.[12]
Limitation
Ultrasound is operator dependent and reading of the scan is dependent on the radiologist's experience. A probe with a higher frequency to penetrate effectively and produce good quality images is essential to be diagnostic.
CONCLUSION
From our study, we conclude that ultrasonogram is a non-invasive, zero radiation tool for assessing the progression of OSMF. USG shows a difference in the extent of submucosal fibrosis between Stage II and Stage III though statistically the difference was not appreciable. Clinically, vertical bands can be palpated in Stage III but not in Stage II. Though histolopathology is the Gold Standard to diagnose OSMF, biopsy is not performed in all patients because it results in scarring and worsening of the condition. Ultrasonogram can be used to assess the prognosis after treatment.[11] Further study with a larger number of patients is required.
Footnotes
Available FREE in open access from: http://www.clinicalimagingscience.org/text.asp?2013/3/2/12/124057
Source of Support: Nil
Conflict of Interest: None declared.
REFERENCES
- 1.Goel S, Ahmed J, Singh MP, Nahar P. Oral submucous fibrosis: A clinico-histopathological comparative study in population of Southern Rajasthan. Online J Carcinog Mutagen. 2010;1:1–4. [Google Scholar]
- 2.Shivakumar GC, Sahana S. Clinical staging of oral submucous fibrosis: A review. Int J Oral Med Sci. 2011;10:216–9. [Google Scholar]
- 3.Lee CK, Tsai MT, Lee HC, Chen HM, Chiang CP, Wang YM, et al. Diagnosis of oral submucous fibrosis with optical coherence tomography. J Biomed Opt. 2009;14:054008. doi: 10.1117/1.3233653. [DOI] [PubMed] [Google Scholar]
- 4.Raina C, Raizada RM, Chaturvedi VN, Harinath BC, Puttewar MP, Kennedy AK. Clinical profile and serum beta-carotene levels in oral submucous fibrosis. Indian J Otolaryngol Head Neck Surg. 2005;57:191–5. doi: 10.1007/BF03008011. [DOI] [PMC free article] [PubMed] [Google Scholar]
- 5.Dyavanagoudar SN. Oral submucous fibrosis: Review of etiopathogenesis. J Cancer Sci Ther. 2009;1:72–7. [Google Scholar]
- 6.Kamala KA, Annigeri RG, Ashok L. Ultrasonic diagnosis of masseter hypertrophy in oral submucous fibrosis: A preliminary study. J Indian Acad Oral Med Radiol. 2010;22:197–200. [Google Scholar]
- 7.Rangaiah P, Annigeri RG, Lingappa A. Transcutaneous ultrasonographic assessment of oral submucous fibrosis: A preliminary study. Int J Oral Med Sci. 2010;9:137–47. [Google Scholar]
- 8.Khanna JN, Andrade NN. Oral submucous fibrosis: A new concept in surgical management. Report of 100 cases. Int J Oral Maxillofac Surg. 1995;24:433–9. doi: 10.1016/s0901-5027(05)80473-4. [DOI] [PubMed] [Google Scholar]
- 9.Paissat DK. Oral submucous fibrosis. Int J Oral Surg. 1981;10:307–12. doi: 10.1016/s0300-9785(81)80026-9. [DOI] [PubMed] [Google Scholar]
- 10.Ranganathan K, Devi MU, Joshua E, Kirankumar K, Saraswathi TR. Oral submucous fibrosis: A case-control study in Chennai, South India. J Oral Pathol Med. 2004;33:274–7. doi: 10.1111/j.0904-2512.2004.00116.x. [DOI] [PubMed] [Google Scholar]
- 11.Manjunath K, Rajaram PC, Saraswathi TR, Sivapathasundharam B, Sabarinath B, Koteeswaran D, et al. Evaluation of oral submucous fibrosis using ultrasonographic technique: A new diagnostic tool. Indian J Dent Res. 2011;22:530–6. doi: 10.4103/0970-9290.90287. [DOI] [PubMed] [Google Scholar]
- 12.Ariji E, Ariji Y, Yoshiura K, Kimura S, Horinouchi Y, Kanda S. Ultrasonographic evaluation of inflammatory changes in the masseter muscle. Oral Surg Oral Med Oral Pathol. 1994;78:797–801. doi: 10.1016/0030-4220(94)90098-1. [DOI] [PubMed] [Google Scholar]


