

Abstract
The optimization of a purely negative depletion, enrichment process for circulating tumor cells, CTC's, in the peripheral blood of Head and Neck cancer patients is presented. The enrichment process uses a red cell lysis step followed by immunomagnetic labeling, and subsequent depletion, of CD45 positive cells. A number of relevant variables are quantified, or attempted to be quantified, which control the performance of the enrichment process. Six different immunomagnetic labeling combinations were evaluated as well as the significant difference in performance with respect to the blood source: buffy coats purchased from the Red Cross, fresh, peripheral blood from normal donors, and fresh peripheral blood from human cancer patients. After optimization, the process is able to reduce the number of normal blood cells in a cancer patient's blood from 4.05 × 10⁹ to 8.04 × 10³ cells/ml and still recover, on average, 2.32 CTC per ml of blood. For all of the cancer patient blood samples tested in which CTC were detected (20 out of 26 patients) the average recovery of CTCs was 21.7 per ml of blood, with a range of 282 to 0.53 CTC per ml of blood. Unlike a majority of other published studies, this study focused on quantifying as many factors as possible to facilitate both the optimization of the process as well as provide information for future performance comparisons. The authors are not aware any other reported study which has achieved the performance reported here (a 5.76 log10) in a purely negative enrichment mode of operation. Such a mode of operation of an enrichment process provides significant flexibility in that it has no bias with respect to what attributes define a CTC; thereby allowing the researcher or clinician to use any maker they choose to define whether the final, enrich product contains CTC's or other cell type relevant to the specific question (i.e. does the CTC have predominately epithelia or mesenchymal characteristics?).
Keywords: Circulating tumor cells, Immunomagnetic cell separation, Immunocytochemistry, RT-PCR, Squamous cell carcinoma of the head and neck (HNSCC)
Introduction
The genesis of overt metastases in a number of different types of cancer is based on the concept that a tumor cell, or a tumor microemboli, dissociate from the primary tumor, circulates through the body either in blood vessels or lymphatic channels, coming to reside at a site in which metastatic tumors develop. Thus, detection of such cells, commonly referred to as circulating tumor cells, CTC's, in peripheral blood of cancer patients is an appealing strategy to provide further information for fundamental understanding as well as for potential prognosis and treatment (Paterlini-Brechot and Benali, 2007; Pantel and Brakenhoff 2004). Genome and transcriptome analyses of single disseminated tumor cells, DTC, (tumor cells found in distant organs relative to the primary tumor) demonstrated that the majority of DTCs are cells with genetic aberrations compatible with malignancy and therefore most likely are direct descendants of the primary tumor, although the genetic changes generally were incongruent with the dominant genotype of the corresponding primary tumor (Schmidt-Kittler et al. 2003; Klein et al. 2002a; Klein et al. 2002b; Klein et al. 1999).
Detecting the presence of tumor cells outside the primary tumor and circulating in the blood or in organs such as bone marrow, would serve at least three purposes that could be clinically useful: 1) as unambiguous evidence for an early occult spread of tumor cells; 2) as a relevant risk factor for subsequent metastasis and, thus, a poor prognosis; and 3) as a marker for monitoring treatment susceptibility. Finally, genotyping and phenotyping of CTC's should provide detailed insight into the metastatic process and permit direct exploration of targeted treatment strategies (Pantel and Brakenhoff, 2004).
Currently, three types of detection/isolation methods are commonly used to detect cancer cells in peripheral or bone marrow samples; (1) Immunocytochemistry, ICC, (2) flow cytometry and/or image cytometry, FCM, and (3) Reverse transcriptase -polymerase chain reaction, (RTPCR). In immunocytochemistry, tumor cells are visually identified by their morphology and by ligand-specific monoclonal antibodies conjugated with fluorescent, or brightfield, dyes. Surface markers as well as intracellular markers can be used as a target antigens. The advantage of immunocytochemical approach is tumor cells are actually observed under a microscope; however, a disadvantage is that it is challenging to find tumor cells among non-tumor cells at a frequency of 1/105 and lower (Braun and Pantel, 2001).
In flow cytometry, tumor cells are identified by size, granularity and fluorescent signals emitted by fluorescently labeled antibodies targeting specific cell surface markers. Several commercially available reagents are available that target surface antigens common to many CTC (which are commonly from epithelial origin), and through specific fixation procedures intracellular markers such as cytokeratins can also be stained (Chosy et al. 2003; Green et al. 2000; Brandt et al. 2001; Paterlini-Brechot and Benali 2007). While flow cytometry analysis can provide multi-dimensional information (multiple cellular attributes can be detected per cell), it is a time consuming technique once the number of cells to be analyzed becomes greater than 106 cells. In addition, unless the cells are sorted after identification, the cell is discarded. An alternative to fluorescent sorting is to pre-sort the cells using magnetic enrichment technology and then analyze the cells with a flow cytometer (Racila, et al. 1998).
Numerous studies have shown that tumor cells can be detected using RT-PCR technology targeting specific mRNA characteristic of cancer cells such as: Cytokeratin 8, 19, carcinoembryonic antigen (CEA), epidermal growth factor receptor, EGFR, and for melanoma markers such as tyrosinase, MUC18, glycoprotein gp100/pmel17, and MART1/Melan-A (Paterlini-Brechot and Benali, 2007; Mocellin et al. 2006). Sensitivity of this RT-PCR method can be high, especially when the nested PCR technique is used. However, the results in general are more qualitative than quantitative, and poor specificity is commonly reported (Ko et al. 2000). A possible explanation for the variation in performance is that the expression of the so-called tumor-specific genes in a normal cell is not zero but near zero. Therefore, a large number of normal cells expressing, at a low level, this tumor specific marker, could make a sample appear containing a tumor cell (i.e. create a false positive condition). This phenomenon has been called the illegitimate expression of a gene and has been previously described for CK19 (Ko et al. 2000).
In an attempt to begin to quantify the sensitivity of RT-PCR for CTC markers in human blood, Tong et al. (2007) quantified the number of cells and the amount of mRNA for EGFR needed for a positive detection using RE-PCR in normal, human peripheral blood spiked with Head and Neck Squacous Cell Carcinoma cells for three different cell lines. It was previously reported by Zen et al. (2003) that EGFR is a potential maker for CTC of human, oral squamous cell carcinoma. As might be expected, the amount of mRNA for EGFR expressed by the three different lines varied, significantly. Consequently, to positively identify mRNA for EGFR in a spiked blood sample, the final concentration of a cancer cell in blood at the time of cell lysis ranged from 1 cancer cell in 1,000 to 1 cancer cell in 100,000 nucleated blood cells. In addition to the variability in the purity needed for a positive signal, the absolute number of cancer cells needed in the sample for a positive identification ranged from 1 to 30, which also reflects the amount of mRNA for EGFR expressed by the three different cell lines.
The previous paragraphs outline the proverbial finding a “needle in a haystack” challenge of finding CTC in the peripheral blood of cancer patients. To put this challenge in a quantitative perspective, Table 1 lists the number of erythrocytes, leukocytes, and platelets per ml of normal adult blood. To further emphasize the challenge, instead of presenting these numbers in exponential form, the numbers of cells are listed in “long hand” form. While in adults, erythrocytes do not contain nuclei, and corresponding, do not contain mRNA, given the fact that they constitute approximately thirty to forty percent of the blood volume, the complete removal, without any loss of other cell types, is needed for accurate CTC detection.
Table 1.
Typical composition of human blood (McKenzie 1996)
| Type of cell | Average number of cells/per ml of fresh blood |
|---|---|
| Erythrocyte (RBC) | 5,000,000,000 (range from 4.4 to 5.9 × 10⁹) |
| Leukocytes (WBC) | 7,000,000 (range from 3.9 to 10.6 × 10⁶) |
| Platelet | 295,000,000 (range from 150 to 440 × 106) |
| Total | 5,302,000,000 |
| Reported CTC's | ?? (range from ~0.2 to >1000) |
| Leukocytes compositions | |
| Lymphocytes | 2,400,000 (range of 1.2 to 3.5 × 10⁶) |
| Monocytes | 300,000 (range of 0 to 0.5 × 10⁶) |
| Granulocytes | 4,000,000 (range of 1.4 to 6.6 × 10⁶) |
Obviously, to make CTC detection and analysis a routine, clinical diagnostic procedure, a simple, inexpensive, robust, and “idiot proof” technology needs to be developed which can greatly enrich the CTC's from blood. Ideally, one would like to use a methodology which could removal all of the “normal cells” only leaving the CTC. Such a methodology would require approximate 7 to 8 log10 enrichment.
A number of non-optimum enrichment methodologies currently exist to isolate and or enrich for blood cells, and these methodologies can be categorized as positive selection of the targeted cell, or depletion of normal, non-targeted cells (negative depletion). While positive selection for the CTC is an appealing strategy, and is used in a number of CTC detection processes, including a commercial system (i.e. CellSearch system; Riethdorf et al. 2007), a positive selection creates a significant bias in that one needs to assume the cell surface marker to be targeted prior to the separation process. Many, but not all (i.e Breast and Squamous cell carcinoma), cancer cells develop from epithelial cells; hence epithelial cell markers (i.e EpCAM, cytokeratins) are routinely used to separate and identify the CTC's. However, recent evidence suggests that invasive tumor cells lose their epithelial antigens in a process referred to as the epithelial to mesenchymal transition (EMT) process (Christiansen et al. 2006). Consequently, a positive selection for epithelial cells could miss, potentially, the most important CTC with respect to metastatic disease. In addition, experimental evidence exists for the down regulation of cytokeratin proteins typically used for CTC identification in breast cancer cell lines with a concurrent up regulation of mesenchymal markers/antigens (Kokkinos et al. 2007; Berx et al. 2007). Therefore, a completely negative cell depletion process in which only normal blood cells are targeted for removal is the most optimum enrichment process. Ideally, after the enrichment process, all that would be left are “abnormal” cells which can be further analyzed. This approach would allow the investigator to decide which markers are the most appropriate for analysis.
In this study, we will report on our work to optimize, on actual cancer patient's peripheral blood, a completely negative cell depletion methodology with the goal to reach as pure a final sample of non-targeted CTC as possible. We have used the approach of Lara et al (2004) and Tong et al (2007) to enrich for CTCs in head and neck cancer patients undergoing surgery. While we are, obviously, ultimately interested in both analysis of these CTC in actual cancer patients, and the potential correlation to patient condition and prognosis, the focus on this paper is not clinical, but on the characterization and optimization of the enrichment process. Unfortunately, a majority of the other studies published using various enrichment processes/methodologies have not focused on the optimization of the process, nor provided complete data of the performance. As will be demonstrated below, the enrichment process is a strong function of the source of the human blood and the type of reagents used.
Materials and methods
Blood collection
Blood samples were obtained from three sources: 1) buffy coats purchased from the American Red Cross, Columbus Ohio office, 2) from healthy donors, or 3) patients who presented with SCCHN and are undergoing surgery (OSU IRB 2004C0096). Operators were blinded to clinical correlative information during the cell suspension processing and analysis. From 10 to 18.5 ml peripheral blood was taken from each SCCHN patient, who was undergoing surgical resection for squamous cell carcinoma of the oral cavity, oropharynx, hypopharynx or larynx and that have not been previously treated for this disease. Fresh blood was collected into green-top BD Vacutainer ® blood collection tubes containing sodium heparin (Cat# 367874, BD). Blood from healthy donors was also collected into green-top BD Vacutainer ® blood collection tubes containing sodium heparin (Cat# 367874, BD).
Overall enrichment process
Figure 1 presents a diagram of the overall process. Depending on the source of the blood, the initial processing steps were slightly different, and as will be presented below, significant variations in system performance was obtained based on the blood source and the immunomagnetic reagents used.
Figure 1.
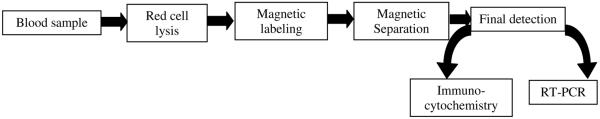
Flow diagram of current process to enrich for rare cancer cells in human blood.
Cancer patient's blood or healthy donor blood
Blood samples were either processed immediately, or stored at 4 °C overnight and processed early the next day. If more than one Vacutainer tube was used for collection, the blood samples were pooled and subjected to a red cell lysis step. Blood samples from buffy coats were first subjected to a Ficol separation and then spiked with the appropriate number of cancer cells from cell cultures.
Cell concentration determination
To determine the concentration of PBLs in the samples before red cell lysis, after red cell lysis, and after magnetic cell separation, an aliquot of the sample was diluted in 3% Acetic acid (1:25, 1:25, 1:10 dilutions respectively) in a 1.5 ml Eppendorf tube and left to stand for 10 min at room temperature to lyse all the red blood cells. After 10 min incubation, the sample was vortexed carefully to prevent introduction of bubbles. Care was taken to mix the sample well before sampling as the distribution of the cells in the chamber depends upon the particle number and not particle mass. Cell concentration was determined using an Improved Neubauer Hemocytometer. With the cover slip in place, a drop (10–20 μl) of the well-mixed sample was placed in the notch and the sample was left to fill the chamber by capillary action. The chamber was then left undisturbed for 1–2min to allow the cells to deposit on the counting plane. The number of PBLs was next determined and the concentration reported. Similarly, to determine the total blood count in the sample, 5 μl of vortexed blood was diluted 2000 times in labeling buffer and the cell concentration determined as mentioned above.
Red cell lysis step
For the blood samples from cancer patients and healthy donors, red blood cells were removed by applying a lysis buffer (154 mM NH4Cl, 10 mM KHCO3, 0.1 mM EDTA), at a ratio of 25 ml lysis buffer to 1 ml of blood and incubating at room temperature for 5min. After 5 min centrifugation at 300 xg, the cell pellet was washed and then resuspended in labeling buffer (PBS supplemented with 2 mM EDTA and 0.5% Bovine serum Albumin). Concentration of nucleated cells was determined by hemacytometer using the Unopette® Microcollection system (Cat# 365856, BD Biosciences). This cell suspension consisting of predominately nucleated cells was then ready for magnetic labeling.
Evaluation of separation performance
The extent of cell enrichment was determined using the following relationship:
| (1) |
where NInitial is the initial number of total cells prior to separation (or procedure in the case of the RBC lysis), FT,Initial is the initial fraction of cells that are the specific cell type, NFinal is the final number of cells in the depleted cell suspension, and FT, Final is the fraction of cells that are the specific cell type.
Immonofluorescence studies and Immunomagnetic labeling
Flow cytometry analysis was performed using a BD FACS Calibur operated using standard operating protocols. Three antibody-fluorescent label conjugates were used: anti-CD45-PE (Immunotech-Marseille, France, PN IM2078), anti-CD33-FITC (Immunotech –Marseille, France, PN IM 1135), and anti-CD13-FITC (Immunotech–Marseille, France, PN IM 0778). Six different immunomagnetic labeling protocols were evaluated. Figure 2 presents a diagram of the six protocols and Table 2 provides specific information of the reagents used. For all six immunomagnetic labeling protocols, the primary antibody targeted the CD45 cell surface antigen. FcR blocking reagent (Cat# 130–045–801, Miltenyi, Biotec, Auburn, CA) was employed in all methods prior to primary antibody labeling to block potential unwanted non-specific binding.
Figure 2.

Six immunomagnetic labeling protocols used in this study. Specifics of protocols A through F are listed in Table 2.
Table 2.
Reagents for the 6 types of immunomagnetic labeling protocols used in this study.
| Labeling protocol | 1st Antibody | Company Catalog # | 2nd Antibody/Reagent | Company catalog # | Magnetic particle size | Mobility |
|---|---|---|---|---|---|---|
| A | Anti-CD45-MAC | Miltenyi Biotec 130-045-801 | 67–120 nm (Zhang et al. 2005) | 2–3 × 10⁻⁴ mm3/T-A-s (Tong et al. 2007) | ||
| B | Anti-CD45-PE | Immunotech IM2078 | Anti-PE-MACS | Miltenyi Biotec 130-045-801 | 2–3 × 10⁻⁴ mm3/T-A-s (Tong et al. 2007) | |
| C | Anti-CD45-PE | Immunotech IM2078 | Anti-PE-MACS | Miltenyi Biotec 130-045-801 | 67–120 nm (Zhang et al. 2005) | 4 ~ 8 × 10⁻⁴ mm3/T-A-s (Lara et al. 2006) |
| Anti-PE-DM | BD Imag | 230 nm (Zhang et al. 2005) | ||||
| D | Anti-CD45 Dynal bead | Invitrogen Dynal 111.53 | 4,500 nm (Zhang et al. 2005) | ~ 1 × 10⁻¹ mm3/T-A-s (Zhang et al. 2006) | ||
| E | Anti-CD45 TAC | Stemcell Technologies #18259 | StemCell nano-particle | Stemcell Technologies #18259 | 200 nm | ~ 2 × 10⁻⁴ mm3/T-A-s |
| F | Anti-CD45 TAC | Stemcell Technologies #18259 | StemCell micro-particle | Stemcell Technologies #19250 | 1 micron | ~ 3 × 10⁻² mm3/T-A-s |
Protocols A and B were previously described by Tong et al. (2007) which had been optimized for use on human blood from buffy coats and spiked with cancer cell lines. Protocol C was developed and tested for this study and is an extension of protocol B and similar to a protocol developed to depleted T-cells (Lara et al. 2006). CD45-PE (Cat# IM 2078, Beckman Coulter, France) was used as a primary antibody while anti-PE DM particle (Cat# 557899, BD Biosciences) and anti-PE MACS microbeads (Cat# 130–048–801, Miltenyi, Biotec, Auburn, CA) were added sequentially as secondary antibodies. The anti-PE DM particles were concentrated (2:1) prior to magnetic labeling by placing a tube on a magnet for 15min and removing half volume of the solution (e.g. 200ul of original solution was concentrated to 100ul). For labeling protocol D, 1 × 10⁸ cells were resuspended in 100ul of labeling buffer, 50ul of FcR and 350ul of CD45-PE antibody in a 15ml falcon tube. The mixture was incubated at 4 °C in the dark for 15 min followed by a wash step as described above. The cell pellet was then resuspended in 100ul of labeling buffer, 200ul of pre-enriched anti-PE DM particles and incubated at 4°C in dark for 15 min. Finally, 200ul of anti-PE MACS beads were added and another15 min incubation at 4 °C was conducted. After washing and centrifugation, cells were resuspended in the appropriate volume of labeling buffer and were subsequently ready for separation.
Labeling Protocol D was a single step process which uses anti-CD45 antibodies conjugated to 4.5 micron beads while Protocols E and F used completely different reagents which follow a different methodology. Specifically, for these two protocols, a tetrameric antibody complex (TAC) structure was used consisting of bifunctional antibodies (Lansdorp, 1986) purchased from StemCell Technologies (Vancouver, BC). The TAC complex used for Protocols E and F target both CD45 and dextran coated, nano or micro, magnetic particles. The diagrams in Figure 2 presents this bifunctional characteristic. The cell sample was prepared as with the other protocols, including the addition of FcR blocking reagent, to which 0.5ul of the TAC complex was added per million cells and the cell suspension was incubated for 30 min at room temperature in a shaker. Without washing the cell suspension, 1 ul of the magnetic nano (Protocol E) or micro (Protocol F) particle suspension per million cells was then added and incubated for15 min at room temperature. The cells are then washed with labeling buffer, centrifuged and resuspended in labeling buffer.
Magnetic cell separation step
While the design and operation of the quadrapole magnetic cell separation system, QMS, has been described previously (Tong et al., 2007), the continued development of a purely negative cell depletion mode of operation, in contrast to the continuous, flow through mode of operation that the QMS was designed for (Sun et al. 1998), resulted in a new design used in this study. This simplified design included the use of a flow channel with a single input and output (no sheath fluid) and a single syringe pump on the exit flow line (Figure 3).
Figure 3.

Diagram of the immunomagnetic cell separation system used in this study.
Flow cytometry
Flow analysis was conducted on a FACS Aria (BD Biosciences, San Jose CA, USA). Cells suspensions, for selected runs, pre and post magnetic cell separation, were stained with anti-CD45-PE (BD Biosciences). The antibody binding capacity, ABC, of the various subpopulations of nucleated cells was determined using QuantiBRITE PE calibration beads (BD Biosciences, Cat # 340495) flowing the manufactures protocol and as reported by Zhang et al. (2006).
Magnetophoretic mobility measurements
The magnetophoretic mobility of immunomagnetically labeled cells was determined for the cells labeled with Protocols E and F following the technique described by Tong et al. (2007).
Staining of tumor cells
The enriched cell suspension after the magnetic separation step was split into two aliquots: one for immunocytochemistry, ICC, the second for RT-PCR (Figure 1). Specific details of the ICC protocol were presented by Tong et al. (2007); summarizing, it is assumed epithelial derived CTC's will bind anti-cytokeratin FITC antibody CK3-6H5 (Cat# 130-080-101, Miltenyi Biotec, Auburn, CA) and cell nuclei will bind the stain DAPI (Cat# H-1200, Vector Laboratory, Burlingame, CA). Following a similar criteria as that described by Partridge et al (2003) and Riethdorf et al. (2007) to identify a cancer cell, the cell must be: 1) double positive for FITC and DAPI staining; 2) the cell must have an intact membrane, and 3) the cell must have a high nuclear:cytoplasmic ratio and be as large, or larger when compared to surround PBL's; 4) the cell must be PE negative in those cases that CD45-PE are used initially to label the WBCs (immunomagnetic labeling Protocols B and C).
RT-PCR assay
As with the ICC, the methodology used for the RT-PCR assay for EGFR mRNA detection was presented by Tong et al. (2007). For every set of RT-PCR experiments, a positive control (a sample with RNA extracted from a head and neck cancer cell line D-562) and a negative control (a sample without RNA) were included. Additionally, PCR of a house-keeping gene, HPRT, was performed as a control to confirm the integrity of RNA and efficiency of RT-PCR. The primers used were: GTAATGACCAGTCAACAGGGGAC and TGGTCAAGGTCGCAAGCTTGCTTG generating a 177bp product. PCR products were analyzed by 1.5% agarose gel electrophoresis.
Cell culture
A head and neck cancer cell line, Detroit-562 was purchased from ATCC (Manassas, VA) and was maintained in Earle's Minimum essential medium (ATCC, Manassas, VA) supplemented with 10% fetal bovine serum (FBS; JRH Biosciences, Lenexa, KS). Cells were harvested using Accutase™ (Innovative Cell Technologies, Carlsbad, CA) as per manufacturer's instruction.
Results
Summary of the performance of four of the labeling protocols on Cancer patient blood
Table 3 presents the results of 26 enrichments of peripheral blood taken from Head and Neck Cancer patients while undergoing surgery. While between 10 and 18 mls of blood were obtain from each patient, to facilitate analysis the averages presented in Table 3 were normalized to 1 ml of fresh blood. Figure 4 presents a photographic representations of the protocol to determine if a cell in the final, enriched sample can be considered a CTC: 4A is a brightfield photo of a region of the cytospin slide, 4B is a photo of a filtered for FITC fluorescence, image of the same region, 4C is a photo of the same image filtered for DAPI fluorescence, and 4D is the superposition of images 4B and 4C. To be considered a CTC, the cell must be positive for FITC and DAPI. Figure 4E is a photo of two gels of the RT-PCR product, the first lane is an example of a positive presence of EGFR from one of the cancer patients blood (this patient had visible CTC's in their blood), the second lane an example of a negative presence of EDFR (the patient did not have any visible CTC in their blood) and the third lane is of a molecular weight control. Table 4 lists the average number of CTC detected per ml of fresh, patient blood as a function of the immunomagnetic protocol used. Also presented is the range of concentrations of CTC detected, per individual blood sample, for each protocol. Overall the concentration of CTC's detected ranged from 0.5 to 282 per ml of fresh blood and of the these 26 cancer patient samples enriched, 21 samples contained cells that qualified as being positive for CTC (visual staining and positive EGFR bands). As noted in the comments category of Table 4, one patient sample analyzed using Protocol A had a final CTC concentration of 282 per ml of blood. This value was significantly higher than any other sample, and if it is removed, the number of CTC detected per ml of blood, was reasonably similar between protocols, given the uncertainty of CTC concentration in patient blood. Also, given the relatively small numbers of samples per type of protocol, the great, potential variability in the initial number of CTC's the patient's blood, care should be taken in not placing to much significance in differences in the numbers of CTCs recovered per ml of blood between each of the different protocols.
Table 3.
Average, and standard deviation, for samples taken from HNSCC patients undergoing surgery
| Average number of cells/per ml of fresh blood | Standard Deviation | n | Log10 Enrichment per stage | Stage of separation | |
|---|---|---|---|---|---|
| 4,050,000,000 | 4.05 × 10⁹ | 1,110,000,000 | 26 | - | Fresh sample (RBC and WBC) |
| 10,400,000 | 1.04 × 10⁷ | 5,040,000 | 26 | - | Nucleated cells in fresh sample |
| 6,930,000 | 6.93 × 10⁶ | 4,200,000 | 26 | 2.59 | Nucleated cells after RBC lysis |
| 459,000 | 4.59 × 10⁵ | 402,000 | 11 | 1.27 | After magnetic separation, protocol A. Number of nucleated cells |
| 1,640,000 | 1.64 × 10⁶ | 2 | 0.96 | After magnetic separation, protocol B. Number of nucleated cells | |
| 174,000 | 1.74 × 10⁶ | 94,600 | 6 | 1.64 | After magnetic separation, protocol C. Number of nucleated cells. |
| 8,040 | 8.04 × 10³ | 6,970 | 9 | 3.07 | After magnetic separation, protocol E. Number of nucleated cells. |
Figure 4.

Photographs of microscopic images of a cytospin of one of the enriched peripheral blood samples from cancer patients. Figure 4A is a brightfield image, 4B is an image filtered for FTIC staining, 4C is a image filtered for DAPI staining, and 4D is an electronic superposition of images 4B and 4C. Original magnification ×200. 4E is a photo of two gels of RT-PCR product, the first lane is an example of positive presence of EGFR, the second lane an example of a negative presence of EDFR, and the third lane is molecular weight control.
Table 4.
Number of detected CTC's per ml of fresh blood for each of the four immunomagnetic labeling protocols.
| Separation Protocol | Average number of CTC's per ml of fresh blood | Range of concentration of CTC detected in fresh blood | Comments | |
|---|---|---|---|---|
| A | 47.9 (n=7) | 8.33 (n=6) | 1.1 to 282 | The first number, 47.9, is the average number of CTC, per ml of fresh blood, detected. Only 7 of the 11 samples contained CTC and were positive for EGFR; hence average based on 7. The second number, 8.33, is based on the average for six samples; the sample containing 282 CTC per ml of blood was removed from average since it is an outlier |
| B | 10 (n=1) | 10 | Only one data point; other sample was negative for EGFR and CTC | |
| C | 10.9 (n=7) | 3.5 to 29.6 | Average based on seven, positive samples | |
| E | 2.32 (n=5) | 0.53 to 3.22 | Average based on 5 samples. | |
| All | 21.7 | 7.7 | 0.53 to 282 | |
All 26 samples were subjected to the same RBC lysis step which produced an average 2.56 log10 enrichment as recorded in Table 3. However, by comparing the concentration of nucleated cells before and after the lysis step, one observes that, on average, 33 percent of the nucleated cells were lost in this lysis step. While this performance is comparable to performance of RBC lysis procedure performed on fresh, peripheral blood spiked with cancer cells (Lara et al. 2004), the loss of 33 percent of nucleated cells is still significantly higher than desired.
The performance of the immunomagnetic cell separation step in this study using Protocol A was significantly lower, as measured in terms of a log10 enrichment of only 1.27, than that reported by Lara et al. (2004) and Tong et al. (2007), 2.38 and 1.64, respectively. Note, protocol A is the protocol that Tong et al. 2007 used, and similar to the one used by Lara et al. 2004. Since CD45 is considered a pan-leukocyte cell surface marker, and an anti-CD45 antibody magnetic nanoparticle conjugate (anti-CD45-MACS) was used, a fundamental question is: Why, on average, were 450,000 nucleated cells per ml of blood were not removed in the magnetic labeling step?
Analysis of enriched samples following labeling Protocol A
To address this question, FACS analysis was performed on 4 of the 11 patient samples in which protocol A was used to immunomagnetically label the cells. Prior to magnetic cell separation, a small aliquot of the immunomagnetically labeled cell suspension was further labeled with anti-CD45-PE conjugate antibodies (note, previous studies indicated that cells can be simultaneously labeled with anti-CD45-MACS and anti-CD45-PE antibody conjugates). Figure 5A is a histogram of the PE fluorescence of all of the events of the flow analysis of one of the cancer patient's blood sample prior to being magnetically separated following labeling Protocol A. Three distinct cell populations can be observed, and these were gated M1, M2, and M3, corresponding to low, moderate, and high levels of antibody binding capacity, ABC, for the CD45 antigen. Using QuantiBRITE calibration beads, the mean ABC for each gated region was: 70, 34,000, and 120,000, respectively. Using this gating, the forward and side scatter plots of the same cell sample, 5C, were color coded for expression level: green for low CD45 expressing cells, blue for medium CD45 expressing cells, and magenta for high CD45 expressing cells. Based on the traditional analysis of side and forward scatter plots of human blood, the location of the color coded clusters indicates that the lymphocytes and monocytes have a high ABC for CD45, while the granulocytes have a moderate ABC for CD45. Figure 5B and 5D are histograms, and dot plots, of a cell sample after immunomagnetic cell separation using Protocol A. Clearly, a high level of depletion of the M3 events (compare 5C with 5D) occurred, which corresponds to lymphocytes and monocytes, while a relatively lower level of granulocyte depletion was obtained.
Figure 5.

Flow cytometry analysis of one of the cancer patient blood samples, labeled with Protocol A, prior to (5A, 5C), and after (5B and 5D), immunomagnetic cell separation. 5A and 5B are histograms of PE expression of cells labeled with an anti-CD45-PE, and 5C and 5D are dot plots of forward scatter of the cell sample prior to and after separation. Based on the three gated regions, M1, M2, and M3, in 5A and 5B, the “dots” in 5C and 5D are color coded corresponding to M1 (green), M2 (blue), and M3 (magenta).
Further analysis of this granulocyte population was conducted by labeling the cells with anti-CD13 and anti-CD33, two markers commonly associated with granulocytes. Figures 6A through 6D are dot plots of CD45-PE intensity (y-axis) verses CD13-FITC (x-axis) (6A and 6B) or CD33-FITC (6C and 6D). Comparisons of 6A with 6B, and 6C and 6D, clearly show the removal of the high intensity PE events (cells with high ABC for CD45), consistent with the previous analysis discussed above. It is clear from Figure 6D that a large number of the events (cells) after an immunomagnetically separation are positive for both CD45 and CD33, indicating that they are granulocytes, and it is also clear that that a significant number are CD45 positive and CD33 negative. At this point, we do not know to what subcategory of WBC these CD45+, CD33−, these cells belong.
Figure 6.

Flow cytometry analysis of one of the cancer patient blood samples, labeled with Protocol A, prior to (6A, 6C), and after (6B and 6D), immunomagnetic cell separation. In this example, two different sets of immunomagnetic labeling was conducted: 6A and 6B presents cells labeled with anti-CD45-PE and anti-CD13-FITC, and 6C and 6D presents cells labeled with anti-CD45-PE and anti-CD33-FITC.
Based on the forward and side scatter flow analysis of the prior and post magnetic cell separation step, the change in total number (not concentration) of granulocytes, lymphocytes, and monocytes is presented for eight peripheral blood samples from cancer patients in Figure 7. In this Figure, the total number of cells, in a logarithmic format is presented on the y-axis, and the reduction in each of the three cell types as a result of the magnetic cells separation step, for each of the eight samples, is presented as a bar. This method of presentation clearly shows that while there is a decrease in each of the cell types, the highest total number of cells, and the corresponding smallest decrease in subtype, was the granulocytes.
Figure 7.

A bar graph representing the immunomagnetic depletion of the three general categories of WBC, granulocytes, lymphocytes, and monocytes, for eight different cancer patients blood samples. Labeling protocol A was used for all eight depletions.
The above analysis results in the following question: Why are the granulocytes not being removed at a higher rate? Clearly, the granulocytes are positive for CD45, based on the anti-CD45-PE labeling, and subsequent flow analysis. Also, previous publications have reported that an ABC of 34,000 (the mean ABC of the granulocytes after magnetic separation), bound with anti-CD45-MACS reagents, is more than sufficient to make a cell magnetic enough to be separated. (McCloskey et al. 2003; Zhang et al. 2006; Tong et al. 2007).
Given the above analysis, one speculation for the lack of a high level of depletion of the granulocytes is that the antibody magnetic conjugates used in protocol “A” have a significantly lower binding affinity to the CD45 antigen on granulocytes relative to lymphocytes. Since we wish to maximize the immunomagnetic labeling of the CD45 expressing cells, other immunomagnetic labeling protocols were developed and tested. Protocol “B” consisted of labeling the cell population using a two-step protocol: a primary antibody using the same anti-CD45-PE conjugate used to analyze the cells (since we know it labels the cells well based on positive flow analysis, i.e. Figure 5) and a secondary antibody which targets the bound PE molecules (an anti-PE-MACS conjugate). Note, historically, good success was obtained using this type of 2-step labeling protocol with both anti-PE-MACS and anti-PE-DM nanoparticles (Tong et al. 2007; Lara et al. 2006). Protocol “C” consisted of using the same primary and secondary antibody in Protocol “B”, with the addition of a second, secondary antibody, anti-PE DM magnetic particle conjugates from BD. Three other labeling schemes were also tested, completely different than A through C; one used an antiCD45 antibody conjugated to a 4.5 micron, Dynal bead, Protocol D, while protocols E and F used a tetrameric antibody complex, from Stem Cell Technologies with either a magnetic, dextran coated, nano, E, or micro, F, particle.
As Table 3 indicates, Protocol “B” resulted in a decrease in performance after two runs on cancer patient blood; this Protocol was subsequently discontinued. Protocol “C” resulted in a moderate improvement of performance, but not sufficient to warrant further runs beyond the 6 samples tested. However, a dramatic increase in depletion performance was obtained using protocol E, an average log10 enrichment of 3.07, using the StemCell technologies tetrameric antibody complex with magnetic nanoparticles.
Given the relative scarcity of cancer patient blood, fresh blood from healthy donors and buffy coats were also used to test the six different protocols listed in Table 2. Using these three sources of blood, and six enrichment protocols, a total of 61 enrichments were conducted. This data also included the data using Protocol A that were reported in Tong et al. (2007). The scale of these separations ranged from 1 × 10⁷ to 4 × 10⁸ nucleated cells, with a mean of 7 × 10⁷ .
These data from these 61 enrichments were subsequently analyzed using JMP software, which allowed a number of variables, and factors, to be compared. Figure 8A is a graphical output from the JMP software, comparing the log10 enrichment (or depletion of PBL) of nucleated cells using protocol A on human blood from Red Cross buffy coats and fresh, human peripheral blood from Head and Neck Cancer patients. In this graphical presentation, each dot represents a data point, the horizontal line dissecting the diamond is the mean, and the upper and lower apex of the diamond represents a 95 percent confidence interval for the mean. The other two horizontal lines are called the “overlap bars” - if the sample sizes are the same, then two groups are significantly different if there is no overlap of these lines.
Figure 8.

JMP software graphical presentation of immunomagnetic depletions as measured by the log10 depletion of nucleated cells. Figure 8A compares the depletion results of blood from buffy coats and cancer patients, both blood sample immunomagnetically labeled with Protocol A. 8B compares the depletion results (n = 61) of blood from cancer patients, buffy coat, and normal individuals using the six different labeling protocols presented in Figure 2.
Figure 8B is an another graphical output of the JMP software analysis, again listing log10 enrichments (or depletions of PBL) of nucleated cells, this time for all 61 samples (which includes fresh blood samples from healthy donors as well as cancer patients) grouped into one of the six different labeling protocols listed in Figure 2.
Clearly, labeling Protocols E and F produce significantly superior performance no matter what the source of blood. Somewhat surprising is the poor performance of labeling protocol D, which used a one step anti-CD45-Dynal magnetic microbead conjugate. A puzzling observation is that in contrast to the poor performance in this study, we have demonstrated a 4 log10 depletion of T-cells from human buffy coat using the same type of conjugate, with an antibody targeting CD3 instead of CD45 (Tong et al. 2007b). This poor performance of protocol D prevented any studies being conducted with “D” on human cancer patient samples.
Discussion
Ideally, we wish to compare the performance of this study to the performance of other published methodologies to detect CTC's in the blood of cancer patients. However, while a variety of technologies/approaches have been used, typically incomplete information, with respect to this study, is presented which prevents complete comparisons (Mocellin et al. 2006; Paterlini-Benali, 2007). Also, as stated previously, the focus on this study, and presentation, is the optimization and performance of the enrichment process, not the clinical relevance of the data, which is the focus of most, if not all, other publications.
Never the less, we are not aware of any other reported process that can achieve an average, overall log10 enrichment of 5.66 using a completely negative selection methodology (Protocol E) on peripheral blood from cancer patients. While it varies from sample to sample, the final concentration of CTC's in this study (n= 26) was as high as 1 CTC in 542 total cells. Such final, high concentrations not only allow significantly easier visual and immunocytochemical detection, but this high concentration is sufficient to perform further molecular analysis (RT-PCR, microarray, etc) with less background contamination. However, ideally, concentration of 1 in 10 to 1 in 100 is desired.
Beyond the overall level of enrichment, other measures of system performance can be determined, such as recovery and sensitivity. However, accurate quantitative measures of these performance standards are challenging for a number of reasons. First, we do not know the number of CTC in the patient sample initially, and, given the variability of the degree to which cancer has spread in these patients (localized, non detectable metastatic disease to high metastic disease) it is assumed that the number of CTC per ml of blood can range from zero to a high number >200 per ml of blood. Secondly, while spiking studies have been, and continue to be conducted, since the process presented in this manuscript uses a completely negative depletion mode to enrich for the CTC's, the question arises: What is the proper cell type to use for spiking experiments? As discussed previously, there is interest in determining if non-epithelial cells are also CTC's. However, what would be the proper, non- epithelial surrogate cell to use? Finally, as was demonstrated previously (Table 3 and Figure 8A), buffy coat blood performance is not the same as fresh blood from cancer patients. Just because a certain level of performance is obtained in spiked buffy or normal fresh blood, it does not necessarily mean that the same level of performance is obtained with blood from cancer patients. Never-the-less, estimates of recovery can be made. For example, Tong et al. 2007 reported that using Protocol A on buffy coats resulted in an average recovery of 77.8 percent of the spiked cancer cells in the final product. Lara et al. (2004), using a protocol similar to protocol A, reported an average recovery of 46 percent when cancer cells from a cell line were spiked into normal, fresh, peripheral blood. Since Lara et al. (2004) used a RBC lysis step, while Tong did not (Tong used buffy coat) it is possible that the difference in recovery between the study of Tong et al and Lara et al. is the result of the loss of cells in the RBC lysis step. To date, only a few spiking studies using Protocol E and buffy coat have been conducted, in those studies the recovery averaged 60%. Finally, with respect to recovery, it is noted in Table 4 that the average number of CTC per ml of fresh blood using Protocol E was lower than the other Protocols; however, given the relatively low number of samples and that fact that these samples are from actual cancer patients, care should be taken in concluding the recovery is lower using Protocol E than Protocol A.
In terms of accuracy of detection of CTC's in blood, it is suggested that the approach used in this study, namely for a blood sample to be considered to be positive with respect to the presence of CTC's, visual, two color staining (cytokeratin and nuclei) detection of CTC is needed as well as a positive RT-PCR signal EGFR, makes this approach less prone to false positive errors than all other reported studies. Note, the authors are not aware of any other studies which require both a positive RT-PCR assay and visual identification on the same patient sample. The wide range in the number of CTC's per ml of fresh blood, 0.5 to 282, further underscores the sensitivity of this approach, and this range is consistent with ranges reported in the literature using other, positive selection methodologies.
Despite the improved performance using immunomagnetic labeling protocol E, one of the most surprising results of this study, and which is still not addressed, is the significantly different results obtained using labeling Protocol A on buffy coat blood versus actual cancer patient blood (Figure 8A). While the lower enrichment performance of the cancer patient blood, relative to blood from healthy donors, is most likely the result of the high amount of granulocytes in the cancer patient blood; this fact still does not address the question of why the granulocytes can stain positive using an anti-CD45-PE antibody, yet are not magnetically removed when the same antigen is targeted. This is especially puzzling given the lack of significant improvement when Protocol B and C was used which immunomagnetically targets the already bound anti-CD45-PE antibodies, and this approach worked well targeting CD3 lymphocytes as well as CD45 positive cells from buffy coats (Lara et al. 2006; Tong et al. 2007a).
Therefore, the question remains: Why were the granulocytes not magnetically labeled better? An argument can be made that only the highly expressing granulocytes (with respect to CD45) are being magnetically labeled at a sufficient level to be removed. Visual inspection of Figure 5 can initially support this view: the PE peak in the M2 histogram of the cells post separation is somewhat lower than the PE peak in the M2 histogram of the pre separation analysis. However, given the mean value of ABC of 34,000 for M2 in the pre-separation analysis, this decrease in peak intensity in the post-magnetic separation is minor with respect to the ABC of the cells. We have shown that an ABC over 10,000, using MACS reagents, is sufficient to obtain significant magnetic separations (McCloskey et al. 2003b).
Zhang et al. (2006) quantitatively demonstrated that the conjugation of magnetic nanoparticles to antibodies lowered the antigen-antibody affinity relative to the same antibody clone not conjugated to a magnetic particle. One could speculate that the CD45 receptor on granulocytes have a lower affinity than lymphocytes; therefore, an antibody which has a lower binding affinity, such as an antibody-magnetic beads conjugate, would not bind as well. This speculation is further supported by the positive performance of the tetrameric antibody complex from Stem Cell Technologies. In an early publication describing tetrameric antibody complexes, TAC, (Lansdrop et al. 1986), it is suggested that a positive attribute of TAC is “antigen-binding properties of the bivalent monoclonal antibodies are not compromised”. Supporting this claim, Bazin et al. (2004) notes that tetramolecular immune complexes are at least six times more efficient at binding to low affinity FcW receptors than intravenous immunoglobulins. Therefore, one could speculate that the TAC used in this study has a significantly higher affinity for the CD45 marker expressed on granulocytes. Given that Protocols E and F first add the TAC to the cell suspension, incubate the TAC with the cell suspension, and then add the dextran coated nano or micro magnetic beads, if the TAC binding affinity is higher than a anti-CD45-magentic bead complex, this approach would exploit the higher affinity. On going research in our laboratory is focused on following the approach of Zhang et al. (2006) to quantify the affinity of the TAC for both lymphocytes and granulocytes to test this speculation.
Acknowledgements
This work has been supported by the National Science Foundation (BES-9731059 and BES-0124897 to J.J.C.) and the National Cancer Institute (R01 CA62349 to M.Z. and R33 CA81662-01 and R01 CA97391-01A1 to J.J.C.), and the Ohio Department of Development.
Grant support: National Science Foundation (BES-0124897 to J.J.C.) the National Cancer Institute (R01 CA62349 to M.Z., R01 CA97391-01A1 to J.J.C.) and the State of Ohio Third Frontier Program (ODOD 26140000: TECH 07-001).
REFERENCES
- Berx G, Raspe E, Christofori G, Thiery JP, Sleeman JP. Pre-EMTing metastasis ? Recapitulation of morphogenetic processes in cancer. Clin. Exp. Metastasis. 2007;24:587–597. doi: 10.1007/s10585-007-9114-6. [DOI] [PubMed] [Google Scholar]
- Brandt BH, Schmidt H, de Angelis G, Zänker Predictive laboratory diagnostics in oncology utilizing blood-borne cancer cells- current best practice and unmet needs. Cancer Lett. 2001;162:S11–S16. doi: 10.1016/s0304-3835(00)00642-x. [DOI] [PubMed] [Google Scholar]
- Brazin R, Lemieux R, Tremblay T, St-Amour I. Tetramolecular immune complexes are more effectient than IVIg to prevent antibody-dependent in vitro and in vivo phagocytosis of blood cells. British J. of Haematology. 2004;127:90–96. doi: 10.1111/j.1365-2141.2004.05105.x. [DOI] [PubMed] [Google Scholar]
- Braun S, Pantel K. Clinical significance of occult metastatic cells in bone marrow of breast cancer patients. Oncologist. 2001;6(2):125–132. doi: 10.1634/theoncologist.6-2-125. [DOI] [PubMed] [Google Scholar]
- Chosy J, Melnik K, Comella K, Zborowski M, Chalmers JJ. Characterization of Antibody Binding to Three Cancer-Related Antigens Using Flow Cytometry and Cell Tracking Velocimetry. Biotechnol Bioeng. 2003;82:340–351. doi: 10.1002/bit.10581. [DOI] [PubMed] [Google Scholar]
- Christiansen JJ, Rajasekaran AK. Reassessing epithelial to mesenchymal transition as a prerequisite for carcinoma invasion and metastasis. Cancer Res. 2006;66:8319–8326. doi: 10.1158/0008-5472.CAN-06-0410. [DOI] [PubMed] [Google Scholar]
- Fidler IJ, Kripke ML. Metastasis results from preexisting variant cells within a malignant tumor. Science. 1977;197:337–342. doi: 10.1126/science.887927. [DOI] [PubMed] [Google Scholar]
- Green MC, Murray JL, Hortobagyi GN. Monoclonal antibody therapy for solid tumors. Cancer Treat Rev. 2000;26(4):269–286. doi: 10.1053/ctrv.2000.0176. [DOI] [PubMed] [Google Scholar]
- Klein CA, Blankenstein TJF, Schmidt-Kittler O. Genetic heterogeneity of single disseminated tumour cells in minimal residual cancer. The Lancet. 2002a;360:683–689. doi: 10.1016/S0140-6736(02)09838-0. [DOI] [PubMed] [Google Scholar]
- Klein CA, Seidl S, Petat-Dutter K. Combined transcriptome and genome analysis of singel micrometastatic cells. Nat Biotech. 2002b;20:387–392. doi: 10.1038/nbt0402-387. [DOI] [PubMed] [Google Scholar]
- Klein CA, Schmidt-Kittler O, Schardt JA. Comparative Genomic Hybridization, Loss of Heterozygosity, and DNA sequence analysis of Single Cells. PNAS. 1999;96:4494–4499. doi: 10.1073/pnas.96.8.4494. [DOI] [PMC free article] [PubMed] [Google Scholar]
- Ko Y, Grunewald E, Totzke G, Klinz M, Fronhoffs S, Gouni-Berthold I, Sachinidis A, Vetter H. High percentage of false-positive results of cytokeratin 19 RT-PCR in blood: A model for the analysis of illegitimate gene expression. Oncology. 2000;59:81–88. doi: 10.1159/000012126. [DOI] [PubMed] [Google Scholar]
- Kokkinos MI, Wafai R, wong MK, Newgreen DF, Thompson EW, Waltham M. Vimentin and Epithelial-Mesenchymal Transition in Human Breast Cancer-Observations in vitro and in vivo. Cells Tissue Organs. 2007;185:191–203. doi: 10.1159/000101320. [DOI] [PubMed] [Google Scholar]
- Lansdorp PM, Aalberse RC, Bos R, Schutter WG, Van Bruggen EF. Cyclic tetramolecular complexes of monoclonal antibodies: a new type of cross-linking reagent. Eur. J. Immunol. 1986;16(6):679–683. doi: 10.1002/eji.1830160615. [DOI] [PubMed] [Google Scholar]
- Lara O, Tong X, Zborowski M, Farag S, Chalmers JJ. Comparison of two Immmunomagnetic Separation Methodologies to Deplete T-cells from human blood samples. Biotechnol Bioeng. 2006;94(1):66–80. doi: 10.1002/bit.20807. [DOI] [PubMed] [Google Scholar]
- Lara O, Tong X, Zborowski M, Chalmers JJ. Enrichment of Rare Cancer Cells through Depletion of Normal Cells Using Density and Flow-Through, Immunomagnetic Cell Separation. Exp Hematol. 2004;32(10):891–904. doi: 10.1016/j.exphem.2004.07.007. [DOI] [PubMed] [Google Scholar]
- McCloskey K, Chalmers JJ, Zborowski M. Magnetic Cell Separation: Characterization of Magnetophoretic Mobility. Anal Chem. 2003a;75(4):6868–6874. doi: 10.1021/ac034315j. [DOI] [PubMed] [Google Scholar]
- McCloskey K, Moore L, Hoyos M, Rodrigues A, Chalmers JJ, Zborowski M. Magnetic cell separation is a function of antibody binding capacity (ABC) Biotechnology Progress. 2003b;19(3):899–907. doi: 10.1021/bp020285e. [DOI] [PubMed] [Google Scholar]
- McKenzie SB. Textbook of Hematology. Williams and Wilkins; Baltimore: 1996. [Google Scholar]
- Mocellin S, Hoon D, Ambrosi A, Nitti D, Rossi CR. The Prognostic Value of Circulating Tumor Cells in Patients with Melanoma: A Systematic Review and Meta-analysis. Clin Cancer Res. 2006;12:4605–4613. doi: 10.1158/1078-0432.CCR-06-0823. [DOI] [PubMed] [Google Scholar]
- Pantel K, Brakenhoff RH. Dissecting the metastatic cascade. Nat Rev. 2004;4:448–456. doi: 10.1038/nrc1370. [DOI] [PubMed] [Google Scholar]
- Partridge M, Brkenhoff R, Phillips E. Detection of Rare Disseminated Tumor Cells Identifies Head and Neck Cancer Patients at Risk of Treatment Failure. Clinical Cancer Research. 2003;9:5287–5294. [PubMed] [Google Scholar]
- Paterlini-Brechot P, Benali NL. Circulating tumor cells (CTC) detection: Clinical impact and future directions. Cancer Letters. 2007;253:180–204. doi: 10.1016/j.canlet.2006.12.014. [DOI] [PubMed] [Google Scholar]
- Racila E, Euhus D, Weiss AJ, Rao C, McConnell J, Terstappen LWMM, Uhr JW. Detection and characterization of carcinoma cells in the blood. Proc. Natl. Acad. Sci. 1998;95:4589–4594. doi: 10.1073/pnas.95.8.4589. [DOI] [PMC free article] [PubMed] [Google Scholar]
- Riethdorf S, Fritsche H, Muller V. Detection of Circulating Tumor Cells in Peripheral Blood of Patients with Metastatic Breast Cancer: A Validation Study of the CellSearch System. Clin. Cancer Res. 2007;13(3):920–928. doi: 10.1158/1078-0432.CCR-06-1695. [DOI] [PubMed] [Google Scholar]
- Schmidt-Kittler O, Ragg T, Daskalakis A. From latent disseminated cells to overt metastasis: Genetic analysis of systemic breast cancer progression. PNAS. 2003;100(13):7737–7742. doi: 10.1073/pnas.1331931100. [DOI] [PMC free article] [PubMed] [Google Scholar]
- Sun L, Zborowski M, Moore L, Chalmers JJ. Continuous, Flow-Through Immunomagnetic Cell Separation in a Quadrupole Field. Cytometry. 1998;33:469–475. doi: 10.1002/(sici)1097-0320(19981201)33:4<469::aid-cyto11>3.0.co;2-6. [DOI] [PubMed] [Google Scholar]
- Thiery JP, Sleeman JP. Complex networks orchestrate epithelial-mesenchymal transitions Natt. Rec. Mol. Cell. Biol. 2006;7:131–142. doi: 10.1038/nrm1835. [DOI] [PubMed] [Google Scholar]
- Tong X, Yang L, Lang JC, Zborowski M, Chalmers JJ. Application of immunomagnetic cell enrichment in combination with RT-PCR for the detection of rare circulating head and neck tumor cells in human peripheral blood. Cytometry B Clin. Cytom. 2007a;72(5):310–323. doi: 10.1002/cyto.b.20177. [DOI] [PubMed] [Google Scholar]
- Tong X, Xiong Y, Zborowski M, Farag SS, Chalmers JJ. A Novel High Throughput Immunomagnetic Cell Sorting System for Potential Clinical Scale Depletion of T Cells for Allogeneic Stem Cell Transplantation. Experimental Hematology. 2007b;35(10):1613–22. doi: 10.1016/j.exphem.2007.06.015. [DOI] [PMC free article] [PubMed] [Google Scholar]
- Zen H, Nakashiro KI, Shintani S, Aramoto T, Hamakawa H. Detection of circulating cancer cells in human oral squamous cell carcinoma. Int. J. Oncol. 2003;(23):605–610. [PubMed] [Google Scholar]
- Zhang H, Williams PS, Zborowski M, Chalmers JJ. Reduction of binding affinities/avidities of Antibody-Antigen and Strepadvidin-biotin: Quantification and Scale-up implications. Biotech. Bioeng. 2006;95:812–829. doi: 10.1002/bit.21024. [DOI] [PubMed] [Google Scholar]