Abstract
Purpose
To investigate the impact of T2 relaxation of the carotid wall on measurements of its thickness.
Materials and Methods
The common carotid artery wall was imaged using a spin echo sequence acquired at four echo times (17 ms to 68 ms) in 65 participants as part of VALIDATE study. Images were acquired transverse to the artery 1.5 cm proximal to the flow divider. Mean wall thickness, mean wall signal intensity, lumen area, and outer wall area were measured for each echo. Contours were also traced on the image from the fourth echo and then propagated to the images from the preceding echoes. This was repeated using the image from the first echo. Mean wall signal intensity measurements at the four echo times were fit to a mono-exponential decay curve to derive the mean T2 relaxation time for each set of contours.
Results
Mean wall thickness decreased with increasing echo time, with an average thickness reduction of 8.6% between images acquired at the first and last echo times (TE) (0.93 mm at TE 17 ms versus 0.85 mm at TE 68 ms, P < 0.001). Average T2 relaxation time of the carotid wall decreased by 3% when the smaller contours from the last echo were used, which excluded the outer-most layer (54.3 ± 7.6 ms versus 52.7 ± 6.6 ms, P = 0.03).
Conclusion
Carotid wall thickness measurements decrease with echo time as expected by the fast T2 relaxation time of the outer-most layer, namely the adventitia. A short echo time is needed for thickness measurements to include adventitia, which plays an important role in plaque development.
Keywords: atherosclerosis, carotid artery, T2 relaxation, contrast-enhanced MRI
Atherosclerosis is a chronic disease and its slow progression provides an opportunity for diagnosis before symptoms occur. High resolution carotid MRI can noninvasively detect and characterize atherosclerotic plaques, particularly in advanced stages (1). Recent work has shown that early and intermediate stages of carotid disease also can be reliably detected using black blood MRI (BBMRI) techniques (2).
Multi-contrast BBMRI (T1W, T2W, and PDW) is commonly used to measure wall thickness and assess plaque size. Sequence weightings are often used interchangeably for this purpose (2,3), but this introduces variability in wall thickness measurements (4). This variability could relate to variations in relaxation times across the three arterial wall layers (5–7). For example, the outermost layer (i.e., adventitia) has the shortest T2 value compared with the other layers (i.e., media and intima) (5,6), and might not be included in wall thickness measurements on T2W images because of its fast signal decay (8). This can affect the clinical relevance of carotid wall thickness measurements given the important role of the adventitia in atherosclerosis formation and risk (9). For example, progression of vasa vasorum within adventitia precedes endothelial dysfunction (10) and is associated with atherosclerosis development (11).
We therefore sought to investigate the impact of T2 relaxation of the carotid wall on measurements of its thickness. For this purpose, we measured carotid wall thicknesses at different echo times using the multi-echo sequence data from the Vascular Aging—The Link That Bridges Age to Atherosclerosis (VALIDATE) study. Because of the fast T2 decay of the adventitia, we expected that carotid wall thicknesses measured at longer echo times (i.e., more T2 weighting) would be smaller than those measured using shorter echo times from the same sequence.
MATERIALS AND METHODS
Human Studies
Study Population
Participants for this study were drawn from a subset of the VALIDATE study, which consisted of healthy individuals (≥ 20 Years), recruited from the Baltimore Longitudinal Study for Aging (BLSA), a community-based cohort. Of 83 participants imaged using a 3 Tesla (T) MRI scanner, 8 were excluded for having evidence of luminal narrowing, to minimize the contribution of atherosclerotic disease on transverse relaxation measurements of the vessel wall, and an additional 10 were excluded for having an MRI image quality (IQ) score of 0 (0: Fail; 1: Acceptable; 2: Good). A total of 65 BLSA participants (23 males; mean age, 62.8 years; range, 35–91 years) were included in this study. Institutional review board approval was obtained and participants provided informed consent before the examinations.
MRI Examinations
MRI scans were performed on a 3T MRI Achieva scanner (Philips Healthcare, The Netherlands) using a bilateral four-channel phased-array carotid coil (Pathway MRITM). All scans were performed on the right carotid artery. A standard VALIDATE carotid MRI protocol was used including MR angiography sequences (e.g., Time-of-flight and contrast-enhanced) and BBMRI sequences (12).
T2 relaxation times were determined using a four-echo turbo spin-echo sequence with a TE of 17, 34, 51, and 68 ms and a turbo factor of 4. A single 2-mm slice was acquired, with an acquired in-plane resolution of 0.51 mm × 0.58 mm (field of view, 130 mm × 130 mm). The slice was placed transverse to the nominal long axis of the common carotid artery (CCA) at a distance 1.5 cm proximal to the flow divider. One average was acquired, and the reconstructed resolution was 0.25 mm × 0.25 mm.
The sequence used an electrocardiogram-triggered double inversion-recovery preparation with the inversion time set to eliminate the signal from flowing blood. The trigger delay was set to shortest andTR was set to 2RR. Fat suppression was applied. The acquisition time was approximately 5.8 min depending on the heart rate of the participant.
Image Analysis
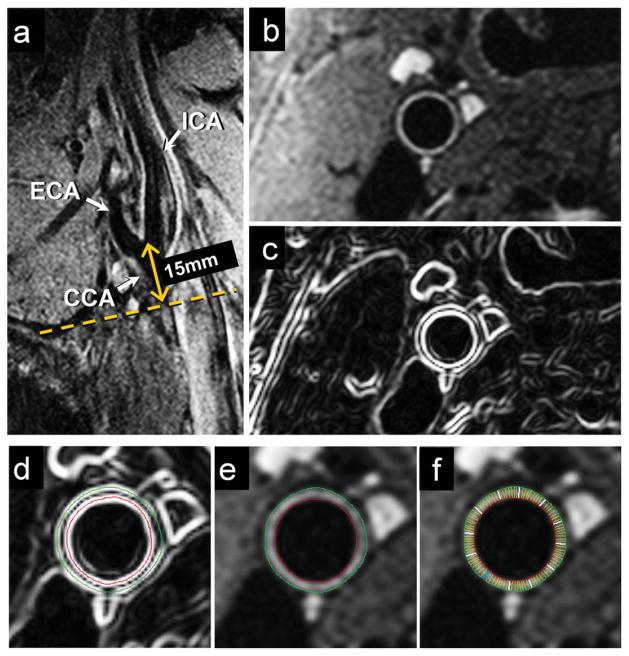
MRI images were analyzed by trained readers using customized software (VesselMass, Leiden University Medical Center, the Netherlands). First, edge-enhanced (gradient) images were generated from the original grayscale images using Sobel operator (13). These gradient images provide an objective definition for soft tissue boundaries, which eliminates the influence of subjective window/level settings. Lumen and outer wall contours were traced on gradient images then transferred to the magnitude images to generate the mean wall signal intensity (SI), lumen area (LA), wall area (WA), outer wall area (OWA), and mean wall thickness (MWT) using an automated feature of VesselMass (Fig. 1). The multiplanar reconstructions of the contrast-enhanced MRA source images were used to confirm lumen contours.
Figure 1.
Slice positioning and processing for wall thickness measurements in a VALIDATE participant. A long axis black blood MRI image through the right carotid bifurcation (a) was used to orient a short axis multi-echo BBMRI slice 15 mm below the flow divider (dotted line). The resulting magnitude image (b) was then analyzed as a gradient image (c) generated using Sobel operator to guide the placement of outer wall (green) and lumen (red) contours using VesselMass software (d). Contours were transferred to the magnitude image (e), and used to generate signal intensity, wall thickness and area measurements. [Color figure can be viewed in the online issue, which is available at wileyonlinelibrary.com.]
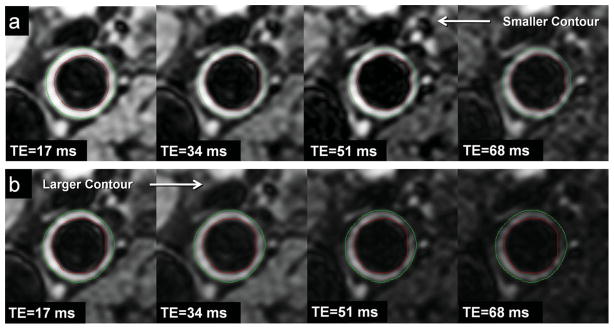
Because we noticed that wall thickness decreased from the first to the last echo, T2 relaxation time was calculated using two approaches: (i) Contours were semi-automatically traced on the image from the fourth echo (TE = 68 ms, Fig. 2) and then propagated to the images from the preceding echoes. (ii) Contours were semi-automatically traced on the image from the first echo (TE = 17 ms, Fig. 2) and then propagated to the images from subsequent echoes. The mean SI of the vessel wall at each echo was generated and fit to a mono-exponential decay curve, and the T2 relaxation time was extracted using the linear least-squares calculation supplied in Matlab (The Mathworks, Natick, MA). Mean T2 relaxation times were calculated for each vessel and averaged over all participants.
Figure 2.

Two contouring methods used for calculating T2 relaxation. a: Lumen and outer wall contours were traced on the image from the fourth echo (TE = 68 ms) and propagated to the images from the preceding echoes (i.e., smaller contour). b: Contours were traced on the image from the first echo (TE = 17 ms) and propagated to the images from the subsequent echoes (i.e., larger contour). [Color figure can be viewed in the online issue, which is available at wileyonlinelibrary.com.]
Statistical Analysis
Data were analyzed using SPSS 18.0 (SPSS Inc, Chicago, IL). All morphological variables (MWT, LA, WA, and OWA) were measured at each echo per participant and compared across the four echoes (TE1, TE = 17 ms; TE2, TE = 34 ms; TE3, TE = 51 ms and TE4, TE = 68 ms) using a two-tailed paired t-test. The same test was conducted to compare measured T2 values fitted from the two contouring methods described above. Inter- and intrareader agreement of all morphological variables were estimated based on 20 repeat readings separated by at least 3 months to prevent reader recall. Agreement was assessed using intraclass correlation coefficients (ICC), and reliabilities below 0.4 were characterized as poor, 0.4 to 0.75 as fair to good, and above 0.75 as excellent.
Analytic MRI Model
Vessel Wall Model
Because no reference standard exists for healthy common carotid arteries, we developed an simple analytical model that independently simulates wall thicknesses based on anticipated T1 and T2 values of the layers of a typical CCA vessel segment to interpret and validate the results obtained from our human studies. The specifications of this model were derived from previous anatomic reports that describe the average lumen radius (3.7 mm) (14) and thicknesses of the intima (0.12 mm) (15), media (0.53 mm) (16), and adventitia (0.17 mm) (17). T1 values of the three vessel layers anticipated at 3T were extrapolated from values reported at 9.4T (5), based on the assumption that T1 is proportional to the amplitude of the static field raised to the 4/10th power (18). The T1 values determined for the intima, media, and adventitia were 1464 ms, 1198 ms, and 940 ms, respectively. The T2 values for the vessel layers were derived from in vivo measurements reported in the literature based on the assumption that these values have a relatively low degree of dependence on the field strength at which they were measured (19). These T2 values were 112.4 ms, 65 ms, and 24.6 ms for the intima (6), media (7), and adventitia (5), respectively.
Signal Intensity Simulations
Simulations of signal intensities of intima, media, and adventitia at each echo time were performed using the same multi-echo sequence used in our in vivo MRI studies with identical imaging parameters. A numerical simulation based on the Bloch equations (20) was implemented in MATLAB (MATLAB, Natick, MA) to calculate the relative signal intensities of the three layers at each echo time. These relative intensities were then imposed on an analytical k-space solution for a uniformly magnetized circle (21), with a spatial resolution matching the in vivo acquisitions. Each wall layer was represented as a circle with radius equal to lumen radius plus the cumulative wall thickness. The lumen circle alone was assigned a zero intensity to approximate the BBMRI protocol. The individual k-spaces were summed and then inverse Fourier transformed to produce the simulated image of the layered wall. Wall boundaries were identified by automated edge detection, and the average wall signal computed. This was repeated for each of the four simulated echo times, and a mono-exponential fit was used to estimate the simulated T2 relaxation time.
RESULTS
Wall Thickness and Area Measurements
Table 1 depicts the MWT, LA, WA, and OWA values averaged over 65 VALIDATE participants for each TE of the multi-echo sequence. The MWT values were compared at each echo time with those predicted from the analytic vessel model using a true thickness of 0.82 mm (0.12 mm intima + 0.53 mm media + 0.17 mm adventitia). A wall thickness reduction with increasing echo times was observed in both cases. For VALIDATE cases, the reduction in MWT was 4.3% (P = 0.09) from TE1 to TE2, 6.5% (P = 0.002) from TE1 to TE3, and 8.6% (P < 0.001) from TE1 to TE4. A similar trend was observed for the analytic model (4.6%, 7.0%, and 8.1%, respectively).
Table 1.
Comparison of Carotid Wall Morphological Measurements at each echo time*
| TE1 | TE2 | TE3 | TE4 | |
|---|---|---|---|---|
| Average MWT*, mm | 0.93 ± 0.22 | 0.89 ± 0.19 | 0.87 ± 0.20 | 0.85 ± 0.21 |
| Average LA, cm2 | 0.335 ± 0.104 | 0.335 ± 0.101 | 0.327 ± 0.099 | 0.327 ± 0.099 |
| Average WA*, cm2 | 0.216 ± 0.069 | 0.208 ± 0.065 | 0.202 ± 0.065 | 0.196 ± 0.067 |
| Average OWA*, cm2 | 0.551 ± 0.149 | 0.543 ± 0.148 | 0.529 ± 0.144 | 0.523 ± 0.143 |
MWT, mean wall thickness; LA, lumen area; WA, wall area; OWA, outer wall area. TE1, TE = 17 ms; TE2, TE = 34 ms; TE3, TE = 51ms and TE4, TE = 68ms.
P < 0.02 for paired (TE1 vs. TE4) measurements.
Average WA and OWA measurements for the VALIDATE participants (Table 1) also decreased with increasing echo times. Compared with values measured at TE1, values at TE4 decreased by 10% (0.216 ± 0.069 cm2 versus 0.196 ± 0.0.067 cm2; P = 0.01) and 5% (0.55 ± 0.15 cm2 versus 0.52 ± 0.14 cm2; P = 0.02) for WA and OWA, respectively. There was no significant difference between LA values measured at each TE (average LA at TE1 and TE4 were 0.34 ± 0.10 cm2 and 0.33 ± 0.10 cm2, respectively, P = 0.09).
Inter-reader/intrareader reliability (ICC) estimates for MWT, LA, and WA measurements were 0.89/0.90, 0.95/0.98, and 0.90/0.91, respectively.
T2 relaxation Times of the Vessel Wall
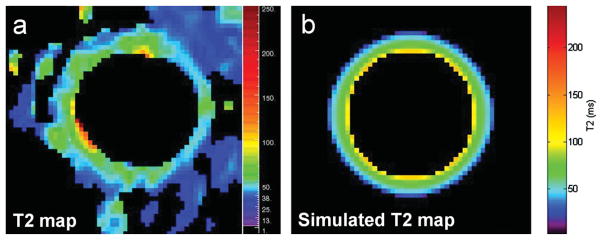
Figure 3 shows the T2 map of the CCA wall shown in Figure 2 based on a voxel-by-voxel fit to a mono-exponential decay curve. The lowest T2 values were observed along the rim of the outer wall indicating the fastest signal decay (Fig. 3a), and the simulated T2 map generated from the analytic model validated these in vivo T2 measurements (Fig. 3b).
Figure 3.

T2 map of the CCA wall shown in Figure 2 based on in vivo data (a) and corresponding T2 map based on the analytic vessel model derived from values reported in the literature (b). The T2 map (a) was generated based on a mono-exponential voxel-by-voxel fit of signal intensity measurements of the CCA wall at each echo time. The simulated T2 map (b) was generated based on the estimated signal intensities of the vessel wall at each echo fit to a mono-exponential curve.
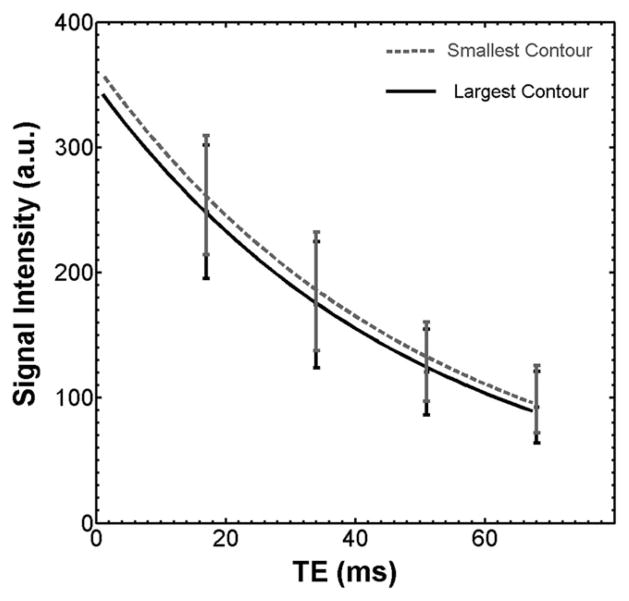
Figure 4 shows the signal decay curves using the two approaches described in the Methods (i.e., using the smaller contour (fourth echo) versus the larger contour (first echo) for delineating the vessel walls for all four images within each series). The R-square goodness-of-fit analysis revealed excellent agreement (R2, 0.99) between the data points at each echo and the decay curve for both approaches. The average T2 value determined using the larger contour (TE at 17 ms) decreased by 3% compared with that determined using the smaller contour (TE at 68 ms) based on the 65 VALDIATE participant exams (54.3 ± 7.6 ms versus 52.7 ± 6.6 ms, P = 0.03). This decrease was consistent for all 65 cases. Because the lumen areas were not significantly different between contours using the two approaches (i.e., average LA at TE1 compared with TE4), the larger contour approach included more of the outer wall compared with the smaller contour approach, suggesting the lower T2 value measured using the larger contour was primarily due to more inclusion of adventitia. This result was validated by the simulation, which demonstrated a 4% decrease in the T2 value of the wall comparing measurements based on the largest versus the smallest contours (64.60 ms versus 62.05 ms, respectively).
Figure 4.
Signal decay curves for the CCA wall using the two contouring methods shown in Figure 2. The larger contour resulted in a lower calculated T2 relaxation time.
DISCUSSION
Our results indicate MRI measurements of wall thickness decrease at longer echo times, and this appears to be due to the fast T2 relaxation of the outermost vessel wall layer, namely the adventitia. Although adventitial thickness might represent a small portion of the total wall thickness, its detection has important clinical relevance especially for identifying early carotid disease. This highlights the importance of the standardization of MRI protocols, particularly in large population studies or clinical trials.
Currently, T1W, T2W, and PDW BBMRI sequences are used interchangeably for measuring arterial wall thickness (2,3). Zhang et al (4) reported differences in MRI measurements using multi-weighted sequences at 1.5T. Our results provide insight into the basis of these differences, namely that the fast signal decay of the adventitia is an important contributing factor and, consequently, the echo time is an important consideration when designing an MRI protocol and interpreting thickness measurements by MRI. We observed a reduction in MWT by 8.6% (P < 0.001) when the echo time was increased from 17 ms to 68 ms, and this change could be accounted for by exclusion of the T2-short adventitia as can be predicted based on ex vivo specimen studies (5,6) and validated by our simulation. Therefore, a short echo time (T1W or PDW) is needed for wall thickness measurements to include adventitia.
To our knowledge, this is the first report of in vivo T2 relaxation measurements of the human carotid artery wall at 3T. Brown et al (18) reported in vivo mean T2 relaxation measurements at 1.5T in human femoral and popliteal arteries (52.5 ± 10.4 and 48.1 ± 5.7 ms, respectively) that approximated our measurements of the carotid artery, as we might anticipate given the relatively small dependence of T2 relaxation time on field strength (19). Knowledge of these T2 values in the carotid artery can help to optimize sequence design for image contrast.
Limitations to our study include: (i) For our analytic model we were forced to use measurements from ex vivo specimen studies to model the T1 and T2 relaxation characteristics of the layers of our carotid wall simulation because of the lack of published in vivo data; however, Toussaint et al (5) showed no difference in relaxation time measurements between ex vivo and in vivo studies. (ii) Our multi-echo sequence was cardiac-gated for flow suppression, in part to minimize pulsatile flow artifacts that would otherwise be pronounced at longer echo times. This dependence of TR on heart rate can contribute to variations in signal intensity; however, the T2 relaxation values were derived from decay rates and should not be significantly affected by these variations. (iii) Our acquired resolution was inadequate to discriminate individual vessel layers because of partial volume effects. We, therefore, reported a global T2 measurement of the vessel wall. (iv) We were unable to correlate MRI images with histology given the nature of this study. Even when available, our endarterectomy specimens are generally resected without inclusion of adventitia.
In summary, carotid artery wall thickness measurements by MRI decrease with increasing echo time and this appears to relate to the short T2 relaxation time of the outer, adventitial wall. This dependence on echo time contributes to variations in wall thicknesses encountered using different sequence weightings and is important to consider when designing an MRI protocol and when interpreting thickness measurements. A short echo time is needed if wall thickness measurements are to include the adventitial layer, which plays an important role in the development of atherosclerosis.
References
- 1.Wasserman BA, Smith WI, Trout HH, III, Cannon RO, III, Balaban RS, Arai AE. Carotid artery atherosclerosis: in vivo morphologic characterization with gadolinium-enhanced double-oblique MR imaging initial results. Radiology. 2002;223:566–573. doi: 10.1148/radiol.2232010659. [DOI] [PubMed] [Google Scholar]
- 2.El Aidi H, Mani V, Weinshelbaum KB, et al. Cross-sectional, prospective study of MRI reproducibility in the assessment of plaque burden of the carotid arteries and aorta. Nat Clin Pract Cardiovasc Med. 2009;6:219–228. doi: 10.1038/ncpcardio1444. [DOI] [PMC free article] [PubMed] [Google Scholar]
- 3.Crowe LA, Ariff B, Keegan J, et al. Comparison between three-dimensional volume-selective turbo spin-echo imaging and two-dimensional ultrasound for assessing carotid artery structure and function. J Magn Reson Imaging. 2005;21:282–289. doi: 10.1002/jmri.20257. [DOI] [PubMed] [Google Scholar]
- 4.Zhang S, Hatsukami TS, Polissar NL, Han C, Yuan C. Comparison of carotid vessel wall area measurements using three different contrast-weighted black blood MR imaging techniques. Magn Reson Imaging. 2001;19:795–802. doi: 10.1016/s0730-725x(01)00408-8. [DOI] [PubMed] [Google Scholar]
- 5.Toussaint JF, LaMuraglia GM, Southern JF, Fuster V, Kantor HL. Magnetic resonance images lipid, fibrous, calcified, hemorrhagic, and thrombotic components of human atherosclerosis in vivo. Circulation. 1996;94:932–938. doi: 10.1161/01.cir.94.5.932. [DOI] [PubMed] [Google Scholar]
- 6.Morrisett J, Vick W, Sharma R, et al. Discrimination of components in atherosclerotic plaques from human carotid endarterectomy specimens by magnetic resonance imaging ex vivo. Magn Reson Imaging. 2003;21:465–474. doi: 10.1016/s0730-725x(02)00643-4. [DOI] [PubMed] [Google Scholar]
- 7.Raynaud JS, Bridal SL, Toussaint JF, et al. Characterization of atherosclerotic plaque components by high resolution quantitative MR and US imaging. J Magn Reson Imaging. 1998;8:622–629. doi: 10.1002/jmri.1880080316. [DOI] [PubMed] [Google Scholar]
- 8.Skilton MR, Boussel L, Bonnet F, et al. Carotid intima-media and adventitial thickening: comparison of new and established ultrasound and magnetic resonance imaging techniques. Atherosclerosis. 2011;215:405–410. doi: 10.1016/j.atherosclerosis.2010.12.036. [DOI] [PubMed] [Google Scholar]
- 9.Qiao Y, Etesami M, Astor BC, Zeiler SR, Trout HH, III, Wasserman BA. Carotid plaque neovascularization and hemorrhage detected by MR imaging are associated with recent cerebrovascular ischemic events. AJNR Am J Neuroradiol. 2012;33:755–760. doi: 10.3174/ajnr.A2863. [DOI] [PMC free article] [PubMed] [Google Scholar]
- 10.Herrmann J, Lerman LO, Rodriguez-Porcel M, et al. Coronary vasa vasorum neovascularization precedes epicardial endothelial dysfunction in experimental hypercholesterolemia. Cardiovasc Res. 2001;51:762–766. doi: 10.1016/s0008-6363(01)00347-9. [DOI] [PubMed] [Google Scholar]
- 11.Magnoni M, Coli S, Marrocco-Trischitta MM, et al. Contrast-enhanced ultrasound imaging of periadventitial vasa vasorum in human carotid arteries. Eur J Echocardiogr. 2009;10:260–264. doi: 10.1093/ejechocard/jen221. [DOI] [PubMed] [Google Scholar]
- 12.Hoi Y, Wasserman BA, Lakatta EG, Steinman DA. Effect of common carotid artery inlet length on normal carotid bifurcation hemodynamics. J Biomech Eng. 2010;132:121008. doi: 10.1115/1.4002800. [DOI] [PMC free article] [PubMed] [Google Scholar]
- 13.Qiao Y, Steinman DA, Qin Q, et al. Intracranial arterial wall imaging using three-dimensional high isotropic resolution black blood MRI at 3. 0 Tesla. J Magn Reson Imaging. 2011;34:22–30. doi: 10.1002/jmri.22592. [DOI] [PubMed] [Google Scholar]
- 14.Wasserman BA, Astor BC, Sharrett AR, Swingen C, Catellier D. MRI measurements of carotid plaque in the atherosclerosis risk in communities (ARIC) study: methods, reliability and descriptive statistics. J Magn Reson Imaging. 2010;31:406–415. doi: 10.1002/jmri.22043. [DOI] [PMC free article] [PubMed] [Google Scholar]
- 15.Zarins CK, Giddens DP, Bharadvaj BK, Sottiurai VS, Mabon RF, Glagov S. Carotid bifurcation atherosclerosis. Quantitative correlation of plaque localization with flow velocity profiles and wall shear stress. Circ Res. 1983;53:502–514. doi: 10.1161/01.res.53.4.502. [DOI] [PubMed] [Google Scholar]
- 16.Anayiotos AS, Jones SA, Giddens DP, Glagov S, Zarins CK. Shear stress at a compliant model of the human carotid bifurcation. J Biomech Eng. 1994;116:98–106. doi: 10.1115/1.2895710. [DOI] [PubMed] [Google Scholar]
- 17.Molinari F, Zeng G, Suri JS. An integrated approach to computer-based automated tracing and its validation for 200 common carotid arterial wall ultrasound images: a new technique. J Ultrasound Med. 2010;29:399–418. doi: 10.7863/jum.2010.29.3.399. [DOI] [PubMed] [Google Scholar]
- 18.Brown R, Nguyen TD, Spincemaille P, et al. Effect of blood flow on double inversion recovery vessel wall MRI of the peripheral arteries: quantitation with T2 mapping and comparison with flow-insensitive T2-prepared inversion recovery imaging. Magn Reson Med. 2010;63:736–744. doi: 10.1002/mrm.22227. [DOI] [PMC free article] [PubMed] [Google Scholar]
- 19.Edelstein WA, Bottomley PA, Hart HR, Smith LS. Signal, noise, and contrast in nuclear magnetic resonance (NMR) imaging. J Comput Assist Tomogr. 1983;7:391–401. doi: 10.1097/00004728-198306000-00001. [DOI] [PubMed] [Google Scholar]
- 20.Schar M, Kim WY, Stuber M, Boesiger P, Manning WJ, Botnar RM. The impact of spatial resolution and respiratory motion on MR imaging of atherosclerotic plaque. J Magn Reson Imaging. 2003;17:538–544. doi: 10.1002/jmri.10287. [DOI] [PubMed] [Google Scholar]
- 21.Antiga L, Wasserman BA, Steinman DA. On the overestimation of early wall thickening at the carotid bulb by black blood MRI, with implications for coronary and vulnerable plaque imaging. Magn Reson Med. 2008;60:1020–1028. doi: 10.1002/mrm.21758. [DOI] [PubMed] [Google Scholar]


