

Abstract
The ecological and evolutionary processes leading to present-day biological diversity can be inferred by reconstructing the phylogeny of living organisms, and then modelling potential processes that could have produced this genealogy. A more direct approach is to estimate past processes from the fossil record. The Carnivora (Mammalia) has both substantial extant species richness and a rich fossil record. We compiled species-level data for over 10 000 fossil occurrences of nearly 1400 carnivoran species. Using this compilation, we estimated extinction, speciation and net diversification for carnivorans through the Neogene (22–2 Ma), while simultaneously modelling sampling probability. Our analyses show that caniforms (dogs, bears and relatives) have higher speciation and extinction rates than feliforms (cats, hyenas and relatives), but lower rates of net diversification. We also find that despite continual species turnover, net carnivoran diversification through the Neogene is surprisingly stable, suggesting a saturated adaptive zone, despite restructuring of the physical environment. This result is strikingly different from analyses of carnivoran diversification estimated from extant species alone. Two intervals show elevated diversification rates (13–12 Ma and 4–3 Ma), although the precise causal factors behind the two peaks in carnivoran diversification remain open questions.
Keywords: capture–mark–recapture model, Caniformia, Feliformia, Pradel model
1. Introduction
The diversity and spatial distributions of living species are the result of past and ongoing ecological and evolutionary processes. Understanding such processes can provide insights into the mechanisms promoting speciation, as well as driving factors behind population decline, species extirpation and extinction. Ecological and evolutionary processes are often modelled on phylogenies of living organisms [1]. But modern biodiversity offers only a snapshot of the total taxonomic diversity of any clade and may not represent persistent features of global biogeography [2], and only partially reflect processes acting across deep time [3]. A more direct approach to reconstructing diversification patterns would use information contained in the fossil record [4], not least because speciation and extinction rates often vary considerably through time [2,5–7]. However, fossil data come with the added complication of potentially large variations in sampling rates, which must be accounted for when estimating diversification rates [5,6,8–10].
There have been several attempts to correct for the undesirable effects of sampling heterogeneity in palaeontological data [6,10–14]. Here, we embrace a framework first developed in statistical ecology, where sampling and biological parameters of interest are estimated simultaneously. The fact that the probability of observation in an ecological sample is never 100% has a large impact on estimates of recruitment and survivorship, and simultaneous modelling of biological process with observation probability has a long history in the ecological literature [15–19]. Capture–mark–recapture (CMR) models were developed to estimate recruitment and survivorship for individuals within animal populations, but are easily adapted to palaeontological datasets to address rates of speciation/origination and extinction [20]. Despite obvious parallels, these approaches remain little explored in palaeobiology [9,20–23], due in large part to the fact that they are ‘data hungry’ (parameter-rich and requiring large amounts of data to constrain estimates).
The mammalian order Carnivora (dogs, cats, bears, hyenas and related taxa) consists of approximately 270 extant species [24], and possesses a rich and well-documented fossil record [25,26]. Recent analyses have resolved many outstanding questions of carnivoran phylogeny, including the monophyly of the aquatic pinnipeds (seals, sea lions and walruses), the sister-group relationship of pinnipeds and musteloids (weasels, badgers and relatives), the monophyly of a clade containing hyenas, mongooses and the endemic carnivorans of Madagascar, and the polyphyly of the Viverridae (civets and gennets) [27–29]. Carnivorans have been used to document macroevolutionary patterns of character evolution and test hypotheses of underlying processes [25,26,30–33]. However, knowledge of past diversification patterns for this otherwise well-studied group, and hence potential drivers of that diversity, remains limited.
Here, we examine global diversification dynamics across a 20 Myr time interval spanning the Miocene and Pliocene, using a database of 10 331 fossil occurrences for 1392 carnivoran species. We estimated interval-to-interval probabilities of speciation and extinction, and rates of net diversification, while simultaneously accounting for interval-specific sampling rates, calculating confidence intervals (CIs) around these estimates [19–21]. Specifically, we use a CMR model known as the Pradel seniority model (hereafter, ‘Pradel model’) [19], using fossil occurrence data as ‘sighting records’ [20,21]. We also demonstrate the robustness of our inferences with respect to the resolution of time intervals, position of time-interval boundaries, the use of species- versus genus-level data and model fit.
2. Material and methods
We downloaded Carnivora species occurrence data from the Paleobiology Database (PBDB, 9 August 2012) and from the New and Old Worlds Database of Fossil Mammals (NOW, 16 August 2012) [34]. We augmented these data using compilations in Finarelli [25] and Démére et al. [35], and added occurrences in the interval (1,0] Ma for extant species with at least one fossil occurrence [36]. We analysed data for 24 one-million-year time intervals and present results for 20 intervals (see the electronic supplementary material), between 22–21 Ma (our notation here signifies the time interval from 22 Ma to 21 Ma inclusive, and the same principle applies to notation throughout) and 3–2 Ma, coinciding approximately with the extent of the Miocene and Pliocene [37]. The number of occurrences for Pinnipedimorpha is much lower than for terrestrial carnivorans [35], so we investigated the impact of these data by running separate analyses for all carnivoran taxa, and terrestrial carnivorans only. We use the Pradel model [19], to estimate extinction and speciation probabilities and diversification rates while jointly estimating sampling probabilities. We detail the Pradel model and its assumptions in the electronic supplementary material, but emphasize key features that are important for the interpretation of our results here.
In the CMR literature, a data row indicating the intervals in which an individual was alive and sampled is termed a ‘capture history’. We adapt this to fossil ‘sampling histories’, referring to time intervals, during which a taxon was extant and sampled. The forward-time probability of observing a sampling history for a taxon can be expressed in terms of sampling (p) and survival (φ) probabilities. For example, Taxon A might have a sampling history (sh), 101110, indicating that it was not sampled during intervals 2 and 6, but was extant and sampled in 1, 3, 4 and 5. We do not know whether Taxon A was extinct during interval 6, or simply not sampled. The probability of observing this sampling history, conditional on a first occurrence in interval 1, is
where the indices refer to time intervals. Note that survival estimates are between intervals (e.g. φ1 is survival from time interval 1–2), while sampling estimates are within time intervals. Extinction probability is then simply the complement of survival probability (1 − φ). Conversely, a reverse-time sampling history can be expressed in terms of sampling and seniority probabilities (γ), and origination (or speciation) probability is then (1 − γ). Net diversification rates can be derived from extinction and speciation probabilities. Estimates of extinction, speciation and diversification are thus freed from the confounding effects of the sampling nuisance parameter(s), which are explicitly modelled.
We initially compared 18 models including fully time-varying models with different extinction, speciation and diversification estimates for each time interval and ‘group’ models, in which Caniformia and Feliformia were estimated separately multiplicatively and additively. Our comparisons were considered in a likelihood framework. We focus our discussion mainly on three models: (i) a fully time-varying model for all Carnivora, (ii) a global model which is fully time-varying and multiplicative for separate Caniformia and Feliformia groups, and (iii) a time-constant model for the subgroups (1) Canidae–Amphicyonidae–Ursidae, (2) Musteloidea and (3) Pinnipedimorpha within Caniformia, and (4) Nimravidae–Felidae–Viverridae and (5) Herpestidae–Hyaenidae–Eupleridae within Feliformia (see electronic supplementary material, figure S1).
3. Results
Across Carnivora, average speciation probability per (1 Myr) interval is 0.244 (average s.e. of estimate: 0.066), which is marginally higher than the average extinction probability of 0.197 (0.060) (see electronic supplementary material, table S2). These all-Carnivora estimates correspond to the time-varying model, without group effect (Model 4 in electronic supplementary material, table S1), and form the default estimates we discuss, unless otherwise stated. Average net per capita diversification rate (‘diversification rate’, hereafter) for Carnivora is 0.090 (0.150) species per species per Myr. The global model specifying separate estimates for Caniformia and Feliformia (Model 1 in electronic supplementary material, table S1) are comparable with the all-Carnivora results (see electronic supplementary material, figures S2–S4 and tables S2–S4). Extinction, speciation and diversification rates are not temporally auto-correlated, and speciation and extinction probabilities are not temporally correlated with each another (see electronic supplementary material, figure S6).
Through the study interval, there are three notable features in the diversification rate: significantly positive diversification rate ‘peak’ at 13–12 Ma, another peak at 4–3 Ma and significantly negative diversification rate ‘dip’ at 3–2 Ma (figure 1). The first positive peak is associated with elevated speciation probability, whereas the 4–3 Ma peak is associated with decreased extinction probability (figure 1). The 3–2 Ma dip is associated with both increased extinction and reduced speciation (figure 1). These peaks are robust to bin-shifted interval boundaries, although the dip is not (see electronic supplementary material, figure S8 and table S7). The peaks are also robust to variance inflation factors correcting for imperfect model fit (see electronic supplementary material, figure S7). If our data had been less well-resolved temporally (2 Myr intervals), the same general pattern emerges, with the 13–12 Ma peak spread over several adjoining intervals, and a marked 4–2 Ma peak (see electronic supplementary material, figure S9 and table S8), and using genus-level information recovers all three features, although the pattern is more muted (see electronic supplementary material, figure S10 and table S5).
Figure 1.

Evolutionary and sampling dynamics. (a) Speciation probability, (b) extinction probability, (c) net diversification rates (horizontal line shows zero net diversification) and (d) sampling probability. These estimates are for all carnivoran species in the Neogene database, using the time-varying model (see the electronic supplementary material). Shaded areas are 95% CIs. Note that estimates in figure 1a–c are from the plotted time interval to the next, whereas estimates in figure 1d are for the time interval (midpoints are plotted).
Model selection recovers support for sampling probabilities and speciation and extinction probabilities that vary through time for both Feliformia and Caniformia (see electronic supplementary material, table S1). Estimating separate subclade rates demonstrates that Caniformia mirrors the overall Carnivora pattern. Caniformia estimates show the same early rise in speciation leading to the approximately 13 Ma peak. Extinction probabilities fall between 4 and 3 Ma with the same resulting peak at 4–3 Ma (see electronic supplementary material, figures S2 and S3, and table S3), and dip is also apparent between 3 and 2 Ma. Feliformia shows more variability in rate estimates, although the general carnivoran pattern is observed with the addition of two peaks in speciation/diversification at 19–18 and 6–5 Ma (see electronic supplementary material, figures S2 and S4, and table S4). Although we could not estimate time-varying rates for smaller subsets of Caniformia and Feliformia, we estimated average rates for three caniform and two feliform subgroups. Terrestrial caniform groups (Musteloidea and the Canidae–Amphicyonidae–Ursidae group) are characterized by lower diversification rates than the feliform groups (Hyaenidae–Herpestidae–Eupleridae and Viverridae–Nimravidae–Felidae), although the caniform speciation and extinction are higher (figure 2; electronic supplementary material, table S6).
Figure 2.
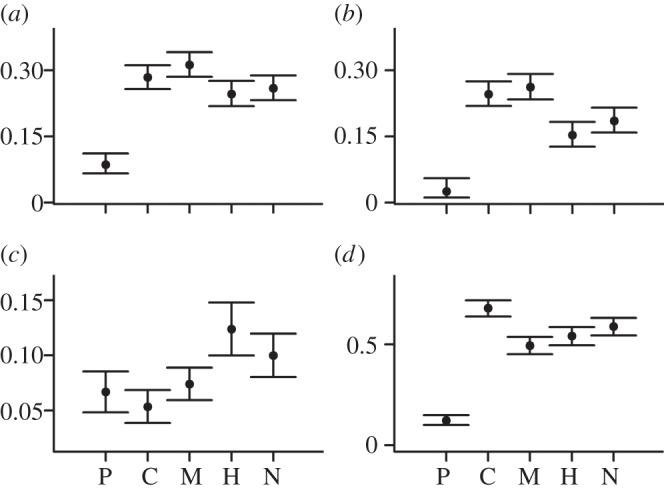
Comparisons among carnivoran groups. (a) Speciation probability, (b) extinction probability, (c) diversification rates and (d) sampling probability. These estimates are for all carnivoran species using the group effects model. P, C and M are the caniform groups Pinnipedimorpha, Canidae–Amphicyonidae–Ursidae and Musteloidea, respectively. H and N are the feliform groups Herpestidae–Hyaenidae–Eupleridae and Nimravidae–Felidae–Viverridae, respectively (see electronic supplementary material, figure S1). Vertical lines indicate 95% CIs.
Interval-to-interval sampling probability estimates hover around 50% across all carnivorans (figure 1). Sampling is generally higher for feliforms than caniforms (see electronic supplementary material, figure S2, and tables S2 and S3), especially in the later Miocene. Including Pinnipedimorpha adds uncertainty to estimates of carnivoran diversification; excluding pinnipedimorphs increases Caniformia and all-Carnivora sampling probabilities (see electronic supplementary material, figure S11, and tables S2 and S3), and subclade analyses demonstrate that sampling rates for pinnipedimorphs are markedly lower than any other group (figure 2). Although excluding pinnipedimorphs depresses the 13–12 Ma peak, the main features of the broader carnivoran pattern are still recovered (see electronic supplementary material, figure S11).
4. Discussion
The most striking feature of Neogene carnivoran diversification dynamics is its stability at large spatial and temporal scales. Although net per capita diversification rates are generally positive through the Neogene, indicating an expanding species richness (see electronic supplementary material, figure S14), they are low, with CIs encompassing zero for most time intervals (figure 1), potentially indicating a diversity-dependent diversification process for global carnivoran species richness [38–40]. This pattern also parallels observations that the body size distribution for Caniformia [25] and the morphology associated with carnivoran feeding ecology [41] were relatively stable through this same time period. However, substantial changes characterize the subclades comprising the larger, stable adaptive zone, indicating systems that were more dynamic at finer resolutions. Extant caniform species richness is higher than for the Feliformia [24], and in our fossil database, there are approximately twice as many caniform species (see electronic supplementary material, tables S3 and S4). Interestingly, we find that Caniformia has, on average, lower diversification rates through the 20 Myr study interval than does Feliformia (figure 2; electronic supplementary material, tables S3, S4 and S6). Additionally, rates of both speciation and extinction (and therefore turnover) are higher in Caniformia than Feliformia.
Despite the general stability in overall diversification rates, there were distinct rate changes: significantly positive diversification rate peaks at 13–12 Ma and at 4–3 Ma, and a significantly negative diversification rate following at 3–2 Ma (figure 1). During each of the two diversification peaks, more than 50% of the species then extant were new (see electronic supplementary material, figure S14). The diversification dip from 3 to 2 Ma was not as pronounced as the preceding peak. The first peak is associated with elevated speciation probability, whereas the 4–3 Ma peak is associated with decreased extinction probability (figure 1). The diversification dip is associated with both an increased extinction and reduction in speciation (figure 1).
These analyses recover patterns that are not detectable by analyses of extant taxa alone. A recent study of the entire Carnivora employing a supertree [36] reconstructed a sustained increase in diversification rates for Carnivora beginning at approximately 18 Ma, peaking at about 7.3 Ma and subsequently declining through the Late Miocene and Pliocene. However, excluding extinct taxa may hinder accurate reconstructions of diversification [3,42,43]. For example, more than 50 species in the extinct family Amphicyonidae are known between 22 and 2 Ma [44]. These extinct species cannot be included in the supertree analysis, which estimated rates of cladogenic events leading up to the extant subset of carnivorans [36]. By constrast, our estimates of diversification, speciation and extinction are not conditional on survival to the Recent. Interestingly, if the estimates of Nyakatura & Bininda-Emonds [36] are reflective of the diversity dynamics for the extant carnivorans, then the modern lineages experienced a substantial increase in branching rates during a period when total carnivoran diversification was rather nondescript (figure 1).
While we strongly advocate incorporating fossil data as an important source of information in estimating diversification rates, we acknowledge the potential limitations of palaeontological data. For instance, the Eupleridae, a species-poor clade endemic to Madagascar, lacks a fossil record. If euplerids were species-rich in the past and also possessed very different speciation and/or extinction rates, their absence would bias our mean rate estimates for Carnivora as a whole. Another limitation is that we do not have many of the traits available to neontologists to delimit species; therefore, fossil species have the potential to be both over- and under-split. Ideally, molecular phylogenetic approaches and modelling observed fossil ocurrences need to be integrated to make best use of data from both extant and extinct organisms [32,45].
With the Carnivora, we have the rare opportunity to study species-level dynamics in the fossil record, such that our inferences can be compared with those using extant species (see also [3]). We tested whether a genus-level analysis would reflect species-level patterns [46,47]: similar results were observed, although the patterns appear more muted [39,48]. This is encouraging, as palaeobiological analyses have tended to focus on genera as the analytical unit ([49] and references therein). However, we encourage the use of species-level data where possible, as this similarity in genus and species patterns may not be universal. Process and observation models, such as the Pradel model, estimate parameters of biological interest simultaneously with ‘observation’ parameters. As such, there are often a large number of estimated parameters, especially when interval-to-interval variation in parameters is modelled. This then requires large amounts of data, such that processes of interest (speciation, extinction) can be disentangled from potential confounding observation parameters (sampling). A consequence is that without a large number of sighting histories and/or successful sampling attempts, CIs around rate estimates will be large [50]. This in turn requires a large and well-sampled fossil record—something that is available for Carnivora, but certainly not for all groups.
An additional assumption of the method employed here is that all species (or at best species within Feliformia and Caniformia considered separately) in the dataset share a common preservation probability within each time interval. However, Wagner & Marcot [45] recently found that within-interval recovery rates for fossil mammals are best described by lognormal, not uniform, distributions, indicating this assumption is likely to be violated. One way to potentially include such details in this framework is to hypothesize factors that strongly contribute to species preservation/sampling and incorporate these factors as covariates in CMR models.
Yet despite these difficulties, our inferences are robust, demonstrating the utility of applying ecological models that explicitly incorporate sampling processes to information-rich palaeontological datasets, as well as the need to account for temporal variation in sampling [2,6,7,51]. Carnivoran diversity through the Neogene seems characterized by a gradual increase from 22 to 15 Ma, punctuated by a sudden increase in richness at 13–12 Ma, which is followed by approximately 10 Myr of stability before another rapid inflation at 4–3 Ma. Intriguingly, the first diversification peak follows the Miocene Climatic Optimum (approx. 17–14 Ma) [2,51], corresponding with broad global cooling, decreased taxonomic diversity of browsing ungulates and the rise of grazing ungulates [52,53]. Yet precise causal mechanisms remain open questions. Global diversification rates for Carnivora do not parallel the North American rodent record, which shows significantly negative diversification from 13 to 12 Ma at both continental [2] and regional scales [51], although those studies did not incorporate simultaneous estimation of sampling in their diversification estimates. If accurate, this points to substantial clade-specific differences in potential mechanisms. Moreover, the diversification peaks do not correlate with Neogene climatic excursions, such as the Miocene Climatic Optimum [51], making a straightforward argument for a causal climate–diversification relationship difficult for Carnivora. Indeed, such correlations (and hence causal associations) between mammal diversity and global climate have been questioned [8]. With our robust estimates, it is clear that new hypotheses of potential drivers must be formulated for both the transient increases in diversification rates and the conspicuous long-term stability of carnivoran species diversity.
Acknowledgements
We thank J. Laake, G. White, E. Cooch, C. Badgley and J. Flynn for discussions and advice. We greatly appreciate the constructive criticisms and insights from D. Rabosky, G. Slater, P. J. Wagner and one anonymous reviewer. We also thank the many authors of primary literature on Carnivora, as well as all who have contributed to the NOW database and PBDB. This is PBDB contribution no. 193.
Funding statement
We thank NESCent (Durham, NC, USA) for short-term visiting scholar funding to L.H.L.
References
- 1.Morlon H, Potts MD, Plotkin JB. 2010. Inferring the dynamics of diversification: a coalescent approach. PLoS Biol. 8, e1000493 (doi:10.1371/journal.pbio.1000493) [DOI] [PMC free article] [PubMed] [Google Scholar]
- 2.Finarelli JA, Badgley C. 2010. Diversity dynamics of Miocene mammals in relation to the history of tectonism and climate. Proc. R. Soc. B 277, 2721–2726 (doi:10.1098/rspb.2010.0348) [DOI] [PMC free article] [PubMed] [Google Scholar]
- 3.Ezard THG, Aze T, Pearson PN, Purvis A. 2011. Interplay between changing climate and species’ ecology drives macroevolutionary dynamics. Science 332, 349–351 (doi:10.1126/science.1203060) [DOI] [PubMed] [Google Scholar]
- 4.Condamine FL, Rolland J, Morlon H. 2013. Macroevolutionary perspectives to environmental change. Ecol. Lett. 16, 72–85 (doi:10.1111/ele.12062) [DOI] [PubMed] [Google Scholar]
- 5.Van Valen L. 1984. A resetting of Phanerozoic community evolution. Nature 307, 50–52 (doi:10.1038/307050a0) [Google Scholar]
- 6.Foote M. 2000. Origination and extinction components of taxonomic diversity: Paleozoic and post-Paleozoic dynamics. Paleobiology 26, 578–605 (doi:10.1666/0094-8373(2000)026<0578:oaecot>2.0.co;2) [Google Scholar]
- 7.Foote M. 2001. Inferring temporal patterns of preservation, origination, and extinction from taxonomic survivorship analysis. Paleobiology 27, 602–630 (doi:10.1666/0094-8373(2001)027<0602:ITPOPO>2.0.CO;2) [Google Scholar]
- 8.Alroy J, Koch PL, Zachos JC. 2000. Global climate change and North American mammalian evolution. Paleobiology 26, 259–288 (doi:10.1666/0094-8373(2000)26[259:GCCANA]2.0.CO;2) [Google Scholar]
- 9.Liow LH. 2013. Simultaneous estimation of occupancy and detection probabilities: an illustration using Cincinnatian brachiopods. Paleobiology 39, 193–213 (doi:10.1666/12009) [Google Scholar]
- 10.Foote M. 2000. Origination and extinction components of taxonomic diversity: general problems. In Deep time: paleobiology's perspective (eds Erwin DH, Wing SL.), pp. 74–102 Lawrence, KS: Allen Press. [Google Scholar]
- 11.Alroy J. 2008. Dynamics of origination and extinction in the marine fossil record. Proc. Natl Acad. Sci. USA 105(Suppl. 1), 11 536–11 542 (doi:10.1073/pnas.0802597105) [DOI] [PMC free article] [PubMed] [Google Scholar]
- 12.Marshall CR. 1997. Confidence intervals on stratigraphic ranges with nonrandom distributions of fossil horizons. Paleobiology 23, 165–173 [Google Scholar]
- 13.Marshall CR. 1990. Confidence intervals on stratigraphic ranges. Paleobiology 16, 1–10 [Google Scholar]
- 14.Wagner PJ. 2000. Likelihood tests of hypothesized durations: determining and accommodating biasing factors. Paleobiology 26, 431–449 (doi:10.1666/0094-8373(2000)026<0431:LTOHDD>2.0.CO;2) [Google Scholar]
- 15.Cormack RM. 1964. Estimates of survival from sightings of marked animals. Biometrika 51, 429–438 (doi:10.1093/biomet/51.3-4.429) [Google Scholar]
- 16.Jolly GM. 1965. Explicit estimates from capture–recapture data with both death and immigration-stochastic model. Biometrika 52, 225–247 (doi:10.1093/biomet/52.1-2.225) [PubMed] [Google Scholar]
- 17.Seber GAF. 1965. A note on the multiple-recapture census. Biometrika 52, 249–259 (doi:10.1093/biomet/52.1-2.249) [PubMed] [Google Scholar]
- 18.Leberton JD, Burnham KP, Clobert J, Anderson DR. 1992. Modeling survival and testing biological hypotheses using marked animals—a unified approach with case-studies. Ecol. Monogr. 62, 67–118 (doi:10.2307/2937171) [Google Scholar]
- 19.Pradel R. 1996. Utilization of capture–mark–recapture for the study of recruitment and population growth rate. Biometrics 52, 703–709 (doi:10.2307/2532908) [Google Scholar]
- 20.Liow LH, Nichols JD. 2010. Estimating rates and probabilities of origination and extinction using taxonomic occurrence data: capture–recapture approaches. In Short courses in paleontology: quantitative paleobiology (eds Hunt G, Alroy J.), pp. 81–94 New Haven, CT: Yale University Printing and Publishing [Google Scholar]
- 21.Connolly SR, Miller AI. 2001. Joint estimation of sampling and turnover rates from fossil databases: capture–mark–recapture methods revisited. Paleobiology 27, 751–767 (doi:10.1666/0094-8373(2001)027<0751:jeosat>2.0.co;2) [Google Scholar]
- 22.Connolly SR, Miller AI. 2001. Global Ordovician faunal transitions in the marine benthos: proximate causes. Paleobiology 27, 779–795 (doi:10.1666/0094-8373(2001)027<0779:GOFTIT>2.0.CO;2) [Google Scholar]
- 23.Connolly SR, Miller AI. 2002. Global Ordovician faunal transitions in the marine benthos: ultimate causes. Paleobiology 28, 26–40 (doi:10.1666/0094-8373(2002)028<0026:GOFTIT>2.0.CO;2) [Google Scholar]
- 24.Wozencraft WC. 2005. Order Carnivora. In Mammal species of the world: a taxonomic and geographic reference (eds Wilson DE, Reeder DM.), pp. 532–628 Baltimore, MD: Johns Hopkins University Press [Google Scholar]
- 25.Finarelli JA. 2008. Hierarchy and the reconstruction of evolutionary trends: evidence for constraints on the evolution of body size in terrestrial caniform carnivorans (Mammalia). Paleobiology 34, 553–562 (doi:10.1666/07078.1) [Google Scholar]
- 26.Finarelli JA, Flynn JJ. 2009. Brain size evolution and sociality in Carnivora. Proc. Natl Acad. Sci. USA 106, 9345–9349 (doi:10.1073/pnas.0901780106) [DOI] [PMC free article] [PubMed] [Google Scholar]
- 27.Flynn JJ, Finarelli JA, Zehr S, Hsu J, Nedbal MA. 2005. Molecular phylogeny of the Carnivora (Mammalia): assessing the impact of increased sampling on resolving enigmatic relationships. Syst. Biol. 54, 317–337 (doi:10.1080/10635150590923326) [DOI] [PubMed] [Google Scholar]
- 28.Gaubert P, Cordeiro-Estrela P. 2006. Phylogenetic systematics and tempo of evolution of the Viverrinae (Mammalia, Carnivora, Viverridae) within feliformians: implications for faunal exchanges between Asia and Africa. Mol. Phyl. Evol. 41, 266–278 (doi:10.1016/j.ympev.2006.05.034) [DOI] [PubMed] [Google Scholar]
- 29.Sato JJ, Wolsan M, Minami S, Hosoda T, Sinaga MH, Hiyama K, Yamaguchi Y, Suzuki H. 2009. Deciphering and dating the red panda's ancestry and early adaptive radiation of Musteloidea. Mol. Phyl. Evol. 53, 907–922 (doi:10.1016/j.ympev.2009.08.019) [DOI] [PubMed] [Google Scholar]
- 30.Goswami A. 2006. Morphological integration in the carnivoran skull. Evolution 60, 169–183 [PubMed] [Google Scholar]
- 31.Finarelli JA. 2007. Mechanisms behind active trends in body size evolution in the Canidae (Carnivora: Mammalia). Am. Nat. 170, 876–885 (doi:10.1086/522846) [DOI] [PubMed] [Google Scholar]
- 32.Slater GJ, Harmon LJ, Alfaro ME. 2012. Integrating fossils with molecular phylogenies improves inference of trait evolution. Evolution 66, 3931–3944 (doi:10.1111/j.1558-5646.2012.01723.x) [DOI] [PubMed] [Google Scholar]
- 33.Smaers JB, Dechmann DKN, Goswami A, Soligo C, Safi K. 2012. Comparative analyses of evolutionary rates reveal different pathways to encephalization in bats, carnivorans, and primates. Proc. Natl Acad. Sci. USA 109, 18 006–18 011 (doi:10.1073/pnas.1212181109) [DOI] [PMC free article] [PubMed] [Google Scholar]
- 34.Fortelius M. 2012. New and Old Worlds database of fossil mammals (NOW). Helsinki, Finland: University of Helsinki; See http://wwwhelsinkifi/science/now/ [Google Scholar]
- 35.Démére TA, Berta A, Adam PJ. 2003. Pinnipedimorph evolutionary biogeography. Bull. Am. Mus. Nat. Hist. 279, 32–76 (doi:10.1206/0003-0090(2003)279<0032:C>2.0.CO;2) [Google Scholar]
- 36.Nyakatura K, Bininda-Emonds ORP. 2012. Updating the evolutionary history of Carnivora (Mammalia): a new species-level supertree complete with divergence time estimates. BMC Biol. 10, 1–31 (doi:10.1186/1741-7007-10-12) [DOI] [PMC free article] [PubMed] [Google Scholar]
- 37.Gradstein FM, Ogg JG, Schmitz M, Ogg G. 2012. The geologic time scale. Oxford, UK: Elsevier [Google Scholar]
- 38.Etienne RS, Haegeman B, Stadler T, Aze T, Pearson PN, Purvis A, Phillimore AB. 2012. Diversity-dependence brings molecular phylogenies closer to agreement with the fossil record. Proc. R. Soc. B 279, 1300–1309 (doi:10.1098/rspb.2011.1439) [DOI] [PMC free article] [PubMed] [Google Scholar]
- 39.Wagner PJ. 1995. Diversity patterns among early gastropods: contrasting taxonomic and phylogenetic descriptions. Paleobiology 21, 410–439 [Google Scholar]
- 40.Miller AI, Sepkoski JJ. 1988. Modeling bivalve diversification—the effect of interaction on a macroevolutionary system. Paleobiology 14, 364–369 [DOI] [PubMed] [Google Scholar]
- 41.Wesley-Hunt GD. 2005. The morphological diversification of carnivores in North America. Paleobiology 31, 35–55 (doi:10.1666/0094-8373(2005)031<0035:TMDOCI>2.0.CO;2) [Google Scholar]
- 42.Liow LH, Quental TB, Marshall CR. 2010. When can decreasing diversification rates de detected with molecular phylogenies and the fossil record? Syst. Biol. 59, 646–659 (doi:10.1093/sysbio/syq052) [DOI] [PubMed] [Google Scholar]
- 43.Losos JB. 2011. Seeing the forest for the trees: the limitations of phylogenies in comparative biology. Am. Nat. 177, 709–727 (doi:10.1086/660020) [DOI] [PubMed] [Google Scholar]
- 44.Finarelli JA, Flynn JJ. 2006. Ancestral state reconstruction of body size in the Caniformia (Carnivora, Mammalia): the effects of incorporating data from the fossil record. Syst. Biol. 55, 301–313 (doi:10.1080/10635150500541698) [DOI] [PubMed] [Google Scholar]
- 45.Wagner PJ, Marcot JD. 2013. Modelling distributions of fossil sampling rates over time, space and taxa: assessment and implications for macroevolutionary studies. Methods Ecol. Evol. 4, 703–713 (doi:10.1111/2041-210x.12088) [Google Scholar]
- 46.Raup DM. 1979. Biases in the fossil record of species and genera. Bull. Carnegie Mus. Nat. Hist. 13, 85–91 [Google Scholar]
- 47.Sepkoski JJ., Jr 1997. Biodiversity: past, present, and future. J. Paleontol. 71, 533–539 [DOI] [PubMed] [Google Scholar]
- 48.Roy K, Valentine JW, Jablonski D, Kidwell SM. 1996. Scales of climatic variability and time averaging in Pleistocene biotas: implications for ecology and evolution. Trends Ecol. Evol. 11, 458–463 (doi:10.1016/0169-5347(96)10054-9) [DOI] [PubMed] [Google Scholar]
- 49.Jablonski D, Finarelli JA. 2009. Congruence of morphologically-defined genera with molecular phylogenies. Proc. Natl Acad. Sci. USA 106, 8262–8266 (doi:10.1073/pnas.0902973106) [DOI] [PMC free article] [PubMed] [Google Scholar]
- 50.Burnham KP, Anderson DR. 2002. Model selection and multimodel inference: a practical information-theoretic approach, 2nd edn, p. 488 New York, NY: Springer [Google Scholar]
- 51.Badgley C, Finarelli JA. 2013. Diversity dynamics of mammals in relation to tectonic and climatic history: comparison of three Neogene records from North America. Paleobiology 39, 373–399 (doi:10.1666/12024) [Google Scholar]
- 52.Janis CM, Damuth J, Theodor JM. 2000. Miocene ungulates and terrestrial primary productivity: where have all the browsers gone? Proc. Natl Acad. Sci. USA 97, 7899–7904 (doi:10.1073/pnas.97.14.7899) [DOI] [PMC free article] [PubMed] [Google Scholar]
- 53.Janis CM, Damuth J, Theodor JM. 2002. The origins and evolution of the North American grassland biome: the story from the hoofed mammals. Palaeogeogr. Palaeoclimatol. Palaeoecol. 177, 183–198 (doi:10.1016/S0031-0182(01)00359-5) [Google Scholar]