

Abstract
Deciphering the evolutionary processes driving nucleotide variation in multiallelic genes is limited by the number of genetic systems in which such genes occur. The complementary sex determiner (csd) gene in the honey bee Apis mellifera is an informative example for studying allelic diversity and the underlying evolutionary forces in a well-described model of balancing selection. Acting as the primary signal of sex determination, diploid individuals heterozygous for csd develop into females, whereas csd homozygotes are diploid males that have zero fitness. Examining 77 of the functional heterozygous csd allele pairs, we established a combinatorical criteria that provide insights into the minimum number of amino acid differences among those pairs. Given a data set of 244 csd sequences, we show that the total number of csd alleles found in A. mellifera ranges from 53 (locally) to 87 (worldwide), which is much higher than was previously reported (20). Using a coupon-collector model, we extrapolate the presence of in total 116–145 csd alleles worldwide. The hypervariable region (HVR) is of particular importance in determining csd allele specificity, and we provide for this region evidence of high evolutionary rate for length differences exceeding those of microsatellites. The proportion of amino acids driven by positive selection and the rate of nonsynonymous substitutions in the HVR-flanking regions reach values close to 1 but differ with respect to the HVR length. Using a model of csd coalescence, we identified the high originating rate of csd specificities as a major evolutionary force, leading to an origin of a novel csd allele every 400,000 years. The csd polymorphism frequencies in natural populations indicate an excess of new mutations, whereas signs of ancestral transspecies polymorphism can still be detected. This study provides a comprehensive view of the enormous diversity and the evolutionary forces shaping a multiallelic gene.
Keywords: adaptive evolution, nucleotide polymorphism, molecular evolution, balancing selection
Introduction
In various organisms, different genetic systems that are characterized by a large number of alleles produced by a single gene (multiallelic genes) exist. Examples of such systems are the self-incompatibility locus in plants (S locus) (Wright 1939; Nasrallah 1997), the major histocompatibility (MHC) system in vertebrates (Takahata and Nei 1990; Takahata et al. 1992; Klein et al. 1993), and the mating-type genes in fungi (May et al. 1999). For all these systems, various forms of balancing selection, such as negative frequency-dependent (S-locus) and overdominant (MHC-complex) selection, maintain a high number of alleles in populations far longer than neutral variants (Charlesworth 2006). In the haplodiploid system of sex determination in Hymenopteran species, the complementary sex determiner (csd) gene of honey bees (genus Apis) is an informative example for the study of the molecular evolution of a multiallelic gene under a well-described model of negative frequency-dependent selection (Hasselmann and Beye 2004). Acting as the initial signal of sex determination in the honey bee Apis mellifera, csd-heterozygous individuals develop into females, whereas homozygous individuals (diploid males) are nonviable (Mackensen 1951; Beye et al. 2003). Individuals with a hemizygous copy of csd (haploid, unfertilized eggs) are males. The strong selection against homozygotes at the csd locus results in a rare allele advantage or negative frequency-dependent (balancing) selection.
This strong advantage of heterozygotes at the csd locus has led to the expectation of a high number of distinct csd alleles at selection mutation drift equilibrium in honey bee populations (Yokoyama and Nei 1979). As expected, those alleles are seldom lost by the effect of genetic drift and persist much longer in populations than neutral alleles. Several csd alleles have been identified in previous studies of honey bees with pronounced high nucleotide differences (Hasselmann and Beye 2004; Hasselmann et al. 2008, 2010). Nucleotide polymorphisms accumulate within a confined part of the csd gene, characterized as a potential specifying domain (PSD) and indicating the target of balancing selection (Hasselmann et al. 2008). The PSD region includes a hypervariable region (HVR), consisting of a variable number of repeats mainly containing asparagine- and tyrosine-rich motifs (denoted in the following as the repetitive region). Because of the ambiguous relationships of these sites, this region has been excluded in previous analyses, although its contribution to the determination of csd allelic specificity has been proposed (Gempe and Beye 2011). Thus far, very little emphasis has been placed on the range of sequence variability in the HVR and its possible genetic association to the adjacent genomic regions. One hypothesis is that the HVR is fast evolving and contributes to a higher originating rate of new alleles than was previously calculated. In addition to HVR, there is an arginine–serine-rich (RS) domain and a proline-enriched region in the PSD that are likely involved in protein–protein interactions (Beye et al. 2003).
A previous analysis of the csd PSD genealogy of three Apis species identified no transspecific alleles (Hasselmann et al. 2008), which contrasts remarkably with other loci that evolve under the regime of balancing selection, such as the S locus in plants and the MHC complex. Strong genetic drift in honey bee populations that results in a relatively short maintenance time of csd alleles has been proposed as the most plausible explanation for the lack of transspecific alleles. However, it should be noted that rare events of intragenic recombination that affect the distribution of allelic lineages within the csd genealogy and remove potential transspecies alleles cannot be excluded during the course of long-term evolution of csd alleles (Charlesworth 2008). In previous studies, estimations of a rather moderate originating rate (u) of new csd specificities (u = 5 × 10⁻⁷ – 2 × 10⁻⁸ per year) with an effective population size of Ne < 104 identified genetic drift as the primary factor for a high csd allelic turnover rate in honey bees (Hasselmann et al. 2008).
In this study, we aimed to deduce from the nucleotide variation found in csd sequences a common criteria to generate allelic specificities. In particular, we examined the critical parameters needed to establish a functional heterozygous csd allele different from another existing csd sequence. Consequently, we shed light on the long-standing question of how many sex-determining alleles exist in honey bee populations, which has been reported to range from 11 to 20 alleles (Adams et al. 1977; Hasselmann et al. 2008). The combination of population genetic data and data from functional csd specificities provides new insights into the evolutionary flexibility and the dynamics of csd alleles in honey bee populations. By obtaining csd polymorphism data from populations of feral honey bees, we gained a better understanding of the evolutionary processes driving the variability of csd alleles. When studying the population dynamics of csd alleles in honey bees, one is faced with the history of enormous anthropogenic influence (bee management) in many parts of the world. As detailed herein, we circumvented this problem by sampling csd sequences from localities in Kenya (East Africa), where the anthropogenic influence is negligibly low.
Our study contributes to a better understanding of the evolutionary processes that occur in multiallelic genes under negative frequency-dependent selection. We present a statistical analysis of criteria that serve to determine functional heterozygous combinations of csd alleles, infer the number of functionally independent csd alleles, and use a coupon-collector model to calculate the number of csd alleles that exist for A. mellifera populations. Finally, we establish a high rate of adaptive mutations as an important process for the generation of new csd specificities within short evolutionary times. By providing, for the first time, detailed insights into the evolutionary processes driving the diversity of HVR, we elucidate the evolutionary flexibility of a primary signal in a fundamental biological pathway.
Results
Criteria for Determining Functional Heterozygosity of csd Alleles
We evaluated 77 pairs of functional heterozygous combinations of csd alleles that were obtained from drones of separate colonies (representing 33 pairs of queen csd alleles, as each drone can receive one or the other csd allele from the queen) and by isolating both csd alleles represented in single female worker bees from Kenyan colonies (44 pairs of csd alleles). We focused on the csd region spanning exons 6–8 and harboring the PSD in exons 6 and 7, which includes the HVR (fig. 1A). We deduced the amino acid sequences and evaluated the length and amino acid differences of the HVR for each of the 77 csd pairs. The HVR is flanked by a conserved (SL)S-motif upstream and an IEQIP-motif downstream (marked with asterisks, fig. 1B) and consists of repeated asparagine (N) and tyrosine (Y) motifs following, in general, the order of N1–5 Y, plus some additional motifs (TIH, KY, SY, KK) (dotted line, fig. 1B). Representative pairs of the csd HVR are shown in figure 1B (an overview of all pairs is given in supplementary table S3, Supplementary Material online). The analysis of the data of these 77 csd pairs made it obvious that the repeated motifs within the HVR for each pair differed in length and number of amino acids. We noticed that the minimum number of length differences in the repetitive part of the HVR was one amino acid (e.g., pair 2–2/2–5) and the maximum was 20 amino acid residues (pair N37-I-2/N37-I-3). When the differences in length between a csd–allele pair in the HVR relied only on one amino acid (found in 5 out of 77 pairs), the number of amino acid differences between two csd alleles ranged from 6 (pair 2–2/2–5) to 10 (e.g., pair H1–1/H1–2) residues. Only 1 out of 77 csd pairs was identified (K4/K5) as carrying a repetitive part of the same length (comprising nine amino acid differences), whereas K5 was characterized by an additional asparagine triplet (NNN-) preceding the conserved SLS motif (fig. 1B).
Fig. 1.

Genomic structure of the csd gene in A. mellifera, domain diagram, and conceptual translation of the HVR for pairs of functional heterozygous csd alleles. (A) Coding exons are marked in black; untranslated regions are in white. Translational start and stop sites are indicated. Below, the detailed view of exons 6, 7, and 8 is given. The RS-rich domain (red), the HVR (green), the proline-rich (P) domain (blue), and the PSD are shown. (B) Conceptual translation of the HVR and a portion of the adjacent regions for seven pairs of functional heterozygotus csd alleles. The repetitive region within the HVR and highly conserved amino acid residues flanking the HVR (marked with asterisks) are indicated.
Next, we examined the hypothesis that beside the differences in the HVR, additional amino acid residues in the PSD adjacent to the HVR contribute to the determination of csd–allele specificity (Hasselmann et al. 2008). To evaluate this hypothesis, we calculated the number of amino acid replacements within the PSD-corresponding region for each of the 77 csd–allele pairs (supplementary table S3, Supplementary Material online). One amino acid replacement within the PSD was the minimum found (allele pairs 1–2/1–3 and NO1-II-1/NO1-II-2). Interestingly, both pairs are characterized by substantial length differences between the repeated motifs and additional amino acid differences within the HVR. A maximum of 11 amino acid replacements within the PSD was observed (e.g., allele pair 10–1/10–2). We noticed that a substantial number of amino acid substitutions also occurred in exon 8, the proline-rich region. In the case of only one amino acid difference in the PSD (pairs 1–2/1–3 and NO1-II-1/NO1-II-2), the number of amino acid substitutions in exon 8 was 3 and 4, respectively. By contrast, within pair B72–4/B72–5, no amino acid substitutions were found in exon 8, whereas three residue differences accumulated in the PSD region.
To empirically evaluate our findings, we assume that the equivalence between csd alleles depends on three quantities: the total number of amino acid differences in the HVR region including indels and differences in length (dHVR) and the number of amino acid mismatches in the PSD region (dPSD) and exon 8 (de8). We are interested in how large these differences should be to cause functionally different alleles. If the criterion for functionally different alleles would be a combination of independent criteria for dHVR, dPSD, and de8, then the equilibrium distribution of allele differences would be reduced to a factorized form:
| (1.1) |
This form implies that the covariances between dHVR, dPSD, and de8 across the 77 functional pairs of sequences should vanish. In fact, Pearson correlation between dHVR and dPSD is small and not significant (r = 0.09, P = 0.42) and similar for dHVR and de8 (r = 0.08, P = 0.5). This shows that the criterion for dHVR is independent of the other differences. The distribution of the values of dHVR is roughly constant between 6 and 21, suggesting the criterion
| (1.2) |
which is in agreement to our findings mentioned earlier. Furthermore, comparing the distribution of dHVR with the distribution of length differences or amino acid mismatches in the HVR (fig. 2A), it is apparent that the former is clearly flatter and has a neater decay in the lower tail than the others. This reinforces the idea that among HVR variables, dHVR is the main discriminator for functionally different alleles. On the other hand, the correlation between dPSD and de8 is negative (r = −0.28) and significant (P = 0.015). This means that there is a mixed criterion for dPSD and de8. A reasonable way to obtain it is represented by the convex envelope of the set of values of dPSD, de8 for the 77 sequences (fig. 2B). This envelope is given by dPSD ≥ 1, 3dPSD+2de8 ≥ 9, and in practice it is almost equivalent to the simpler criterion used in the previous approach dPSD ≥ 1, dPSD+de8 ≥ 4 (the only exception is the value dPSD = 3, de8 = 0).
Fig. 2.

Histograms of differences in the HVR and plot of pairwise amino acid mismatches in the flanking regions. (A) Top: histogram of the total number of differences in the HVR within the 77 pairs of heterozygous functional alleles, including amino acid mismatches and indels. Middle: histogram of the number of amino acid mismatches in the HVR within the 77 pairs. Bottom: histogram of the differences in length in the HVR within the 77 pairs. (B) Scatterplot of the amino acid mismatches in the PSD region versus mismatches in exon 8. The curves represent possible conditions for functional heterozygotes: the convex envelope of the data (blue line), the simple criterion proposed in this paper (green line), and a strict criterion assuming that 5% of the sequenced individuals are actually nonfunctional (red line).
The 77 independent pairs of csd alleles cover a broad range of amino acid differences and combinations. Therefore, our established criteria may serve as an approximation for distinguishing a functionally different csd allele from a csd sequence encoding the same allelic specificity.
The Number of csd Alleles and the Range of Sequence Variability of the HVR and Its Flanking Region
Next, we enriched our data set by using a more comprehensive sample of csd sequences to gain insights into 1) the number of csd alleles encoding heterozygosity when the above criteria are applied and 2) the range of sequence variability of HVR. In addition to the 154 alleles (77 pairs) used before, we included csd sequences that we obtained from our drone- and worker-screening assay and from previous studies (see the Materials and Methods). In total, 244 csd sequences were subjected to further analysis.
In this large data set, we expected to identify, by chance, csd sequences that were sampled in different geographic regions but that contained identical nucleotide sequences (identical in the HVR and adjacent regions). This could be most likely due to anthropogenic influence (e.g., import of bees from Europe to the America or vice versa, or from South Africa to Brazil) or due to random migration (within Kenya).
We present estimates of the number of functionally heterozygous csd alleles among our set of 244 sequences by removing functionally equivalent alleles stepwise. At each step, an allele is chosen among the ones with the highest number of functionally equivalent alleles and removed, and then the procedure is repeated until all remaining alleles are functionally different. With the first criteria being developed (dHVR ≥ 6, dPSD ≥ 1, dPSD+de8 ≥ 4), we find that there are at least 87 functionally different alleles. With the more relaxed criterion based on the convex envelope (dHVR ≥ 6, dPSD ≥ 1, 3dPSD+2de8 ≥ 9), we find the same number of alleles. Even with quite stringent criteria for functional equivalence (dHVR ≥ 6, dPSD ≥ 2, de8 ≥ 1, and dPSD+2de8 ≥ 5), which assume that about 5% of the 77 heterozygote pairs are actually nonfunctional, we still get at least 61 functionally different alleles. More relaxed criteria, which takes into account the possibility that some csd–allele combinations that we did not sample exist, would result in an even larger number of alleles.
A relevant question is: how many new, functionally different alleles could be found by sampling more csd sequences? And how large is the total number of functionally distinct alleles in natural populations? We attempt to answer these questions by subsampling randomly our data set and extrapolating the results to higher number of samples using a coupon-collector model (von Schelling 1954). This model relies on approximating the sampling process as a collection of randomly picked coupons of different types, each type appearing with different frequency and containing a different set of equiprobable coupons. If we denote the total number of sampled coupons as ns, the number of different coupons of type i by ni and the probability of extracting a coupon of type i by fi, we have this approximate expression for the mean na as the total number of different coupons/alleles collected:
| (1.3) |
The extrapolation assumes that future samplings will have biases (geographic, etc) similar to the current ones. We generate 100 random extractions of subsets of a given size ns from our 244 sequences, and we obtain the average number of functionally different alleles na. We use the criterion of the main text dHVR ≥ 6, dPSD ≥ 1, dPSD+de8 ≥ 4. We fit the prediction of coupon-collector models with 1, 2, 3, 4, 5, and 6 types of coupons. Results are shown in figure 3. The model with 2 types of coupons give a good fit and a prediction of a total number of nt = 116.5 alleles worldwide. The fit is slightly better with 3 types of coupons, in which case the prediction for the worldwide number of alleles is nt = 143.7 (fig. 3A). Fits with 4, 5, and 6 types have a similar goodness of fit and nt in the range 143–145. Therefore, our analysis suggests that there are between 116 and 145 functionally different alleles worldwide (fig. 3B). A very conservative estimate using the stricter criteria dHVR ≥ 6, dPSD ≥ 2, de8 ≥ 1, dPSD+de8 ≥ 5 predicts at least 76–79 alleles worldwide.
Fig. 3.
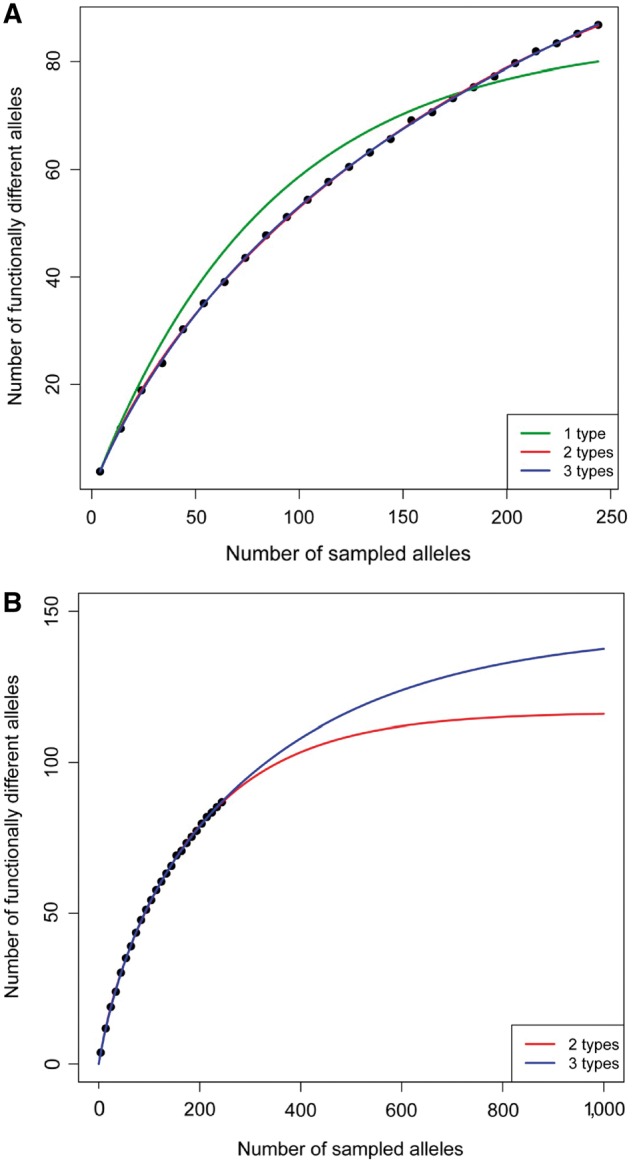
Plot of the mean number of functionally different alleles as a function of the total number of sampled alleles. Each point corresponds to the average of 100 random subsampling processes. (A) The curves correspond to the best fits of coupon-collector models with 1 type of coupons (green), 2 types of coupons (red), and 3 types of coupons (blue). The fits with 2 and 3 types are very similar, and the fits for 4, 5, and 6 types of coupons are indistinguishable from the fit with 3 types. (B) The curves correspond to the best fits of coupon-collector models with 2 (red) and 3 types of coupons (blue).
Our study on heterozygous allelic csd pairs revealed the particular importance of the HVR-encoding differences among the alleles of csd. Consequently, we investigated the sequence variability that evolves within in the HVR and its possible effect on the evolutionary rate in the flanking regions. First, we focused on the range of sequence variability of the repetitive region and noticed that the total length of this region varied from 6 to 33 residues (fig. 4A). Next, we observed that the repeated motifs of the HVR can substantially vary and evolve via duplications, insertions, or deletions (fig. 4B, underlined residues) of single motifs. These patterns are known to occur in other elements with repetitive structures, such as microsatellites (Ellegren 2004). Thus, we more closely examined the hypothesis that the HVR is fast evolving in the data set of nonidentical csd sequences (n = 178). We identified recently diverged csd sequences from their low synonymous divergence. We calculated synonymous diversity per corresponding site (πs) in the regions flanking the HVR among all csd–sequence pairs and defined the most recently diverged csd sequences by πs = 0–0.004. Numerous recently diverged sequences were identified, which varied substantially in the HVR in amino acid length and differences (fig. 4B), indicating that this region is much faster evolving than the flanking regions. These changes were restricted to single amino-acid changes and/or insertions (e.g., D, N) or repeated motifs (e.g., KNYNNY), never single nucleotide deletions or repeats that would result in a frameshift.
Fig. 4.

Variation in length and amino acid differences of the HVR. (A) Maximal length variation of the repetitive region (dotted line) within the HVR was detected in the data set. The number of amino acid residues may range from 6 (csd sequence N87-I-1) to 33 (cB1_4). (B) Amino acid variation within the HVR in five sets of csd sequences with otherwise identical flanking regions (nucleotide diversity π = 0 for PSD and exon 8).
As a second approach to analyze the putative associations of the repetitive region with its adjacent regions, we measured two evolutionary parameters, α and ω, in the latter regions. The proportion of amino acids driven by positive selection (α) and the rate of adaptive nonsynonymous substitutions relative to the rate of synonymous ones (ωa) provided insights into the strength and evolutionary rate of the positive selection within the corresponding part of the csd protein (see the Materials and Methods, calculation at zero and 4-fold degenerated sites). One hypothesis is that nucleotide changes are linked to the length variation of the repetitive region, which might hint at a certain length optimal for proper gene function. Under this scenario, one would assume that the strength of positive selection acting on csd alleles might vary depending on the existing length of the repetitive region.
To test this assumption, we first classified the 87 csd alleles into six groups of distinct lengths of the repetitive region (6–12, 13–16, 17–20, 21–23, 24–26, and 27–33 amino acids). When calculated across the entire data set, we obtained an α = 0.93 and ωa = 11.2 within the region of the PSD region and exon 8 (table 1). The calculation of α and ωa for each group separately for PSD and exon 8 revealed that the groups carrying the extremes of the repeated motif show substantially larger values of ωa than those carrying intermediate numbers of repeats (ωa = 11.5 – 251.8 for groups 1, 2, 5, and XL vs. ωa = 4.3 and 10.7 for groups 2 and 3, P < 0.05) (fig. 5). More moderate differences following the same tendency for ωa were found for α (α = 0.942–0.995 for groups 1, 2, 5, and XL vs. α = 0.883 and 0.928 for groups 2 and 3). When calculated for the PSD and exon 8 separately, for PSD α and ωa, the smallest values were again found for the groups with an intermediate length repetitive region, whereas α became maximal in exon 8 (α = 1), and ωa was not calculable due to no net substitutions at the 4-fold-degenerated sites (supplementary table S4, Supplementary Material online). Combined, these results suggest that the strength and evolutionary rate of positive selection substantially vary among the csd alleles and appear to be strongest in csd alleles that are characterized by long (≥24 aa) and short (≤16 aa) repetitive regions.
Table 1.
Values of α and ωa in csd-Allelic Regions and Underlying Nucleotide Divergence and Nucleotide Diversity.
| d0 | d4 | π0 | π4 | α | ωa | |
|---|---|---|---|---|---|---|
| PSD and exon 8 | 0.084 | 0.007 | 0.054 | 0.067 | 0.93 | 11.19 |
| PSD | 0.081 | 0.011 | 0.065 | 0.105 | 0.92 | 6.74 |
| Exon 8 | 0.088 | 0 | 0.039 | 0.023 | 1 | n.c. |
Note.—The proportion of amino acid substitutions driven by positive selection (α) and the rate of nonsynonymous substitutions relative to the rate of synonymous substitutions (ωa) were calculated using nucleotide divergence (to two csd alleles of A. cerana) and nucleotide diversity (within 87 csd alleles of A. mellifera) on 0- and 4-fold degenerated sites. n.c.: not calculable. See also the Materials and Methods.
Fig. 5.
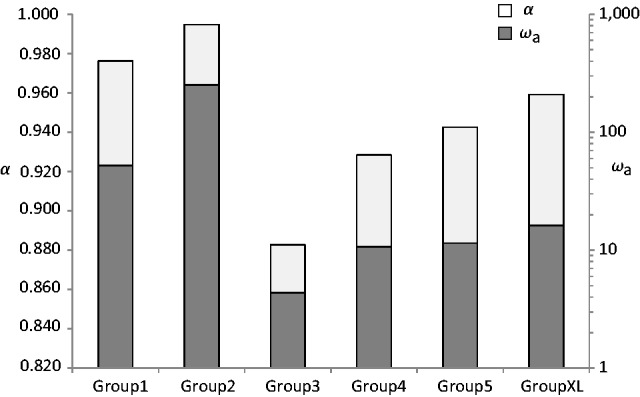
Diagram showing α, the proportion of amino acid substitutions driven by positive selection (white bars, left scale) and ωa, the rate of adaptive nonsynonymous substitutions, relative to the rate of synonymous substitutions (gray bars, right scale) calculated in the flanking region of the HVR for groups of csd alleles harboring different length of the repetitive region. In total, 87 csd alleles were grouped into seven sets that contained csd alleles with an amino acid repeat length ranging 6–12 (group 1, n = 13), 13–16 (group 2, n = 15), 17–20 (group 3, n = 22), 21–23 (group 4, n = 14), 24–26 (group 5, n = 11), and 27–33 (group XL, n = 12).
As an approximation to quantify the evolutionary changes that occur within the HVR, we developed a factor (Ferd) that represents the differences of the repetitive region within the HVR compared with those of microsatellites (see the Materials and Methods, eqs. 1 and 2). We focused on the variance of the deviation from the mean allelic fragment length, which was obtained for eight microsatellites and the SLEb locus spanning the HVR. When calculated for each microsatellite, the value of the factor ranged from 1.7 to 3.4 for loci A43 and A24, respectively, indicating that the HVR clearly evolves with a higher rate when compared with microsatellites (table 3). On average, the evolutionary rate within the HVR relative to microsatellites is about 2.4 faster, providing the first quantitative evidence for a major contribution of the HVR to csd-allelic variability within a short evolutionary time.
Table 3.
Calculation of the Factor of Evolutionary Rate Difference (Ferd) of the Repetitive Regions within the HVR Relative to Microsatellites.
| SLEb | A007 | A079 | A28 | A88 | A113 | B124 | A43 | A24 | |
|---|---|---|---|---|---|---|---|---|---|
| Mean | 166.77 | 101.21 | 101.909 | 135.628 | 142.890 | 214.582 | 228.845 | 135.117 | 96.06 |
| Variance of the deviation from mean values | 15.44 | 5.33 | 8.723 | 5.09 | 5.61 | 6.06 | 7.90 | 8.84 | 4.49 |
| Factor (Ferd) | 2.4 | 2.99 | 1.77 | 3.03 | 2.75 | 2.55 | 1.95 | 1.75 | 3.44 |
Locus SLEb represents the HVR, loci A007, A079, A28, A88, A113, B124, A43, and A24 represent unlinked microsatellite loci. The variances from the deviation from mean values were calculated for each loci based on fragment lengths of 56 diploid females A. mellifera using equation (1) (see Materials and Methods), whereas the factor (Ferd) is given by the ratio of SLEb to microsatellites (eq. 2) and its average underlined.
The Number and Dynamics of csd Alleles in Local Honey Bee Populations
We focused on a geographic region with a negligibly low anthropogenic effect on the bee colonies to calculate not only the number of csd alleles that can be maintained within a local region but also to gain deeper insight into the evolutionary processes that affects their population dynamics the most. We obtained 60 female individuals collected in three East African localities (Mt. Kenya, Nyambene Hills, Mau) from 30 colonies. From those individuals, we obtained a total of 107 csd sequences. The basic summary statistic parameters were determined separately for the coding region, the PSD, exon 8, and introns. The data set was analyzed as one single sample (Kenya) as well as three separate geographic regions (Mt. Kenya, Nyambene Hills, Mau) (table 2). As expected, the number of segregating sites and synonymous nucleotide diversity (πs) was highest in the PSD as previously identified, a sign of balancing selection within the csd alleles (Hasselmann et al. 2008). Interestingly, the πn/πs ratio calculated for exon 8 was greater than 1 (range 1.04–1.88), which might indicate a higher number of nonsynonymous changes or some background noise. The frequency spectrum of segregating sites reveals an excess of low-frequency polymorphisms (supplementary fig. S1, Supplementary Material online), which is also reflected by the negative values of Tajima’s D statistic. Under balancing selection, positive values of this test statistic would be expected. One hypothesis is that the continuous rise and accumulation of single mutations in csd sequences leads to a gradual shift from functionally identical to functionally nonidentical csd specificities that might hide the signs of balancing selection (see later).
Table 2.
Summary Statistics of A. mellifera csd Sequences.
| Locality | Region | n | Sites | h | S | Hd | πtotal | πS | πn | πn/πs | ΘW | Tajima's D | Tajima' Ds | Tajima's Dn | Fay and Wu's H |
|---|---|---|---|---|---|---|---|---|---|---|---|---|---|---|---|
| Kenya | Total | 107 | 309 | 86 | 138 | 0.993 | 0.052 ± 0.0013 | 0.063 | 0.050 | 0.79 | 0.085 | −1.45 | −1.16 | −1.40 | −13.43 |
| PSD | 107 | 177 | 80 | 87 | 0.990 | 0.068 ± 0.0016 | 0.091 | 0.061 | 0.67 | 0.094 | −1.17 | −0.71 | −1.17 | −8.16 | |
| Exon 8 | 107 | 126 | 61 | 50 | 0.974 | 0.0318 ± 0.0017 | 0.025 | 0.034 | 1.37 | 0.076 | −1.86* | −1.82* | −1.52 | −5.30 | |
| Intron | 107 | 124 | 71 | 47 | 0.986 | 0.037 ± 0.002 | — | — | — | 0.072 | −1.73 | — | — | — | |
| Mt. Kenya | Total | 36 | 333 | 31 | 85 | 0.990 | 0.051 ± 0.002 | 0.057 | 0.049 | 0.86 | 0.062 | −0.94 | 0.16 | −1.11 | −10.75 |
| PSD | 36 | 198 | 30 | 54 | 0.989 | 0.063 ± 0.002 | 0.078 | 0.059 | 0.75 | 0.066 | 0.49 | 0.68 | −0.71 | −5.60 | |
| Exon 8 | 36 | 135 | 26 | 31 | 0.973 | 0.033 ± 0.003 | 0.026 | 0.036 | 1.37 | 0.055 | −1.59 | −1.14 | −1.57 | −5.15 | |
| Intron | 36 | 125 | 28 | 29 | 0.984 | 0.038 ± 0.002 | — | — | — | 0.056 | −1.15 | — | — | — | |
| Nyambene Hills | Total | 37 | 315 | 33 | 92 | 0.992 | 0.056 ± 0.002 | 0.067 | 0.052 | 0.78 | 0.070 | −0.88 | −0.95 | −0.92 | −8.20 |
| PSD | 37 | 186 | 32 | 63 | 0.991 | 0.071 ± 0.002 | 0.089 | 0.065 | 0.73 | 0.081 | −1.07 | −0.98 | −0.94 | −5.34 | |
| Exon 8 | 37 | 129 | 28 | 29 | 0.976 | 0.034 ± 0.003 | 0.036 | 0.034 | 0.97 | 0.054 | −1.31 | −1.50 | −1.07 | −2.87 | |
| Intron | 37 | 124 | 30 | 29 | 0.098 | 0.034 ± 0.003 | — | — | — | 0.054 | — | — | — | — | |
| Mau | Total | 34 | 312 | 27 | 77 | 0.980 | 0.045 ± 0.002 | 0.056 | 0.042 | 0.75 | 0.060 | −1.16 | −1.08 | −1.07 | −6.14 |
| PSD | 34 | 180 | 26 | 49 | 0.973 | 0.058 ± 0.003 | 0.083 | 0.050 | 0.60 | 0.067 | −0.75 | −0.41 | −0.79 | −3.91 | |
| Exon 8 | 34 | 132 | 23 | 28 | 0.955 | 0.027 ± 0.003 | 0.020 | 0.031 | 1.54 | 0.052 | −1.68 | −1.81** | −1.35 | −2.23 | |
| Intron | 34 | 124 | 26 | 30 | 0.980 | 0.039 ± 0.003 | — | — | — | 0.058 | −1.33 | — | — | — |
Note.—Calculations were performed treating the data as one (Kenya) and three separate populations according to geographic region. Parameters are abbreviated as follows: Sequence number (N); haplotype diversity (Hd); number of nucleotides (n); number of segregating sites (S); average pairwise nucleotide diversity (π) for all (total), synonymous (s), and nonsynonymous (n) sites; Watterson’s theta (ΘW); Tajima’s D (calculated for all [D], synonymous [Ds] and nonsynonymous [Dn] sites); Fay and Wu’s H (H) statistic. PSD: Potential specifying domain. Intron sequences are from the csd region of exons 6–9. — : not calculable.
*P < 0.05.
To evaluate the local number of csd alleles within the Kenyan regions, we applied the same principle as described in the previous section. When these criteria were applied to the entire data set of Kenyan csd sequences, we had 53 unique functional csd alleles remaining. For the three local regions, the Mt. Kenya region had 24 alleles, the Nyambene Hills had 28 alleles, and the Mau region had 23 unique csd alleles out of 36, 37, and 34 csd sequences, respectively. Extrapolation using the coupon-collector model leads to 96 csd alleles in the Kenyan region (supplementary fig. S2, Supplementary Material online). We followed the genealogical relationship of these 53 csd alleles using the maximum likelihood method based on the genetic distances of the deduced amino acids (fig. 6A) and compared them with the one obtained for synonymous divergence (fig. 6B). We noted that 1) the genealogy based on amino acid distances forms two basal major lineages and that 2) between several alleles, numerous amino acid differences but no synonymous differences have been accumulated (indicated by arrows in fig. 6). After a closer examination, we identified two amino acid motifs (RE and NS) that were unique to the two basal branches.
Fig. 6.

Genealogy of 57 Kenyan csd alleles obtained using the maximum likelihood algorithm. (A) Genealogy based on amino acid divergence, using the Jones–Taylor–Thornton model. (B) Genealogy based on divergence on synonymous sites, using the Pamilo–Bianchi model. Arrows indicate very recently diverged csd alleles harboring no synonymous but numerous amino acid substitutions.
The observation that recently diverged alleles already accumulated a remarkable number of amino acid differences led us to question the evolutionary time required for new csd specificities to arise. We considered a new estimation of the neutral mutation rate based on new data of Apis divergence (Ramirez et al. 2010) and divergence at synonymous sites of four genes of A. mellifera, A. cerana, and A. dorsata (see the Materials and Methods). As a result, we calculated an average neutral substitutions rate of µ = 2.16 × 10⁻⁹ substitutions/site/year, which is somewhat lower than what was previously calculated (µ = 7 × 10⁻⁹) (Hasselmann et al. 2008). For the most recently diverged csd alleles, we take synonymous diversity per site as a neutral estimate (represented by πs = 0.004). Taking πs = 4Nµ as a model of neutral evolution with the corresponding values and one generation per year for honey bees, we calculated N = 5 × 10⁵ or generations to accumulate these differences. Under this model, we would expect to find one nonsynonymous change for the PSD region/exon 8 (µ × the number of nonsynonymous sites [233]). Interestingly, the corresponding πn values for these recently diverged csd alleles ranged from πn = 0.026 to 0.07, which corresponds to 6–15 amino acid substitutions. On the basis of these data, we denoted an originating rate of csd alleles per locus per year (u) that ranges from u = 1.1 × 10⁻⁵ to 9 × 10⁻⁶, which is two orders of magnitudes higher than previously calculated. As we assume that four amino acid differences within the PSD region/exon 8 can define a new csd specificity, our result would imply that approximately every 370,000–410,000 years a novel csd specificity can arise.
Applying the theoretical model of csd coalescence previously developed (Hasselmann et al. 2008), we calculated the long-term effective population size (N) and pairwise average coalescence time (Td) for the number of alleles we found (supplementary fig. S2, Supplementary Material online). Taking the originating rate of a new csd specificity of 1.1 × 10⁻⁵ to 9 × 10⁻⁶ and the number of csd alleles calculated in this study (n = 53 locally, n = 87 worldwide) into account, the long-term effective population sizes (N) range from 12,000 to 34,000. The pairwise average coalescence time (Td) of the csd alleles ranges from 120,000 to 300,000 years, which is remarkably shorter than previous calculations.
Hidden Signals of Single Ancestral-Balanced Polymorphism
We would expect that because of the high allelic turnover of csd alleles, the signal of ancestral balanced polymorphism might be hidden. Indeed, in previous studies, no transspecific alleles among csd sequences from three Apis species (A. mellifera, A. cerana, and A. dorsata) (Hasselmann et al. 2008) were detected. Usually in balanced multiallelic genetic systems, such as the self-incompatibility system in plants, transspecies alleles occur. Here, we combined a population method based on analyzing the frequency of single codons and linked the results with an analysis to detect codons that have undergone positive selection (by means of the dN-dS statistics). Among the population methods, Tajima’s D should be close to zero in a stable population at equilibrium. As a sign of balancing selection (or contraction in population size), a positive Tajima’s D results from low levels of both rare and high-frequency polymorphism, while a negative Tajima’s D is associated with positive or diversifying selection, population size expansion, or recovery from a selective sweep. We could exclude the scenario of variation in population size by 1) the fact of the large unmanaged population sample and 2) a Tajima’s D value for neutral loci close to zero (Hasselmann M, Willemsen D, unpublished data).
We calculated Tajima’s D by using a sliding window of 3 bp and a step of 3 bp (Hall et al. 2010), corresponding to each codon in the Kenyan csd-sequence data set. We identified four positions (1–4, representing six amino acids, given in fig. 7A and B) in which five codons showed a significant positive D (P < 0.05), favoring the hypothesis that these codons represent ancestral-balanced polymorphism. We noticed that at position 2, only the second codon showed a significant positive D (D = 2.8) (encoding the amino acid E or S), whereas the first codon (encoding R or N) failed to be significant (D = 1.3). These two codons associate either as RE or NS motif, as seen in the alignment and inferred from their ancestral states using the maximum likelihood method that places the motifs in basal two lineages of genealogy (fig. 6A). Negative values of D are found in approximately 45.3% of the codons, indicating an excess of low-frequency polymorphisms by diversifying selection. In addition, 4% of the codons show a positive Tajima’s D score, ranging from 0.5 to 1.8, for which the codon-based dN-dS statistics revealed signs of positive selection (P < 0.01) (fig. 7A, black dots, supplementary table S5, Supplementary Material online). In contrast to the five codons carrying ancestral-balanced polymorphism, which had accumulated nonsynonymous and synonymous changes (dN-dN statistic P > 0.1), the remaining codons with positive D comprise only nonsynonymous changes, indicating a more recent origin. We followed the occurrence of six amino acids along the Apis phylogeny by comparing csd and fem coding sequences of A. mellifera with those of A. cerana and A. dorsata (fig. 7B and C). Here, we propose that the ancestral state of these amino acids was K/RE/R/YN/-, and alternative amino acids appeared during the course of csd evolution in Apis species.
Fig. 7.

Codon-by codon analysis of Tajima’s D across A. mellifera csd sequences and occurrence of single amino acids within three Apis species in csd and fem. (A) Nonoverlapping, codon-by-codon sliding-window plot of Tajimas’s D for 107 Kenyan csd sequences. *P < 0.05, **P < 0.01. Black dots indicate signs of positive selection (P < 0.01) based on dN-dS statistics. (B) Underlying amino acids motifs of numbered peaks shown in (A) for csd and fem for A. mellifera, A. cerana, and A. dorsata. (C) Distribution of amino acid motifs given in (B) and their appearance along the csd/fem phylogeny in Apis.
Discussion
Our comprehensive study of csd-sequence variability revealed novel insights into the total number of csd alleles in honey bee populations and their evolutionary dynamics. For the first time, we focus on the HVR within csd and provide evidence for its high evolutionary rate. The origin of novel csd specificities in honey bee populations appears to be shaped by a high mutation and fixation rate of amino acid replacements. Single acid motifs that demonstrate a transspecies occurrence in the phylogenetic lineage of Apis were identified.
Heterozygous Specificities of csd Sequences
From the set of 77 independent pairs of functional heterozygous csd alleles, we developed two criteria that allowed us to estimate the number of sex-determining alleles within a given data set of csd sequences. Although we did not obtain full-length csd sequence data in the present study, the estimate of the number of csd alleles should not be substantially affected. In previous studies, the PSD among the csd alleles was identified by the strong signs of balancing selection, as reflected by elevated synonymous and nonsynonymous nucleotide diversity (Hasselmann et al. 2008). The mean nonsynonymous nucleotide diversity among the csd sequences is lowest in the N-terminal region of csd, providing support for the hypothesis that this region of the protein underlies a strong purifying selection. Our detailed evaluations of the variability within the HVR (this study, figs. 1, 2, and 4) provide further evidence that exons 6–8 provide sufficient information to identify csd specificities.
The combined information of amino acid differences 1) given by the inspection of the HVR and 2) existing in the HVR-flanking region (PSD including exon 8) allows the discrimination of the csd specificities from replicates encoding the same csd allele. Because of highly ambiguous alignment, the HVR was excluded from previous studies and was not further evaluated when estimating the numbers of csd alleles in honey bee populations (Hasselmann and Beye 2004; Hasselmann et al. 2008). Our results present evidence for the existence of at least 87 csd alleles worldwide and 53 csd alleles when focused only on a restricted geographic region in Kenya. An even more localized evaluation of the number of csd alleles in single regions (Mt. Kenya, Nyambene Hills, Mau), ranging from 23 to 28 csd alleles, are not strikingly different from early estimates from Adams et al. (1977; n = 19). Extrapolating our results to a larger sample size, the worldwide number and local Kenyan number of csd alleles (145 and 96, respectively) provides a remarkable example of the enormous possible sequence variability of this gene. We found no support in our data set for more relaxed criteria in terms of either a larger number of amino acid differences in the HVR-flanking regions or within the HVR. Nevertheless, we tested the outcome of the analysis by considering a more stringent criteria and assume that ∼5% of the observed heterozygotes are actually functionally identical and obtained a high number of csd alleles nevertheless (61 in our set and 79 total worldwide).
Evolutionary Scenario of the HVR and Its Flanking Regions
It seems reasonable to assume that the HVR is evolving at a high evolutionary rate, supported by the finding of sequences with highly variable repetitive regions but otherwise identical adjacent regions. There are different possible scenarios for the evolutionary processes that have affected this region. One likely scenario is that the repetitive region evolved following similar principles as found for microsatellites. For numerous cases of sequence comparisons, single and multiple triplets of nucleotide changes (e.g., TAA or TAT) were observed, leading to alterations of the amino acids asparagine (N) or tyrosine (Y). These single or multiple triplet changes may even occur as entire sets of characteristic motifs (NY, NNY), as previously described (Hasselmann et al. 2008), which may hint at unequal crossing over or duplications. In addition, sporadically single nucleotide changes occurred, resulting in the substitutions of amino acids such as lysine (K), aspartic acid (D), or cysteine (C) (fig. 4).
The molecular mechanism underlying the evolution of microsatellite mutations is not yet completely understood, whereas DNA slippage has been identified as the main process resulting in a high mutation rate (10–2 to 10–5) of microsatellites (Schlötterer and Tautz 1992; Ellegren 2004). We noticed that the evolutionary changes in the repetitive region of the HVR followed either the principle of single or trinucleotide changes, always leading to codon substitutions and indicating selection against frameshift mutations (Metzgar and Wills 2000). The comparison of the variance of length differences observed in eight microsatellites unlinked to csd compared with those within the HVR gave a first approximation to allow quantification of these changes. The unlinked microsatellites show a broad spectrum of different evolving repeats (single, di-, and trinucleotides [Solignac et al. 2007]) and serve as being representative for the evolution of the repetitive region of the HVR. The calculation of the factor Ferd suggests that on average, the evolutionary processes leading to length variation within the HVR occur 2.4-fold faster than for microsatellites (table 3). We are aware of the fact that our approach misses the nucleotide changes that do not contribute to length variation in the HVR. However, this lack might even underestimate the factor. In addition to our results obtained for the strength and evolutionary rate of positive selection (α and ωa), which are highest for short and long repeats (fig. 5), we propose that the HVR within the csd gene represents a hotspot for generating novel csd specificities supporting the concept of an local mutator under adaptive evolution in coding sequences (Metzgar and Wills 2000).
Our findings of stronger signs of positive selection in the HVR-flanking regions in groups of csd alleles carrying short (≤16 aa) and long (≥24 aa) repetitive regions may suggest a more balanced preference of csd alleles with intermediated lengths of the repeat. Interestingly, alleles with intermediate-size length seem to have diverged earlier, reflected by higher ds values in groups 3 and 4 when compared with groups 1, 2, 5, and XL (the short and long length alleles) (ds3/4 = 0.023 vs. ds1/2/5XL = 0.005, P < 0.05, Z-test, supplementary table S4, Supplementary Material online). This is in agreement with our observation that changes in repeat length occur microsatellite-like at high evolutionary rate, giving rise to the extremes. One may speculate that the underlying reason is associated with the formation of corresponding protein structures related to csd function. Preliminary ab initio prediction of secondary protein structure for four pairs of functional heterozygote csd alleles using the QUARK algorithm (Xu and Zhang 2012) indicate that the repeated motifs within the HVR form a beta-turn and coil protein structures (supplementary fig. S3, Supplementary Material online). Within repeats of intermediate length, the folding and formation of interaction loops might be facilitated, whereas the highly conserved amino acid residues flanking the repetitive region may serve as an anchor that limits the formation of optimal folded loops when the repetitive regions are short or very long. In this case, the biochemical properties, such as charge or lipophilicity, needed for complementary interaction would be potentially insufficient, which has been previously demonstrated for other biological systems, such as Ras-protein binding to human plasma membranes (Welman et al. 2000) or the antigen-binding site of immunoglobulins (AlLazikani et al. 1997). In csd-complementary interacting alleles, insufficient biochemical properties provided by the repetitive region might be compensated by enhanced adaptive nonsynonymous changes in the flanking regions, for which we see indications in the polymorphism data (table 1, supplementary table S2 and fig. S7, Supplementary Material online).
Evolutionary Factors Affecting the Population Dynamics of csd Alleles
Population genetic analysis of csd sequences indicate that new csd specificities arise with a much higher evolutionary rate than was previously estimated. This high originating rate of csd alleles per year (10–5) is accompanied by a pronounced, and almost maximal, proportion of amino acid substitutions driven by positive selection (α = 0.93). The high rate of adaptive replacement changes is in agreement with the strong advantage of csd alleles with new specificities in the sex-determination system of honey bee colonies (Mackensen 1951; Beye et al. 2003). Thus, the substantial numbers of replacement changes in recently diverged, evolutionarily young alleles (fig. 6) provide convincing evidence for the high originating rate of csd alleles. Consequently, two population genetic parameters should be affected most: 1) the frequency spectrum of polymorphism and 2) the average coalescence time of the csd alleles. For both parameters, our results provide compelling evidence according to the theoretical expectations, given by the high frequency (53%) of alleles carrying few (1–2) segregating sites (supplementary fig. S2, Supplementary Material online) and the short average coalescence time (max. 300,000 years) of csd alleles (supplementary fig. S3, Supplementary Material online).
First, the high originating rate of alleles and enhanced rate of adaptive changes should leave a signature in the allele frequency spectrum. Indeed, the negative values of Tajima’s D and the excess of low-frequency variants would also support an alternative explanation of a recent population growth after a genetic bottleneck. However, this scenario is very unlikely, as the honey bee populations sampled in Kenya represent a homogenous area of naturally occurring and unmanaged colonies (Ruttner 1976). Furthermore, polymorphism data from that Kenyan region obtained for eight noncoding, supposedly neutrally evolving loci support the scenario of a population in mutation-drift equilibrium (Tajima’s D close to zero, Hasselmann M, Willemsen D, unpublished data). It seems reasonable to assume that the negative values of the Fay and Wu’s H statistic, known to be sensitive for the detection of selective sweeps (Fay and Wu 2000), are the result of the enhanced rate of adaptive changes found in the csd sequences. These results would be in agreement with the scenario of complementary interacting csd alleles, which need to accumulate stepwise differences for proper heterozygous functionality (Gempe and Beye 2011). This gradual process of stepwise accumulating a minimum number of mutations to reach full functional csd heterozygosity is in agreement with the study of csd genotypes in female and haplo and diploid male individuals obtained by crossing experiments of A. mellifera (Beye et al. forthcoming).
Analyzing the pairwise average coalescence time (Td) of csd alleles, our model indicates that we obtained substantially shorter values (120,000–300,000 years) than calculated in a previous study (Hasselmann et al. 2008). However, this result was not very surprising, as in the present study, we focused only on the csd evolution within A. mellifera (in contrast to the comparative approach among three Apis species in the study of 2008, giving a Td of approximately 6 My). Furthermore, the originating rate (u) and number of alleles (n) have been updated by the new findings in the current study (this study: u = 1.1 × 10⁻⁵ to 9 × 10⁻⁶ and n = 53–87, study of 2008: u = 10–7 – 10–8 and n ∼ 20). Consequently, the increased estimates of long-term effective population sizes from Ne = 12,000–30,000 might reduce the effect of genetic drift as a driving force in the evolution of csd alleles. Instead, we propose that the high rate of replacement changes is a major evolutionary process that gave rise to a novel csd specificity approximately every 400,000 years by an accumulation of four amino acid differences within the PSD/exon 8 region.
Long-Term Signs of Balancing Selection in Apis csd Alleles
Our evolutionary analysis of csd alleles indicates that novel csd specificities may not only arise within short evolutionary times but can also be maintained far longer than one would expect under neutrality. The latter is supported not only by previous studies (Hasselmann and Beye 2004; Hasselmann et al. 2008) but also by nucleotide diversity data on synonymous sites (up to 9%, this study, table 1) that far exceed genome-wide average diversity (0.5%; Beye et al. 2006). The underlying selective regime of negative-frequency-dependent selection as one form of balancing selection maintains these polymorphisms within csd.
We identified in this study single amino-acid motifs defining strong candidates for balanced polymorphism that precede speciation events within the Apis phylogeny (fig. 7). The codon-by-codon analysis of Tajima’s D, providing four peaks of positive D (P < 0.05), (fig. 7A) and the accompanying dn-ds statistic (supplementary table S5, Supplementary Material online) indicate long-term maintenance of the corresponding amino acids. The comparison along the phylogenetic tree of csd and fem of closely related Apis species (A. cerana and A. dorsata) provide further insights that these amino acids might have arisen several million years ago and represent transspecies polymorphism. These polymorphisms, reflected by allelic lineages that are more closely related between than within species, have been regularly described for genetic systems under balancing selection, such as the plant S locus (Igic et al. 2003; Miller et al. 2008) and the vertebrate MHC complex (Takahata 1993; Bos and Waldman 2006; Cutrera and Lacey 2007). No such allelic lineages had been found for the csd gene in honey bees thus far. Our finding of these shared ancestral polymorphisms within a confined region of csd supports the scenario described by Charlesworth (2008), in which such polymorphisms may occur in a multiallelic system in a limited region within alleles, depending on the presence or absence of recombination. Although previous analyses detected no evidence for intragenic recombination within that region (Hasselmann and Beye 2006; Hasselmann et al. 2008), we cannot rule out the possibility that rare recombining events occurred over the long-term evolution of csd.
Our data provide a remarkable example of a surprisingly variable and fast-evolving gene under balancing selection in honey bees. Thus, we can shed light on the underlying evolutionary processes in which a high rate of replacement changes gives rise to novel csd specificities within a short evolutionary time. In addition, our work also contributes to the understanding of the evolutionary potential of asparagine–tyrosine-rich HVRs. Both aspects are of particular importance for honey bee population management, as the number of sex-determining csd alleles in populations directly affects honey bee colony fitness.
Materials and Methods
Bee material was sampled from male and female honey bees from a large number of colonies representing different geographic regions worldwide. First, up to ten males (drones) per colony were obtained from the following locations to identify both copies of csd alleles that represented the queen genotype: USA: (North Carolina, Texas, CA), Brazil (Riberao Preto), Israel (Haifa), and Australia (Canberra). We complemented this first sampling with a more comprehensive sampling within a region of negligible low anthropogenic effect, the mountain forest, and savannah regions of Kenya (East Africa). The Kenyan sampling localities were restricted to three geographic areas (Mt. Kenya, Nyambeme Hills, Mau). For each region, ten colonies with two females (workers) per colony, representing four different chromosomal maximums per two females, were sampled (n = 120 chromosomes). All individuals were collected in 90% ethanol and stored immediately after collection at −20 °C until further processing.
Genomic DNA was extracted as previously described (Hasselmann et al. 2001). The amplification of csd alleles by PCR was restricted to the exon 6–9 regions, as previously described (Hasselmann et al. 2010), using a high-fidelity, proofreading Phusion DNA polymerase (New England Biolabs, UK). The PCR fragments were cloned into a pGEM-T vector (Promega, Mannheim, Germany), and two clones that are suspected to contain different alleles due restriction fragment analysis were sequenced (Eurofins MWG, Germany). In total, 191 csd sequences were generated from male and female individuals: Texas: n = 12, North Carolina: n = 20, Arizona: n = 11, Australia: n = 17, Brazil: n = 19, Israel: n = 5, Kenya: n = 107. Furthermore, 11 csd sequences from the cDNA out of a pool of embryos (0–6 h) of one additional locality (France) were used. We obtained this cDNA in a 2008 study following a previously described protocol (Hasselmann et al. 2008). (GenBank accession numbers KF730850–KF730860, KG701648–KG701839) For the subsequent molecular evolutionary analysis, we enriched our data set with csd sequences that were obtained in previous studies (Hasselmann and Beye 2004; Hasselmann et al. 2010). In total, 244 csd sequences were subjected to further analysis.
The remarkable nucleotide differences of the mainly triple repeats suggest that the evolution of the repetitive region within the HVR follows, in principle, those of microsatellites. To examine this hypothesis, we obtained fragment lengths of the repetitive region within the HVR of csd in an independent experimental setup from 56 females of the Kenya samples using the following oligonucleotides: SLEb_fw ATCGAAAGAACGATCTCGAGATAG and SLEb_rev AACAGGAACAGG AATTTGTTCAAT, which represent the UniSTS 469051 (SLEb) in the honeybee genome (http://www.ncbi.nlm.nih.gov/genome?term=apis%20mellifera, last accessed November 1, 2013). From the same individuals, we used the fragment length obtained for eight microsatellites unlinked to csd (loci A007, A079, A28, A88, A113, B124, A43, and A24; Gruber et al. 2013). Fluorescently labeled microsatellite fragments were separated using an ABI 3730 DNA sequencer at the Cologne Centre of Genomics (CCG) and analyzed using GeneMarker version 1.51 software.
Molecular Evolutionary Analysis
The csd sequences were aligned and edited as previously described (Hasselmann and Beye 2004). The numbers of amino acid replacements, synonymous mutations, and nonsynonymous substitutions per corresponding site were calculated using Python scripts and MEGA version 5 software (Tamura et al. 2011) and were statistically analyzed with R (R Core Team 2013, http://www.r-project.org/, last accessed November 1, 2013). The program Modeltest, implemented in MEGA version 5, was used to compare available nucleotide substitution models to obtain the best description of the substitution pattern using the maximum likelihood method. The model with the lowest Bayesian information criterion (BIC) scores was considered to best describe the substitution pattern. Nonuniformity of evolutionary rates among sites was modeled by using a discrete Gamma distribution (+G) with five rate categories. Evolutionary history was inferred using the maximum likelihood method based on the amino acid distances using the Jones–Taylor–Thornton (JTT) model and the modified Nei–Gojobori methods for synonymous substitutions. For each codon, estimates of the numbers of inferred synonymous (s) and nonsynonymous (n) substitutions are calculated along with the numbers of sites that are estimated to be synonymous (S) and nonsynonymous (N). These estimates are produced using the joint maximum likelihood reconstructions of ancestral states under a Muse–Gaut model codon substitution and Hasegawa–Kishino–Yano model of nucleotide substitution. The test statistic dN-dS is used for detecting codons that have undergone positive selection, where dS is the number of synonymous substitutions per site (s/S) and dN is the number of nonsynonymous substitutions per site (n/N). Sequence summary statistics in terms of haplotype diversity, number of segregating sites, estimates of nucleotide diversity, and neutrality tests were calculated using DnaSP version 5.1 (Librado and Rozas 2009).
We used nondegenerated (classified as nonsynonymous, N) and 4-fold degenerated (classified as synonymous [S]) sites to calculate the evolutionary parameters α and ωa that quantify positive selection. The proportion of amino acid substitutions driven by positive selection α was estimated according to Smith and Eyre-Walker (2002).
In addition, we calculated the rate of adaptive nonsynonymous substitutions, relative to the rate of synonymous substitutions, as follows (Gossmann et al. 2010):
Polymorphisms (pN, pS) were defined as the fraction of sites differing within A. mellifera csd sequences, and divergence (dS, dN) was defined as the fraction of sites differing between A. mellifera and A. cerana csd sequences.
An estimate of the genomic mutation rate was derived from the average pairwise synonymous divergence per site (dS) for five genes (elongation factor-alpha 1-EF1, Actin, Calmodulin-Kinase II, RNA-polymerase II, and fem; supplementary tables S1 and S2, Supplementary Material online) for A. mellifera/A. cerana (dS = 0.087), A. mellifera/A. dorsata (dS = 0.09), and A. mellifera/A. florea (ds = 0.106), and new estimates of their divergence times (17–19 My for A.m/A.c., 22–24 My for A.m/A.d. and 29–33 My for A.m/A.f.) were based on a study by Ramirez et al. 2010. Using these parameters, the average genomic mutation rate was calculated by the number of polymorphisms at synonymous sites that accumulate = 2 gµ, where g is the number of generations, assuming one generation per year for the honeybee and µ is the mutation rate. We obtained by this µ = 2 × 10⁻⁹ per site per year. The long-term effective population size (Ne) and average pairwise coalescence time (Td) of the csd alleles were calculated using equations (1) and (6) from Hasselmann et al. 2008 for the given range of n (numbers of csd alleles) and u (originating rate for new csd specificities) that coincide with the values obtained in the present study. Equations were solved using the Mathematica software package (Wolfram Research 2009).
Evolutionary Rate Length Variation Factor
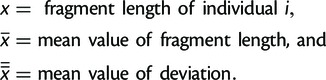
We developed a formula that allows us to calculate a factor that provides the evolutionary length variation of the HVR relative to that of microsatellites. Under the assumption that mutations within the repetitive region of the HVR evolve under negative frequency-dependent selection and will be maintained over an extended period of time, genetic drift is negligibly low. Consequently, as an approximation, only mutations contribute to the length variation, which can be used to compare the rate of variation observed within the HVR to the variation observed for microsatellites.
To obtain the factor mentioned earlier, first, we calculated, for each locus, the average mean of the fragment length and the deviation from this mean value for each allele separately. Here, the deviation from the mean value of fragment length represents the evolutionary rate of the alleles. Using the variance of the deviation from these mean values, we obtained a parameter-free value irrespective of the fragment length of each allele.
The following formula for each locus was used:
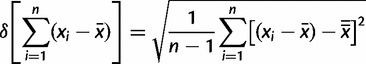 |
(1) |
with
 |
The evolutionary rate factor of differences (Ferd) between the microsatellites (mics) and the repetitive region within the csd HVR (HVR) are represented by
| (2) |
Supplementary Material
Supplementary figures S1–S7 and tables S1–S7 are available at Molecular Biology and Evolution online (http://www.mbe.oxfordjournals.org).
Acknowledgments
The authors are thankful to the following colleagues for providing honeybee samples: Kim Fondrk, Klaus Hartfelder, Christina Grozinger, Katherine Aronstein, Guy Bloch, and Ryszard Maleszka. The authors thank the National Council of Science and Technology, Republic of Kenya, for granting permission for honey bee sampling in Kenya. The authors also thank Fatma Rabia Ürün for excellent technical assistance, Filipo Disanto for support in the graphical presentation of the coalescence data, Thomas Wiehe, Johannes Berg, two anonymous referees, and the associated editor for their valuable comments on a previous version of the manuscript. L.F. acknowledges support from the grant ANR-12-JSV7–0007. This work was supported by grants of the Deutsche Forschungsgemeinschaft (HA 5499/3–1, HA 5499/3–2) and a Heisenberg fellowship (HA 5499/6–1) to M.H.
References
- Adams J, Rothman ED, Kerr WE, Paulino ZL. Estimation of the number of sex alleles and queen matings from diploid male frequencies in a population of Apis mellifera. Genetics. 1977;86:583–596. doi: 10.1093/genetics/86.3.583. [DOI] [PMC free article] [PubMed] [Google Scholar]
- AlLazikani B, Lesk AM, Chothia C. Standard conformations for the canonical structures of immunoglobulins. J Mol Biol. 1997;273:927–948. doi: 10.1006/jmbi.1997.1354. [DOI] [PubMed] [Google Scholar]
- Beye M, Gattermeier I, Hasselmann M, et al. (15 co-authors) Exceptionally high levels of recombination across the honey bee genome. Genome Res. 2006;16:1339–1344. doi: 10.1101/gr.5680406. [DOI] [PMC free article] [PubMed] [Google Scholar]
- Beye M, Hasselmann M, Fondrk MK, Page RE, Jr, Omholt SW. The gene csd is the primary signal for sexual development in the honey bee and encodes a SR-type protein. Cell. 2003;114:419–429. doi: 10.1016/s0092-8674(03)00606-8. [DOI] [PubMed] [Google Scholar]
- Beye M, Seelmann C, Gempe T, Hasselmann M, Vekemans K, Fondrk MK, Page RE. Gradual molecular evolution of a sex determination switch in honeybees through incomplete penetrance of femaleness. Current Biol. forthcoming doi: 10.1016/j.cub.2013.10.070. [DOI] [PubMed] [Google Scholar]
- Bos DH, Waldman B. Evolution by recombination and transspecies polymorphism in the MHC class I gene of Xenopus laevis. Mol Biol Evol. 2006;23:137–143. doi: 10.1093/molbev/msj016. [DOI] [PubMed] [Google Scholar]
- Charlesworth D. Balancing selection and its effects on sequences in nearby genome regions. PLoS Genet. 2006;2:e64. doi: 10.1371/journal.pgen.0020064. [DOI] [PMC free article] [PubMed] [Google Scholar]
- Charlesworth D. Evolutionary genetics: changed sex determination in honeybees. Curr Biol. 2008;18:R610–R612. doi: 10.1016/j.cub.2008.06.004. [DOI] [PubMed] [Google Scholar]
- Cutrera AP, Lacey EA. Trans-species polymorphism and evidence of selection on class II MHC loci in Tuco tucos (Rodentia: Ctenomyidae) Immunogenetics. 2007;59:937–948. doi: 10.1007/s00251-007-0261-3. [DOI] [PubMed] [Google Scholar]
- Ellegren H. Microsatellites: simple sequences with complex evolution. Nat Rev Genet. 2004;5:435–445. doi: 10.1038/nrg1348. [DOI] [PubMed] [Google Scholar]
- Fay JC, Wu CI. Hitchhiking under positive Darwinian selection. Genetics. 2000;155:1405–1413. doi: 10.1093/genetics/155.3.1405. [DOI] [PMC free article] [PubMed] [Google Scholar]
- Gempe T, Beye M. Function and evolution of sex determination mechanisms, genes and pathways in insects. BioEssays. 2011;33:52–60. doi: 10.1002/bies.201000043. [DOI] [PMC free article] [PubMed] [Google Scholar]
- Gossmann TI, Song BH, Windsor AJ, Mitchell-Olds T, Dixon CJ, Kapralov MV, Filatov DA, Eyre-Walker A. Genome wide analyses reveal little evidence for adaptive evolution in many plant species. Mol Biol Evol. 2010;27:1822–1832. doi: 10.1093/molbev/msq079. [DOI] [PMC free article] [PubMed] [Google Scholar]
- Gruber K, Schöning C, Otte M, Kinuthia W, Hasselmann M. Distinct subspecies or phenotypic plasticity? Genetic and morphological differentiation of mountain honey bees in East Africa. Ecol Evol. 2013;3(10):3204–3218. doi: 10.1002/ece3.711. [DOI] [PMC free article] [PubMed] [Google Scholar]
- Hall C, Welch J, Kowbel DJ, Glass NL. Evolution and diversity of a fungal self/nonself recognition locus. PLoS One. 2010;5:e14055. doi: 10.1371/journal.pone.0014055. [DOI] [PMC free article] [PubMed] [Google Scholar]
- Hasselmann M, Beye M. Signatures of selection among sex-determining alleles of the honey bee. Proc Natl Acad Sci U S A. 2004;101:4888–4893. doi: 10.1073/pnas.0307147101. [DOI] [PMC free article] [PubMed] [Google Scholar]
- Hasselmann M, Beye M. Pronounced differences of recombination activity at the sex determination locus (SDL) of the honey bee, a locus under strong balancing selection. Genetics. 2006;174:1469–1480. doi: 10.1534/genetics.106.062018. [DOI] [PMC free article] [PubMed] [Google Scholar]
- Hasselmann M, Fondrk MK, Page RE, Jr, Beye M. Fine scale mapping in the sex locus region of the honey bee (Apis mellifera) Insect Mol Biol. 2001;10:605–608. doi: 10.1046/j.0962-1075.2001.00300.x. [DOI] [PubMed] [Google Scholar]
- Hasselmann M, Lechner S, Schulte C, Beye M. Origin of a function by tandem gene duplication limits the evolutionary capability of its sister copy. Proc Natl Acad Sci U S A. 2010;107:13378–13383. doi: 10.1073/pnas.1005617107. [DOI] [PMC free article] [PubMed] [Google Scholar]
- Hasselmann M, Vekemans X, Pflugfelder J, Koeniger N, Koeniger G, Tingek S, Beye M. Evidence for convergent nucleotide evolution and high allelic turnover rates at the complementary sex determiner gene of Western and Asian honeybees. Mol Biol Evol. 2008;25:696–708. doi: 10.1093/molbev/msn011. [DOI] [PubMed] [Google Scholar]
- Igic B, Bohs L, Kohn JR. Historical inferences from self-incompatibility locus. New Phytol. 2003;161:97–105. [Google Scholar]
- Klein D, Ono H, O'hUigin C, Vincek V, Goldschmidt T, Klein J. Extensive MHC variability in cichlid fishes of Lake Malawi. Nature. 1993;364:330–334. doi: 10.1038/364330a0. [DOI] [PubMed] [Google Scholar]
- Librado P, Rozas J. DnaSP v5: a software for comprehensive analysis of DNA polymorphism data. Bioinformatics. 2009;25:1451–1452. doi: 10.1093/bioinformatics/btp187. [DOI] [PubMed] [Google Scholar]
- Mackensen O. Viability and sex determination in the honeybee (Apis mellifera L.) Genetics. 1951;36:500–509. doi: 10.1093/genetics/36.5.500. [DOI] [PMC free article] [PubMed] [Google Scholar]
- May G, Shaw F, Badrane H, Vekemans X. The signature of balancing selection: Fungal mating compatibility gene evolution. Proc Natl Acad Sci U S A. 1999;96:9172–9177. doi: 10.1073/pnas.96.16.9172. [DOI] [PMC free article] [PubMed] [Google Scholar]
- Metzgar D, Wills C. Evidence for the adaptive evolution of mutation rates. Cell. 2000;101:581–584. doi: 10.1016/s0092-8674(00)80869-7. [DOI] [PubMed] [Google Scholar]
- Miller JS, Levin RA, Feliciano NM. A tale of two continents: Baker's rule and the maintenance of self-incompatibility in lycium (Solanaceae) Evolution. 2008;62:1052–1065. doi: 10.1111/j.1558-5646.2008.00358.x. [DOI] [PubMed] [Google Scholar]
- Nasrallah JB. Evolution of the Brassica self-incompatibility locus: a look into S-locus gene polymorphisms. Proc Natl Acad Sci U S A. 1997;94:9516–9519. doi: 10.1073/pnas.94.18.9516. [DOI] [PMC free article] [PubMed] [Google Scholar]
- Ramirez SR, Nieh JC, Quental TB, Roubik DW, Imperatriz-Fonseca VL, Pierce NE. A molecular phylogeny of the stingless bee genus Melipona (Hymenoptera: Apidae) Mol Phylogenet Evol. 2010;56:519–525. doi: 10.1016/j.ympev.2010.04.026. [DOI] [PubMed] [Google Scholar]
- Ruttner F. 1976. Honeybees of the tropics: their variety and characteristics of importance for apiculture. Proceedings of the 1st International Conference on Apiculture in Tropical Climates; 1976; London: IBRA. p. 41–46. [Google Scholar]
- Schlötterer C, Tautz D. Slippage synthesis of simple sequence DNA. Nucleic Acids Res. 1992;20:211–215. doi: 10.1093/nar/20.2.211. [DOI] [PMC free article] [PubMed] [Google Scholar]
- Smith NG, Eyre-Walker A. Adaptive protein evolution in Drosophila. Nature. 2002;415:1022–1024. doi: 10.1038/4151022a. [DOI] [PubMed] [Google Scholar]
- Solignac M, Mougel F, Vautrin D, Monnerot M, Cornuet JM. A third-generation microsatellite-based linkage map of the honey bee, Apis mellifera, and its comparison with the sequence-based physical map. Genome Biol. 2007;8:R66. doi: 10.1186/gb-2007-8-4-r66. [DOI] [PMC free article] [PubMed] [Google Scholar]
- Takahata N, Nei M. Allelic genealogy under overdominant and frequency-dependent selection and polymorphism of major histocompatibility complex loci. Genetics. 1990;124:967–978. doi: 10.1093/genetics/124.4.967. [DOI] [PMC free article] [PubMed] [Google Scholar]
- Takahata N, Satta Y, Klein J. Polymorphism and balancing selection at major histocompatibility complex loci. Genetics. 1992;130:925–938. doi: 10.1093/genetics/130.4.925. [DOI] [PMC free article] [PubMed] [Google Scholar]
- Takahata N. Allelic genealogy and human-evolution. Mol Biol Evol. 1993;10:2–22. doi: 10.1093/oxfordjournals.molbev.a039995. [DOI] [PubMed] [Google Scholar]
- Tamura K, Peterson D, Peterson N, Stecher G, Nei M, Kumar S. MEGA5: molecular evolutionary genetics analysis using maximum likelihood, evolutionary distance, and maximum parsimony methods. Mol Biol Evol. 2011;28:2731–2739. doi: 10.1093/molbev/msr121. [DOI] [PMC free article] [PubMed] [Google Scholar]
- von Schelling H. Coupon collecting for unequal probabilities. Am Math Mon. 1954;61:306–311. [Google Scholar]
- Welman A, Burger MM, Hagmann J. Structure and function of the C-terminal hypervariable region of K-Ras4B in plasma membrane targetting and transformation. Oncogene. 2000;19:4582–4591. doi: 10.1038/sj.onc.1203818. [DOI] [PubMed] [Google Scholar]
- Wolfram Research. Mathematica. Version 7.0. Champaign (IL): Wolfram Research; 2009. [Google Scholar]
- Wright S. The distribution of selfsterility alleles in populations. Genetics. 1939;24:538–552. doi: 10.1093/genetics/24.4.538. [DOI] [PMC free article] [PubMed] [Google Scholar]
- Xu D, Zhang Z. Ab initio protein structure assembly using continuous structure fragments and optimized knowledge-based force field. Proteins. 2012;80:1715–1735. doi: 10.1002/prot.24065. [DOI] [PMC free article] [PubMed] [Google Scholar]
- Yokoyama S, Nei M. Population dynamics of sex determining alleles in honey bees and self-incompatibility in plants. Genetics. 1979;91:609–626. doi: 10.1093/genetics/91.3.609. [DOI] [PMC free article] [PubMed] [Google Scholar]
Associated Data
This section collects any data citations, data availability statements, or supplementary materials included in this article.