

Abstract
Antigen binding to the B cell receptor (BCR) induces receptor clustering, cell spreading, and the formation of signaling microclusters, triggering B cell activation. Although the biochemical pathways governing early B cell signaling have been well studied, the role of the physical properties of antigens, such as antigen mobility, has not been fully examined. We study the interaction of B cells with BCR ligands coated on glass or tethered to planar lipid bilayer surfaces to investigate the differences in B cell response to immobile and mobile ligands. Using high-resolution total internal reflection fluorescence (TIRF) microscopy of live cells, we followed the movement and spatial organization of BCR clusters and the associated signaling. Although ligands on either surface were able to cross-link BCRs and induce clustering, B cells interacting with mobile ligands displayed greater signaling than those interacting with immobile ligands. Quantitative analysis revealed that mobile ligands enabled BCR clusters to move farther and merge more efficiently than immobile ligands. These differences in physical reorganization of receptor clusters were associated with differences in actin remodeling. Perturbation experiments revealed that a dynamic actin cytoskeleton actively reorganized receptor clusters. These results suggest that ligand mobility is an important parameter for regulating B cell signaling.
Introduction
Cellular sensing of the environment is mediated by surface receptors that bind to specific ligands and initiate signaling pathways. In many cases, the ligands are confined on a surface and receptor-ligand interaction requires the direct contact of cells with the activating surface. Genetic and biochemical approaches have elucidated the molecular mechanisms of receptor signal transduction. However, recent studies have revealed that the spatial organization and physical presentation of surface ligands can regulate signaling (1–6). Despite its importance for the regulation of signaling, the role of physical factors of ligands that control the distribution of receptors is not well understood.
The cells of the immune system require contact between two cell surfaces for communication (7). As a critical part of the humoral immune response, B-lymphocytes are activated by the binding of antigens (Ag) to clonally specific B cell receptors (BCR) (8). B cells commonly encounter two forms of antigens in lymphoid organs, soluble and membrane-associated (9–12). Although multivalent, soluble antigens induce BCR clustering and B cell activation (13), recent studies have shown that surface-anchored antigens are more efficient in triggering B cell activation (14,15). The binding of antigen to the BCR results in receptor cross-linking as well as conformational changes in the BCR, facilitating the aggregation of BCRs into microclusters (∼ 300 to 600 nm diam.) (9,15,16). BCR microclusters recruit a number of signaling intermediaries, which initiate activation of downstream biochemical pathways (8,17). Initiation of signaling drives the rapid spreading of B cells on the surface of the antigen-presenting cell. This is induced by the reorganization of the actin cytoskeleton and can further amplify the signaling response (18–20).
In the lymph nodes and spleen, B cells encounter antigen commonly presented by antigen presenting cells, such as marginal zone macrophages (9) and follicular dendritic cells (DC) (12,21,22). Antigen is commonly presented as large complexes such as viral aggregates, antibody-antigen and complement-opsonized antigen aggregates, as well as antigen-coated microspheres and complexed with aluminum hydroxide gel injected as vaccines, and are capable of triggering B cell activation (17). Antigen absorbed by aluminum hydroxide gel, the most common adjuvant and vehicle of FDA-approved vaccines, would be immobile, whereas antigen in immune complexes presented by Fc and complement receptors on the surface of antigen presenting cells (APC) will have varying degrees of mobility, depending on the size of immune complexes and the cytoskeletal architecture of the APC that may further constrain antigen movement. However, whether antigen mobility affects BCR clustering and signaling is an open question.
BCR signaling is dependent on signaling-induced actin reorganization (19,20). BCR stimulation induces rapid depolymerization of actin followed by repolymerization (23). Perturbing the cortical actin network, which increases the lateral mobility of surface BCRs, can facilitate BCR aggregation and signaling activation (20,24). Although actin is known to be important for maintaining cortical integrity, and the depolymerization of actin has been shown to increase receptor mobility potentially by removing the cortical barriers to movement, whether the actin cytoskeleton plays an active role in BCR microcluster formation and coalescence has not been fully examined.
In this study, we investigate the impact of ligand lateral mobility on BCR dynamics and signaling activation. Using high-resolution time-lapse imaging of live cells, we compare the morphology and BCR clustering of B cells when interacting with mobile ligands tethered on planar lipid bilayer and immobile on glass surfaces. We show that ligand mobility significantly modulates B cell spreading dynamics, formation and movement of receptor clusters, actin organization, as well as the level of signaling activation. Our data reveal a potential role for the actin cytoskeleton in regulating the sensitivity of BCR clustering to ligand mobility. Our results indicate that the physical properties of the ligand regulate the level of BCR signaling by modulating B cell morphology, receptors, and actin organization.
Materials and Methods
Cell culture and preparation
A20 cells or enhanced green fluorescent protein (EGFP)-actin expressing A20 cells were cultured as described previously (19,25). Cells were used at a density 7 × 10⁵ cells/mL for imaging. Surface BCRs were labeled with Alexa Fluor 546 labeled mono-biotinylated Fab’ fragment of antimouse IgM+G antibody (AF546-mB-Fab’-anti-Ig, 2.5 μg/mL, Jackson ImmunoResearch, West Grove, PA), generated as described previously (25) at 4°C before incubating with streptavidin (SA) coated glass and planar lipid bilayers. As a control, cells were incubated with Cy3-labeled Fab’ fragment of goat antimouse IgG (2.88 μg/mL) to label surface BCRs and biotinylated transferrin (3.5 μg/mL) to label surface transferrin receptor at 4°C before incubating with substrates at 37°C. For intracellular staining, cells were fixed with 4% paraformaldehyde in phosphate buffered saline (PBS) at various time points after incubation, and then labeled with antiphosphotyrosine antibody (4G10, Millipore, Billerica, MA), followed by Cy2-goat antimouse IgG2b (Millipore). For inhibition of actin polymerization, cells were incubated with Latrunculin A (100 nM, L5163, Sigma, St. Louis, MO).
Substrate preparation and imaging
Immobile ligand substrate: eight-well glass bottom LabTek (155411, Thermo Scientific, Waltham, MA) dishes were coated with 0.01% PLL for 10 min and dried for 1 h, washed 3 × with PBS and then coated with 1 μg/mL SA for 1 h and finally blocked for 10 min at 37°C.
Mobile ligand substrate: glass cover slips were cleaned with NanoStrip (539200, Cyantek, Fremont, CA). A lipid mixture of 5 mM and a DOPC/DOPE-cap-biotin ratio of 100:1 was created by vesicle extrusion (610000, Avanti Polar Lipids, Alabaster, AL). Wells were incubated for 10 min with lipids at 4 μM, washed with excess PBS, then incubated for 10 min with 2 μg/mL SA and washed thoroughly. Lipid mobility was verified using a fluorescence recovery after photobleaching (FRAP) assay. Only substrates with at least 70% recovery (Fig. S1 in Supporting Material) were used for experiments. After coating, surfaces were washed thoroughly to remove unbound SA. Based on previously published measurements, typical SA densities on bilayer surfaces were estimated to be ∼ 1500 per μm2 (4). Enzyme-linked immunosorbent assay (ELISA) assays were used to confirm similar densities of SA on glass and bilayer substrates (See Fig. S2 and Methods in Supporting Material).
Cells were seeded onto chambers for imaging and maintained at 37°C using an airstream incubator (ASI400 Nevtek, Williamsville, VA). Images were collected using an inverted microscope (TE2000 PFS, Nikon, Melville, NY) with a cooled CCD camera (Coolsnap HQ2, Photometrics, Tucson, AZ) at a frame interval of 3 s. EGFP-actin and fluorescent receptors were imaged with total internal reflection fluorescence (TIRF) using a 60 × 1.49 NA objective lens, a 491 nm laser (100 mW, Andor, South Windsor, CT) for EGFP excitation, and a 561 nm laser (75 mW, Andor) for AF546 excitation. Identical imaging conditions were used for both types of substrates.
Image analysis and BCR cluster tracking
BCR cluster tracking was performed using the MATLAB (Mathworks, Natick, MA) image analysis package uTrack (http://lccb.hms.harvard.edu/software.html) (26). Postprocessing of tracked data was performed with custom programs in MATLAB. The same settings were applied to a field of nonmoving particles of similar size and average cluster displacement was calculated. Three times this value was set as a lower threshold for meaningful cluster motion.
Results
Ligand lateral mobility modulates B cell spreading and BCR aggregation
To examine the effect of ligand mobility on BCR signaling and activation, we labeled surface BCRs on A20 lymphoma B cells with monovalent, biotinylated, fluorescently labeled Fab’ fragment of antibody (AF546-mB-Fab’-anti-Ig), which labels the BCR without cross-linking and ensures that BCR clustering is entirely attributable to the streptavidin coated on a glass cover slip or planar lipid bilayer. This model system has been shown to induce spreading of B cells (25) and actin reorganization, recapitulating many aspects of early cellular events of BCR signaling (17). We analyzed the spreading response of B cells using interference reflection microscopy (IRM). Within a few seconds of incubation, cells established contact with the streptavidin-coated substrate and formed small adhesive patches. Following this, the cells spread on the surface, increasing their contact area, reaching a plateau at 6 min (Fig. 1, A and B). The cell spread area at 8 min was larger on glass (98.1 ± 11.3 μm2, mean ± SD) than that on bilayer substrates (66.8 ± 7.4 μm2) (Fig. 1 C). To test whether the observed cell spreading results from stimulation, we measured the spread areas at 8 min of B cells on glass or bilayer under nonstimulating conditions using biotinylated transferrin (biotin-Tf). The binding of biotin-Tf labeled receptor to coated streptavidin enables cells to interact with glass and bilayer surfaces without cross-linking and stimulating BCRs. We found that B cells under this nonstimulatory condition, on both streptavidin-coated glass and lipid bilayers did not show significant spreading (Fig. 1 D), suggesting that the spreading of B cells requires BCR signaling.
Figure 1.

Effect of ligand mobility on spreading and BCR accumulation of A20 B cells. (A) Time-lapse IRM images showing the increasing contact zone of a cell spreading on an activating bilayer substrate. (B) Time-lapse IRM images of a cell spreading on an activating glass substrate. (C) Contact area as a function of time for representative cells spreading on a bilayer (dark gray) and glass (light gray) surface. (D) Average final spread areas (with SE) for cells on glass (N = 23) and bilayer (N = 22). The spread area at 8 min for cells on a glass surface (G-Fab) was greater than that on a bilayer (B-Fab) (p<0.05; t-test). Spread areas of cells on both the glass (G-Fab) and bilayer (B-Fab) surface were significantly larger than for control conditions of transferrin mediated spreading for glass (G-Tf) (p<0.001, t-test) and bilayer (B-Tf) (p<0.001, t-test). (E) Time-lapse TIRF images of AF546 labeled BCR clusters in an A20 cell spreading on a supported lipid bilayer. Cell contour obtained from IRM is shown in white. (F) Time-lapse TIRF images of BCR clusters for a cell spreading on a glass surface. The cell contour is drawn in white. (G) Increase in total BCR fluorescence intensity in the contact zone as a function of time on supported lipid bilayer (dark gray) and glass (light gray) substrates (mean and SE) (H) Mean fluorescence intensity of labeled BCR at the contact zone at 8 minutes for cells on bilayer (B-Fab) (N = 34) and glass (G-Fab) (N = 18) substrates. MFI was significantly larger for cells on bilayer surfaces (p<0.001, t-test). MFI for bilayer and glass was also significantly higher than for cells spreading under control conditions on bilayer (B-Tf) (N=16) (p<0.001) and glass (G-Tf) (N=24) (p<0.001). All scale bars are 5 μm.
As B cells spread on a stimulating surface, BCRs accumulate in the contact zone (8,18). We examined the effect of ligand mobility on the accumulation of BCR during spreading using TIRF microscopy. BCR clusters formed upon initial contact and continued to increase in number and intensity as the cell contact area increased (Fig. 1, E and F). The total fluorescence intensity of BCR staining, indicative of BCR accumulation in the contact zone, increased over time until saturation on surfaces with either immobile or mobile ligands (Fig. 1 G). However, there were significant differences between cells on the two types of surfaces. Cells on glass achieved maximum BCR fluorescence at ∼ 2 min, but on lipid bilayers, the BCR fluorescence intensity continued to increase for at least 6 min. Cells on glass substrates showed smaller increases in BCR fluorescence and lower fluorescence intensity at all time points compared with cells on lipid bilayers. Since both cell area and BCR fluorescence reach their plateau by 8 min, we used this as the nominal end point for all our subsequent analyses. The mean fluorescence intensity (MFI) of BCRs at 8 min was also significantly higher on lipid bilayer than on glass substrates (Fig. 1 H). Cells spreading under nonstimulating conditions (as described before) made limited contact with the surface and showed significantly lower MFI than their stimulated counterparts on both bilayer and glass (Fig. 1 H). To ensure that the greater BCR accumulation observed on the bilayer surface was not because of increased coating of streptavidin on bilayer compared with glass, we verified that the coating density of streptavidin was similar for glass and bilayer substrates using ELISA (Fig. S2). To test whether the increase in BCR clustering on bilayers was because of increased accumulation of mobile streptavidin in the contact zone, we stimulated cells using AF546-mB-Fab’-anti-Ig to coat the bilayer. This system is also known to induce robust BCR activation and signaling (25). Although streptavidin again formed distinct clusters in the center of the B cell contact region, the MFI in the contact region did not show as large an increase (Fig. S3), indicating that the accumulation of mobile streptavidin alone is not sufficient for the increase in BCR clustering. Further, we verified that photobleaching was minimal during our time-lapse imaging and similar on both glass and bilayer (Fig. S4). Taken together, these results suggest that the increase in BCR fluorescence intensity, corresponding to BCR accumulation and the formation of receptor clusters, is a specific response to interactions of the BCR with stimulating ligand, and that the level of BCR clustering is regulated by ligand mobility.
We next asked whether the differences in receptor accumulation on lipid bilayer and glass influenced BCR signaling activation. We examined the differences in the levels of signaling by measuring the phosphotyrosine (pY) levels. We allowed A20 B cells to interact with ligand on glass and lipid bilayer substrates for various lengths of time, immuno-stained for pY after fixation, and analyzed the spatial pattern of tyrosine phosphorylation at the cell contact zone. pY staining of B cells rapidly arose at 2 min in a similar manner on both the lipid bilayer (Fig. 2 A) and the glass (Fig. 2 B) forming loci that became more numerous over time. However, on bilayer substrates, pY loci became brighter and larger than those on the glass. The MFI of pY was greater in the contact zone of B cells on the bilayer than those on glass at all time points, but both reached their peaks at 6 min. BCR clusters on the bilayer appeared to organize into a recognizable immune synapse (Fig. 2 C) and began to decrease at 8 min. We further quantified the signaling levels in individual clusters using an intensity threshold. Consistent with the pY levels in the B cell contact zone, the MFI of individual pY clusters for B cells on bilayer surfaces was higher than that on glass substrates (Fig. 2 D).
Figure 2.

Signaling levels are affected by ligand mobility. (A, B) TIRF images of phosphotyrosine (pY) staining for cells spreading on supported lipid bilayer (A) or glass (B) substrates and fixed at the indicated times after surface engagement. (C) Mean fluorescence intensity (MFI) of pY staining of cells (Bilayer N>21; Glass N>15) spread on a supported lipid bilayer (dark gray) and glass (light gray) surface at the indicated time points, plotted with standard error. The differences were statistically significant for all time points except at 2 min (p<0.001; t-test). (D) Comparison of mean fluorescence intensity (per pixel of cell contact area) of pY labeled clusters for cells fixed at 6 minutes (N = 32 bilayer and N = 29 glass) activated on bilayer and glass surfaces. Mean intensities were significantly higher for cells on the bilayer surface (p<0.001; t- test).
Effect of ligand mobility on BCR microcluster formation, dynamics, and signaling
BCR signaling proceeds by the aggregation of BCRs within the contact zone into microclusters and the subsequent induction of downstream signaling pathways (8,27). The enhanced levels of BCR signaling in response to mobile ligands compared with immobile ones may arise because of differences in BCR clustering. To test whether ligand mobility influenced microcluster formation, we performed a detailed analysis of BCR cluster dynamics. We identified BCR clusters with custom software (see Methods) by fitting a Gaussian profile to an intensity distribution above a predefined threshold. The peak of the Gaussian corresponds to the brightness of the cluster and is proportional to the amount of receptors accumulated in the cluster (Fig. S5), whereas the location of the cluster corresponds to the position of the peak. We show representative TIRF images of clusters on the bilayer and glass surface respectively in Fig. 3, A and B and the spatial maps of the fluorescence intensity at each pixel and the corresponding Gaussian fits to the three-dimensional intensity map in Fig. 3, C–F. The peak intensity is higher for clusters in B cells on bilayer than for those on glass. Accordingly, the average peak intensity of BCR clusters on bilayers was significantly larger than those on glass substrates (Fig. 3 G). Further, the ratio of the peak intensity of clusters to the MFI over the cell contact area was significantly higher for B cells on the bilayer surface than for those on glass (Fig. 3 H). We also found that the number of BCR clusters tracked during 8 min time-lapse movies to be significantly lower on the glass than on the bilayer substrate (Fig. 3 I). Taken together, these results suggest that BCR accumulation and cluster formation is more efficient when cells interact with mobile ligands than with immobilized ligands.
Figure 3.

BCR cluster formation is distinct on bilayer and glass surfaces. (A, B) Representative TIRF images of two clusters in a cell spreading on a bilayer surface (A) and a glass surface (B). (C, D) Color maps with the color corresponding to the pixelwise fluorescence intensity of each of the clusters on bilayer (C) and glass (D). (E, F) Gaussian fits to the pixelwise intensity data in C and D. Scale bars denote 50 AU. (G) Comparison of the peak intensity of BCR clusters on glass versus bilayer substrates. Peak intensities on bilayer were significantly larger than on glass (N=8850 clusters, bilayer; N=4917 clusters, glass; p<0.001; KS-test). (H) The ratio of peak fluorescence intensity of clusters to the mean intensity over the cell contact area was significantly larger for bilayer as compared to glass substrates (N=37 cells, bilayer; N=26 cells, glass; p<0.01;t-test). (I) Average number of clusters detected and tracked per cell on glass versus bilayer substrates. The bilayer surface had significantly higher number of clusters (N=23 for both; p<0.001, t-test).
The formation of BCR clusters is critical for the initiation of signaling and antigen gathering (7,15,20,24). To quantitatively compare the dynamics of BCR clusters on the different surfaces, we identified and tracked individual BCR clusters from time-lapse images, and calculated ensemble statistics of BCR cluster behavior. We categorized these tracks into three groups, “short” (less than 0.6 μm), “medium” (less than 1.2 μm), or “long distance” (greater than 1.2 μm). Fig. 4, A–C show time-lapse TIRF images of three representative clusters, long, medium, and short, with the calculated track coordinates superimposed on the images. To obtain a wider view of the cluster tracks, a representative selection of BCR cluster tracks are superimposed on a TIRF image of B cells on lipid bilayer (Fig. 4 D) and glass substrates (Fig. 4 E), respectively. Representative medium- and long-distance tracks of each type are plotted with the cell contour at 8 min for a cell on bilayer (Fig. 4 F) and glass (Fig. 4 G).
Figure 4.

BCR cluster dynamics depends on ligand mobility. (A, B, C) Time-lapse TIRF images of representative BCR clusters in cells spread on bilayer substrates. The calculated track is overlaid at each time point and corresponds to a “long” (A), medium (B), and a short track (C). Scale bars: 1μm. (D, E) Representative selection of cluster tracks (red) superimposed on TIRF images of fluorescently labeled BCR taken at 6 minutes after the initiation of spreading on bilayer (D) and on glass (E). (F, G) Example medium distance and long distance cluster tracks from eight minutes of imaging (red) superimposed on the outline of a representative cell on bilayer (F) and glass (G). (H) Histograms of the total distance traveled by tracked clusters on bilayer (blue) and glass (red), superimposed for comparison. Smooth curves represent the cumulative distribution of distances traveled on the two types of substrates, bilayer (blue) and glass (red). The difference between the two distributions is statistically significant (p<0.001; KS test). (I) Peak intensity of each cluster plotted against its average velocity (total distance traveled divided by the total time taken) for all tracked clusters on bilayer (blue) and glass substrates (red). (J) Comparison of the different types of cluster events, i.e. number of clusters that end or merge on bilayer (blue) versus glass (red) (Merge: p<0.01; t-test). (K) The ratio of peak intensities from the end to the beginning of each cluster track for clusters moving on bilayer (blue) versus a glass (red) surface (p<0.001; t-test). The number of clusters examined were N=8850 bilayer; N=4917 glass.
The fraction of mobile clusters (medium and long distance) was larger in B cells on the bilayer surface (30%) than that in B cells on the glass surface (10%). The ligand on glass surface generated a higher percentage (> 90%) of short distance clusters as compared to the bilayer surface (70%). The track lengths of BCR clusters show a heavier tailed distribution for tracks on the supported lipid bilayer surface than on glass (Fig. 4 H), indicating a preponderance of longer cluster tracks on the bilayer substrate. These data suggest that BCR clusters induced by mobile ligand traverse longer distances than those induced by immobile ligand. We found an inverse correlation between peak intensity of clusters and their average velocity (defined as the total distance traveled divided by the total time taken, Fig. 4 I), indicating that highly mobile clusters are likely to contain less BCR than slower-moving ones. We next quantified the fate of BCR clusters on the two substrates. Cluster tracks may end in one of two ways: ceasing to be tracked by disappearing from the field or by reaching the end of the movie (“end”), or joining another cluster (“merge”). On the bilayer substrate, BCR clusters had a significantly higher probability of merging with one another as compared with the glass substrate (Fig. 4 J; N = 23 cells). These results are consistent with earlier studies that postulate a diffusion-trap model of BCR microcluster growth, wherein microclusters form and enlarge by binding diffusing receptors (28,29). To examine how BCR accumulation within clusters was affected by ligand mobility, we quantified the ratio of the peak intensity at the end of a track to the peak at the start of the track (representing the change in BCR density over time). This ratio was also significantly higher for clusters induced by mobile ligand as compared to those by immobile ligand (Fig. 4 K). These results indicate that mobile ligands presented on membranes enable more efficient recruitment of BCRs into preexisting clusters.
To ensure that the differences shown above were not specific to the A20 B cell line, we examined cell spreading and BCR clustering of mouse splenic B cells. These were labeled with AF546-mB-Fab’-anti-Ig and activated by streptavidin-coated glass and lipid bilayers in the same way as the A20 cells. Time-lapse TIRF images of spreading primary B cells show the formation of BCR clusters on both glass and bilayer surfaces (Fig. 5, A and B). Primary B cells spread to a greater extent on glass as compared with bilayer, (Fig. 5 C) similar to the A20 cells. The MFI of labeled BCR at the contact zone was significantly higher for cells on the bilayer as compared with the glass surface (Fig. 5 D). The average peak intensity of clusters was significantly higher for clusters induced by the bilayer surface as compared with those induced by the glass surface (Fig. 5 E), demonstrating that ligand mobility enabled clusters to recruit a larger amount of receptor/antigen pairs.
Figure 5.
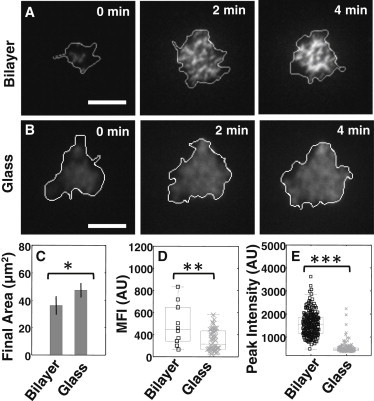
Spreading and BCR clustering in mouse primary B cells. (A) Time-lapse TIRF images of AF546 labeled BCR clusters in a primary B cell on a supported lipid bilayer. Cell contour obtained from IRM imaging is shown in white. (B) Time-lapse TIRF images of BCR clusters in a primary B cell spreading on glass. Scale bars are 5μm. (C) Final spread areas (mean ±s.e.) for cells spreading on glass (N=27) and bilayer (N=17). The final area on glass surfaces was significantly larger than those on bilayer surfaces (p<0.05; T-test). (D) Comparison of mean fluorescence intensity (MFI) of labeled BCR at the cell surface contact zone at 8 minutes for bilayer (N=10) and glass (N=48). MFI on bilayer surfaces was found to be significantly greater than that on glass (p<0.01; t-test). (E) Comparison of peak intensities of BCR clusters on bilayer versus glass substrates. Peak intensities were significantly higher on bilayer surfaces (N=928 bilayer; N=2463 glass; p<0.001; KS-test).
Actin organization with respect to BCR and receptor cluster formation and signaling
The actin cytoskeleton is known to play an important role in BCR organization and activation at the B cell surface (19,23,30). To test the effect of ligand mobility on actin dynamics and organization with respect to BCR clusters, we used dual color time-lapse imaging of A20 cells expressing EGFP-actin and labeled surface BCRs. As the cell spread, actin formed localized patches throughout the contact zone and distinct lamellipodia with retrograde actin flow during the later stages of spreading. We analyzed the relationship between the dynamics of BCR clusters and local actin patches. Actin patches often formed in close proximity to BCR clusters. On glass surfaces, these patches remained near the BCR clusters but were typically immobile (Fig. 6 A) , as shown by the peaks of the intensity profiles of actin and BCR cluster (representing their location), which do not move over time (Fig. 6 B). On the other hand, actin patches associated with BCR clusters induced by ligand on lipid bilayer moved concurrently with BCR clusters as shown by the movement of the two intensity peaks (Fig. 6, C and D). Quantitative analysis showed that they moved with similar average speeds (4.2 μm/min, n = 10 cells, p > 0.1). These results suggest that actin dynamics coordinate with the movement of BCR clusters induced by mobile ligands.
Figure 6.

Actin dynamics are distinct on bilayer and glass substrates. (A) Time lapse dual wavelength TIRF images of a representative BCR cluster (red) and an EGFP-actin patch (green) on a glass surface. Images are separated in time by 3 sec intervals. Scale bar is 1 μm. (B) Intensity profiles measured along the line drawn on the top panel. The peaks corresponding to the center of the BCR cluster (solid line) and actin patch (dashed line) show no net movement. (C) Time lapse dual wavelength TIRF images of a representative BCR cluster (red) and an EGFP-actin patch (green) on a bilayer surface. Images are separated by 6 sec intervals. Scale bar is 1 μm. (D) Intensity profiles measured along the line drawn on the top panel. The peaks corresponding to the center of the BCR cluster (solid line) and actin patch (dashed line) show a net movement (1.5 μm) away from the cell center. (E) Histograms of the total distance traveled by tracked BCR clusters (blue) and actin patches (green) on a bilayer surface, superimposed for comparison. Smooth curves represent the cumulative distribution of distances traveled by BCR clusters (blue; N=8850) and actin patches (green; N=1610). (F) Histograms of the total distance traveled by tracked BCR clusters (red; N=4917) and actin patches (green; N=2843) on a glass surface, superimposed for comparison. Smooth curves represent the cumulative distribution of distances traveled by BCR clusters (red) and actin patches (green).
To further elucidate the relationship between actin patches and BCR cluster dynamics, we tracked a large number of moving actin patches and BCR clusters. We generated the histograms of distances traveled by actin patches and BCR clusters induced by mobile and immobile ligands (Fig. 6, E and F), and quantified the distributions using the Kullback-Leibler distance (KLD) (31), a measure of similarity of two probability distributions. On bilayer substrates, the actin patches and BCR clusters had very similar distributions, indicating that they moved similar amounts (KLD = 0.0232), whereas the actin patches were considerably more mobile than BCR clusters on glass substrates (KLD = 0.2034). Taken together, our results suggest that on bilayer surfaces, actin and BCR movements are coupled, whereas on glass surfaces they are not.
We next examined whether the differences that we observed on the localized movement of BCR and actin resulted in global differences in spatial organization of actin. In the early stages of activation and spreading, actin patches were interspersed with early BCR clusters in the B cell contact zone on both bilayer and glass surfaces (Fig. 7, A and B, 2 min). As cells spread on the bilayer surface and BCR clusters merged into larger clusters, the actin was observed to surround larger aggregates of BCR clusters (Fig. 7 A, 8 min). In contrast, on the glass surface, actin patches remained interspersed randomly with BCR clusters (Fig. 7 B, time 8 min). To correlate actin distribution with receptor signaling, we analyzed the spatial relationship between actin and pY staining. On the bilayer substrate, actin patches appeared to surround the pY rich regions (Fig. 7, C and D), whereas on the glass substrate pY signaling loci were largely colocalized with actin patches (Fig. 7, E and F). We quantified the pixelwise Pearson’s correlation coefficient for localization of actin and pY in B cells on glass (N = 16) and bilayer (N = 21) at 6 min (Fig. 7 G). There was a significantly higher degree (p < 0.05) of anticorrelation between the actin and pY in cells on the bilayer surface than those on glass. On bilayer surfaces, the localization pattern of pY in relation to actin (Fig. 7 C) was qualitatively similar to the pattern of BCR with relation to actin (Fig. 7 A). This is consistent with previous studies showing that pY staining strongly colocalizes with BCR fluorescence (24). These results indicate that the dynamic actin cytoskeleton may regulate BCR signaling capability by modulating the mesoscale movement and spatial organization of BCR clustering.
Figure 7.

Actin organization is distinct on bilayer and glass substrates. (A) Time-lapse images using dual wavelength TIRF of EGFP-actin (green) cells where BCR were labeled with AF546-Ab (red) spreading on a supported lipid bilayer substrate show formation of BCR clusters and actin organization around the clusters. (B) Dual wavelength TIRF images of cells spreading on a glass substrate show the formation of clusters but a lack coordination of the actin cytoskeleton with BCR clusters. Scale bars are 5 μm. (C, E) Images of cells spread on bilayer (C) and glass (E) at 6 minutes with EGFP-actin (green) and pY staining (red). Intensity profiles along the lines drawn in yellow for bilayer (D) and glass (F) respectively. pY and actin are plotted on different scales. (G) Pearson’s correlation coefficient for two color images (GFP- actin and pY) on glass (N=16) and bilayer (N=21) for the area of cell contact at 6 min. The distributions were found to be significantly different (p< 0.05, t-test).
Given our observations that the movement of BCR clusters on the bilayer surface was coordinated with movement of actin patches, we hypothesized that actin polymerization may provide the driving force for these movements. To test this hypothesis, we treated cells with Latrunculin-A (Lat-A), a drug that sequesters actin monomers and promotes actin depolymerization, after the initial formation of BCR microclusters. We allowed A20 cells to spread for 2 to 3 min and form mobile clusters. We then added Lat-A to the imaging well at a final concentration of 100 nM, whereupon we found that the movement of BCR clusters decreased dramatically on the bilayer surface. The tracks of cluster movements were much shorter in the presence of Lat-A as compared to the control (Fig. 8, A and B). Quantitative analysis of cluster tracks revealed that movement of BCR clusters on bilayer substrates was affected to a greater degree by Lat-A as compared to the movement on glass substrates. This is shown by the larger difference (KLD) between the distance distributions of tracks with and without Lat-A on the bilayer surface (KLD = 1.0732) (Fig. 8 C) compared with that on glass substrates (KLD = 0.0575) (Fig. 8 D). Consistent with this, BCR clusters in B cells on bilayers moved significantly smaller distances upon Lat-A application, as compared with those in untreated cells (Fig. S6 A). In contrast, the mean distance moved by BCR clusters in cells on glass substrates were much less affected by application (Fig. S6 A). Furthermore, the average velocity of BCR clusters on bilayer surfaces was significantly lowered by Lat-A application, whereas the average velocity of clusters on glass increased in the presence of Lat-A (Fig. 8 E). These data indicate that actin polymerization plays a more active role in the movement of BCR clusters on the bilayer surface that those on the glass. Further, we observed that upon Lat-A addition, the MFI of the BCR in the cell substrate contact zone (a measure of receptor accumulation) significantly decreased in cells on bilayer, but not in cells on glass surfaces (Fig. 8 F), suggesting that receptor accumulation on the glass substrate occurred independently of actin coordination. To examine whether actin polymerization was required for clustering efficiency, we compared the end-to-beginning ratio of the peak cluster intensities for cluster tracks in the presence and absence of Lat-A on the two surfaces. The end/begin ratio of peak intensities was significantly decreased upon Lat-A addition for clusters on bilayer surface, but much less affected for clusters on glass surface (Fig. S6 B). This indicates that inhibition of actin polymerization reduced the efficiency of cluster formation in cells interacting with mobile ligand. Our results indicate that cluster growth and mobility in response to mobile ligands, but not to immobile ligands, are driven by active polymerization of actin.
Figure 8.

Role of actin polymerization in BCR movement. (A) Representative cluster tracks superimposed on a cell contour for a cell spreading on bilayer in the absence of Lat-A. (B) Representative cluster tracks superimposed on a cell contour for a cell spreading on bilayer in the presence of 100 nM Lat-A. (C) Histograms of the total distance traveled by BCR clusters in the absence of Lat-A (blue) and in the presence of 100 nM Lat-A (green) on a bilayer surface. Smooth curves represent the corresponding cumulative distributions. (D) Histograms of the total distance traveled by BCR clusters in the absence of Lat-A (red) and in the presence of 100 nM Lat-A (green) on a glass surface. Smooth curves represent the corresponding cumulative distributions. (E) Mean of the average velocity of BCR clusters on a bilayer surface in the absence of Lat-A (- Lat) is significantly higher than the velocity in the presence of Lat-A (+ Lat) (p<0.001; KS-test). Average velocity of BCR clusters on a glass surface is lower in the absence (– Lat) than in the presence of 100 nM Lat-A (+Lat). (F) The ratio of mean fluorescence intensity (over the entire contact area) from the end to the beginning of time lapse movies (ranging from 2– 5 min in duration) for glass and bilayer surfaces in the absence and presence of Lat-A. The mean ratio is significantly lower in Lat-A for cells spreading on bilayer surface (N=23, -Lat; N=38 +Lat; p<0.001; t-test).
Discussion
The clustering of surface BCRs has been shown to initiate signaling upon contact with surface-bound antigens (32,33). BCR proximal signaling, in turn, activates actin reorganization and further cell spreading, providing a positive feedback by promoting BCR clustering. These discrete receptor clusters appear to be a common feature of lymphocyte activation and thus may represent the basic unit of signaling. How these signaling assemblies are organized is critical for understanding lymphocyte signaling and activation. We have investigated the role of antigen mobility in regulating BCR signaling activation. We find that physical constraints on the mobility of the activating cross-linking agent not only alters spreading behavior of B cells, but also clustering dynamics of surface BCRs, and signaling activation. When interacting with the mobile ligand on lipid bilayer substrates, BCR microclusters are mobile and prefer to grow and merge with each other, forming larger clusters with enhanced pY signaling. In contrast, BCR clusters induced by the immobile ligand on glass remain small, unstable, and dispersed, leading to inefficient signaling. These results indicate that BCR signaling is promoted by the formation of relatively large and stable supramolecular clusters, and ligand mobility regulates BCR signaling by modulating dynamic reorganization of BCRs at the cell surface.
In B cells stimulated by immobile ligands, most BCR clusters were immobile but a smaller fraction of clusters appear to be highly mobile. Since ligands are immobile on glass, these mobile clusters are unlikely to be engaged with ligands during their movement, suggesting that unbound BCR can self-cluster. Such ligand-free BCR clusters have been shown to form in B cells treated with Latrunculin (19,28), but grow to a limited extent and are less signaling competent than those induced by ligand binding. In response to ligand binding, the early BCR signaling induces a transient depolymerization of cortical actin and detachment of the membrane from the cortical actin (24). This actin disassembly releases membrane proteins from lateral mobility barriers and allows BCR movement and organization into clusters (20). The transient depolymerization of actin potentially leads to the formation of the mobile clusters that we observed in B cells on glass.
The actin cytoskeleton is well known to play an important role in B cell signaling (30). Previous studies have shown that perturbing the cortical actin network interferes with BCR aggregation, cell spreading, and signaling (19,20,23). Although the importance of an intact actin cytoskeleton in BCR signaling is well known, the role of actin polymerization on BCR dynamics has not been explored. In this study, we found that mobile and immobile ligands induce actin remodeling in distinct ways. Actin patches colocalize and move laterally for relatively long distances with BCR clusters formed in response to mobile ligands. However, in response to immobile ligands, the actin patches are uncorrelated with BCR and move shorter distances. These results suggest that actin dynamics may facilitate the long-range movement and coalescence of BCR clusters. Further, the movement and intensity of BCR clusters on bilayer surfaces is reduced by inhibition of actin polymerization indicating a role for actin polymerization in cluster movement. Our results together suggest an active role for actin cytoskeleton dynamics in driving BCR movement, leading to further growth of BCR microclusters. BCR signaling is known to activate key activators of actin nucleation factors, which, in turn, may allow actin polymerization to actively drive the surface BCRs and facilitate their clustering. Recent modeling studies using stochastic simulations of the dynamics of BCR and LFA1 molecules suggest that the formation of the synapse occurs only if BCR mobility is enhanced by directed movement as might occur because of actin polymerization (34). These models and our observations together suggest that local BCR signaling to actin regulators lead to actin polymerization and directed motility of clusters, which facilitates BCR aggregation into larger clusters, enhancing signaling (25). Whether the activation of actin regulators differs with ligand mobility remains to be explored.
In summary, our results show that ligand mobility influences the cell spreading behavior and BCR organization and signaling on the surface of B cells. Several recent studies have emphasized the role of ligand mobility on intracellular signaling in immune cells including FcεRI signaling in mast cells (35) and TCR signaling in T cells (3,36). Our results suggest that the spatial reorganization of microclusters may be a general theme of immunoreceptor signaling. Furthermore, in addition to tuning the diffusion dynamics of BCRs during early signaling (20,24), the actin cytoskeleton plays an active role in the fusion and translocation of receptor clusters, amplifying signaling. The clinical implication of our findings is that vaccine design with mobile antigens, such as viral proteins on liposomes, is likely to be more effective than immobile antigens where the viral proteins immobilized on hydrogels to activate B cells for antibody response. Our results thus provide the knowledge basis for improving immunogenicity of vaccines by manipulating the physical form of antigen.
Acknowledgments
We thank Brian Grooman for help with image analysis and Ming Zhang for technical assistance.
This work was supported by the National Science Foundation (NSF grant numbers 1121710 and 1206060 to AU), the NSF ADVANCE program award to Au and WS, and the ARCS fellowship to CK.
Supporting Material
References
- 1.Lohmüller T., Xu Q., Groves J.T. Nanoscale obstacle arrays frustrate transport of EphA2-Ephrin-A1 clusters in cancer cell lines. Nano Lett. 2013;13:3372–3378. doi: 10.1021/nl400874v. [DOI] [PMC free article] [PubMed] [Google Scholar]
- 2.Manz B.N., Groves J.T. Spatial organization and signal transduction at intercellular junctions. Nat. Rev. Mol. Cell Biol. 2010;11:342–352. doi: 10.1038/nrm2883. [DOI] [PMC free article] [PubMed] [Google Scholar]
- 3.Mossman K.D., Campi G., Dustin M.L. Altered TCR signaling from geometrically repatterned immunological synapses. Science. 2005;310:1191–1193. doi: 10.1126/science.1119238. [DOI] [PubMed] [Google Scholar]
- 4.Salaita K., Nair P.M., Groves J.T. Restriction of receptor movement alters cellular response: physical force sensing by EphA2. Science. 2010;327:1380–1385. doi: 10.1126/science.1181729. [DOI] [PMC free article] [PubMed] [Google Scholar]
- 5.Selhuber-Unkel C., Erdmann T., Spatz J.P. Cell adhesion strength is controlled by intermolecular spacing of adhesion receptors. Biophys. J. 2010;98:543–551. doi: 10.1016/j.bpj.2009.11.001. [DOI] [PMC free article] [PubMed] [Google Scholar]
- 6.Cavalcanti-Adam E.A., Volberg T., Spatz J.P. Cell spreading and focal adhesion dynamics are regulated by spacing of integrin ligands. Biophys. J. 2007;92:2964–2974. doi: 10.1529/biophysj.106.089730. [DOI] [PMC free article] [PubMed] [Google Scholar]
- 7.Batista F.D., Dustin M.L. Cell:cell interactions in the immune system. Immunol. Rev. 2013;251:7–12. doi: 10.1111/imr.12025. [DOI] [PubMed] [Google Scholar]
- 8.Harwood N.E., Batista F.D. Early events in B cell activation. Annu. Rev. Immunol. 2010;28:185–210. doi: 10.1146/annurev-immunol-030409-101216. [DOI] [PubMed] [Google Scholar]
- 9.Junt T., Moseman E.A., von Andrian U.H. Subcapsular sinus macrophages in lymph nodes clear lymph-borne viruses and present them to antiviral B cells. Nature. 2007;450:110–114. doi: 10.1038/nature06287. [DOI] [PubMed] [Google Scholar]
- 10.Pape K.A., Catron D.M., Jenkins M.K. The humoral immune response is initiated in lymph nodes by B cells that acquire soluble antigen directly in the follicles. Immunity. 2007;26:491–502. doi: 10.1016/j.immuni.2007.02.011. [DOI] [PubMed] [Google Scholar]
- 11.Phan T.G., Gray E.E., Cyster J.G. The microanatomy of B cell activation. Curr. Opin. Immunol. 2009;21:258–265. doi: 10.1016/j.coi.2009.05.006. [DOI] [PMC free article] [PubMed] [Google Scholar]
- 12.Suzuki K., Grigorova I., Cyster J.G. Visualizing B cell capture of cognate antigen from follicular dendritic cells. J. Exp. Med. 2009;206:1485–1493. doi: 10.1084/jem.20090209. [DOI] [PMC free article] [PubMed] [Google Scholar]
- 13.Unanue E.R., Perkins W.D., Karnovsky M.J. Ligand-induced movement of lymphocyte membrane macromolecules. I. Analysis by immunofluorescence and ultrastructural radioautography. J. Exp. Med. 1972;136:885–906. doi: 10.1084/jem.136.4.885. [DOI] [PMC free article] [PubMed] [Google Scholar]
- 14.Batista F.D., Iber D., Neuberger M.S. B cells acquire antigen from target cells after synapse formation. Nature. 2001;411:489–494. doi: 10.1038/35078099. [DOI] [PubMed] [Google Scholar]
- 15.Tolar P., Sohn H.W., Pierce S.K. The initiation of antigen-induced B cell antigen receptor signaling viewed in living cells by fluorescence resonance energy transfer. Nat. Immunol. 2005;6:1168–1176. doi: 10.1038/ni1262. [DOI] [PubMed] [Google Scholar]
- 16.Tolar P., Hanna J., Pierce S.K. The constant region of the membrane immunoglobulin mediates B cell-receptor clustering and signaling in response to membrane antigens. Immunity. 2009;30:44–55. doi: 10.1016/j.immuni.2008.11.007. [DOI] [PMC free article] [PubMed] [Google Scholar]
- 17.Harwood N.E., Batista F.D. Visualizing the molecular and cellular events underlying the initiation of B-cell activation. Curr. Top. Microbiol. Immunol. 2009;334:153–177. doi: 10.1007/978-3-540-93864-4_7. [DOI] [PubMed] [Google Scholar]
- 18.Fleire S.J., Goldman J.P., Batista F.D. B cell ligand discrimination through a spreading and contraction response. Science. 2006;312:738–741. doi: 10.1126/science.1123940. [DOI] [PubMed] [Google Scholar]
- 19.Liu C., Miller H., Song W. Actin reorganization is required for the formation of polarized B cell receptor signalosomes in response to both soluble and membrane-associated antigens. J. Immunol. 2012;188:3237–3246. doi: 10.4049/jimmunol.1103065. [DOI] [PMC free article] [PubMed] [Google Scholar]
- 20.Treanor B., Depoil D., Batista F.D. Dynamic cortical actin remodeling by ERM proteins controls BCR microcluster organization and integrity. J. Exp. Med. 2011;208:1055–1068. doi: 10.1084/jem.20101125. [DOI] [PMC free article] [PubMed] [Google Scholar]
- 21.Bajénoff M., Germain R.N. B-cell follicle development remodels the conduit system and allows soluble antigen delivery to follicular dendritic cells. Blood. 2009;114:4989–4997. doi: 10.1182/blood-2009-06-229567. [DOI] [PMC free article] [PubMed] [Google Scholar]
- 22.Szakal A.K., Kosco M.H., Tew J.G. A novel in vivo follicular dendritic cell-dependent iccosome-mediated mechanism for delivery of antigen to antigen-processing cells. J. Immunol. 1988;140:341–353. [PubMed] [Google Scholar]
- 23.Hao S., August A. Actin depolymerization transduces the strength of B-cell receptor stimulation. Mol. Biol. Cell. 2005;16:2275–2284. doi: 10.1091/mbc.E04-10-0881. [DOI] [PMC free article] [PubMed] [Google Scholar]
- 24.Treanor B., Depoil D., Batista F.D. The membrane skeleton controls diffusion dynamics and signaling through the B cell receptor. Immunity. 2010;32:187–199. doi: 10.1016/j.immuni.2009.12.005. [DOI] [PMC free article] [PubMed] [Google Scholar]
- 25.Liu C., Miller H., Song W. A balance of Bruton’s tyrosine kinase and SHIP activation regulates B cell receptor cluster formation by controlling actin remodeling. J. Immunol. 2011;187:230–239. doi: 10.4049/jimmunol.1100157. [DOI] [PMC free article] [PubMed] [Google Scholar]
- 26.Jaqaman K., Loerke D., Danuser G. Robust single-particle tracking in live-cell time-lapse sequences. Nat. Methods. 2008;5:695–702. doi: 10.1038/nmeth.1237. [DOI] [PMC free article] [PubMed] [Google Scholar]
- 27.Liu W., Won Sohn H., Pierce S.K. Antigen-induced oligomerization of the B cell receptor is an early target of Fc gamma RIIB inhibition. J. Immunol. 2010;184:1977–1989. doi: 10.4049/jimmunol.0902334. [DOI] [PMC free article] [PubMed] [Google Scholar]
- 28.Mattila P.K., Feest C., Batista F.D. The actin and tetraspanin networks organize receptor nanoclusters to regulate B cell receptor-mediated signaling. Immunity. 2013;38:461–474. doi: 10.1016/j.immuni.2012.11.019. [DOI] [PubMed] [Google Scholar]
- 29.Treanor B., Batista F.D. Organisation and dynamics of antigen receptors: implications for lymphocyte signalling. Curr. Opin. Immunol. 2010;22:299–307. doi: 10.1016/j.coi.2010.03.009. [DOI] [PubMed] [Google Scholar]
- 30.Harwood N.E., Batista F.D. The cytoskeleton coordinates the early events of B-cell activation. Cold Spring Harb. Perspect. Biol. 2011;3:a002360. doi: 10.1101/cshperspect.a002360. [DOI] [PMC free article] [PubMed] [Google Scholar]
- 31.Cover T.M., Thomas J.A. Wiley-Interscience; Hoboken, NJ: 2006. Elements of information theory. [Google Scholar]
- 32.Depoil D., Fleire S., Batista F.D. CD19 is essential for B cell activation by promoting B cell receptor-antigen microcluster formation in response to membrane-bound ligand. Nat. Immunol. 2008;9:63–72. doi: 10.1038/ni1547. [DOI] [PubMed] [Google Scholar]
- 33.Weber M., Treanor B., Batista F.D. Phospholipase C-gamma2 and Vav cooperate within signaling microclusters to propagate B cell spreading in response to membrane-bound antigen. J. Exp. Med. 2008;205:853–868. doi: 10.1084/jem.20072619. [DOI] [PMC free article] [PubMed] [Google Scholar]
- 34.Tsourkas P.K., Raychaudhuri S. Modeling of B cell synapse formation by Monte Carlo simulation shows that directed transport of receptor molecules is a potential formation mechanism. Cell. Mol. Bioeng. 2010;3:256–268. doi: 10.1007/s12195-010-0123-1. [DOI] [PMC free article] [PubMed] [Google Scholar]
- 35.Carroll-Portillo A., Spendier K., Timlin J.A. Formation of a mast cell synapse: Fc epsilon RI membrane dynamics upon binding mobile or immobilized ligands on surfaces. J. Immunol. 2010;184:1328–1338. doi: 10.4049/jimmunol.0903071. [DOI] [PMC free article] [PubMed] [Google Scholar]
- 36.Hsu C.J., Hsieh W.T., Baumgart T. Ligand mobility modulates immunological synapse formation and T cell activation. PLoS ONE. 2012;7:e32398. doi: 10.1371/journal.pone.0032398. [DOI] [PMC free article] [PubMed] [Google Scholar]
Associated Data
This section collects any data citations, data availability statements, or supplementary materials included in this article.