

Abstract
Pancreatic islets of Langerhans regulate blood glucose homeostasis by the secretion of the hormone insulin. Like many neuroendocrine cells, the coupling between insulin-secreting β-cells in the islet is critical for the dynamics of hormone secretion. We have examined how this coupling architecture regulates the electrical dynamics that underlie insulin secretion by utilizing a microwell-based aggregation method to generate clusters of a β-cell line with defined sizes and dimensions. We measured the dynamics of free-calcium activity ([Ca2+]i) and insulin secretion and compared these measurements with a percolating network model. We observed that the coupling dimension was critical for regulating [Ca2+]i dynamics and insulin secretion. Three-dimensional coupling led to size-invariant suppression of [Ca2+]i at low glucose and robust synchronized [Ca2+]i oscillations at elevated glucose, whereas two-dimensional coupling showed poor suppression and less robust synchronization, with significant size-dependence. The dimension- and size-scaling of [Ca2+]i at high and low glucose could be accurately described with the percolating network model, using similar network connectivity. As such this could explain the fundamentally different behavior and size-scaling observed under each coupling dimension. This study highlights the dependence of proper β-cell function on the coupling architecture that will be important for developing therapeutic treatments for diabetes such as islet transplantation techniques. Furthermore, this will be vital to gain a better understanding of the general features by which cellular interactions regulate coupled multicellular systems.
Introduction
Regulated secretion of the hormones insulin and glucagon from the pancreatic islets of Langerhans is critical for the regulation of glucose homeostasis. Glucose-stimulated insulin secretion (GSIS) from β-cells in the islet includes the metabolism of glucose via glycolysis and oxidative phosphorylation to elevate ATP (Adenosine triphosphate) levels; membrane depolarization after ATP-sensitive potassium (KATP) channel inhibition; and elevated intracellular free-calcium activity ([Ca2+]i) that triggers insulin granule exocytosis. Membrane depolarization and [Ca2+]i are highly dynamic, exhibiting regular oscillations at elevated glucose that drive pulsatile insulin release (1,2). Pulsatile insulin has been shown to be more effective at lowering blood glucose (3,4), and these pulses are disrupted during the development of type 2 diabetes (5,6). Therefore, the oscillatory dynamics of electrical activity within the islet are important for glucose homeostasis.
β-cells are extensively coupled within the islet and it has long been known that they show a more enhanced and coordinated GSIS compared with isolated β-cells (7,8). Connexin36 (Cx36) gap junction channels couple the membrane potential between neighboring β-cells, which coordinates the oscillations in membrane depolarization and [Ca2+]i at elevated glucose (9,10), and suppresses spontaneous elevations in [Ca2+]i at basal glucose (11-13). A disruption to islet gap junction coupling and coordinated [Ca2+]i oscillations disrupts the pulsatile dynamics of insulin secretion and, consequently, glucose homeostasis (14). Similarly, islets from obese and diabetic mouse models show disrupted gap junction coupling and a lack of coordinated [Ca2+]i oscillations (15,16). Although the role of gap junction coupling strength has been examined, to date no study has experimentally examined how the architecture of coupling within the islet shapes the islet response.
Computational models have been developed to understand the electrical and metabolic dynamics within the islet (17), and a few studies have developed multicellular models to examine how the coupling between β-cells affects the islet electrical response. These include the formation of regular coordinated [Ca2+]i oscillations (9,18); the emergence of propagating calcium waves (9,19); the suppression of heterogeneous β-cell excitability (20), and the impact of different coupling lattices (21). Coordinated [Ca2+]i dynamics and propagating calcium waves also feature more broadly in other multicellular systems. Although studies have found that architecture can affect overall function, dynamical complexity, node diversity, and coupling heterogeneity make analysis of multicellular systems and their behavior difficult to understand. Approximations to analyze specific aspects of the overall system can yield greater understanding (22,23). For example, details of cellular dynamics can be separated from the system architecture (24), allowing general architectural features such as ordered/disordered coupling or network branching to be examined. A lattice-resistor–based network model previously approximated functional interactions between cells as Boolean rather than a continuum of connection strengths. With this approximation, network behavior could be readily analyzed to quantitatively describe changes in multicellular behavior after disruptions to Cx36 gap junction coupling (9), including the synchronization of [Ca2+]i oscillations and the velocity of propagating calcium waves. Furthermore, this model predicted “a phase transition” at certain levels of gap junction coupling, where the islet transitions sharply from synchronized behavior to independent behavior.
In this study we investigated how features of the system architecture generalize to regulate electrical dynamics in coupled β-cells. We utilized a microwell-based method of cellular aggregation to form three-dimensional (3D) β-cell aggregates of defined size, which were compared with two-dimensional (2D) β-cell aggregates. We used this experimental model to specifically investigate how the dimension and size scaling of β-cell coupling affects the synchronization of [Ca2+]i oscillations and suppression of basal [Ca2+]i, as well as GSIS. To further understand how islet [Ca2+]i dynamics and regulation may be determined by the complexity of the system architecture, we tested whether dimensionality and size-dependences could also be described by the lattice-resistor–based network model. The findings from this study help us better understand how the multicellular electrical dynamics within the islet emerge from the coupling of individual β-cells.
Materials and Methods
Cell culture and aggregate formation
MIN6 cells (P28-36) were maintained in DMEM with 10% FBS, 1% penicillin-streptomycin, 0.2% fungizone, 1 mM sodium pyruvate, and 60 μM 2-mercaptoethanol. For 2D aggregates, MIN6 cells were seeded at ∼ 4000cells/mm2 in glass-bottom dishes (MatTek, Ashland, MA) that aggregate over 5 d in culture. For 3D aggregates, hydrogel microwell arrays were used as previously described (25). Briefly, microwell arrays were formed from a prepolymer solution of 10.8 wt% polyethylene glycol (PEG) diacrylate (Mn ∼ 3000 Da, synthesized as previously described (26)), 4.2 wt% PEG monoacrylate (Mn ∼ 400 Da, Monomer Polymer & Dajac Labs, Trevose, PA), 0.5 wt% 4-(2-hydroxyethoxy)phenyl-(2-hydroxy-2-propyl)ketone (Irgacure 2959, Ciba), and HBSS (Hank's Balanced Salt Solution). Hydrogel microwells were polymerized to glass slides treated with (3-acryloxypropyl)-trimethoxysilane (Gelest) by chemical vapor deposition (27). Well dimensions were defined by photoinitiation of the prepolymer solution through chrome photomasks (Photo Sciences, Inc., Torrance, CA) to form wells that were ∼ 100 μm deep and 100 × 100 μm (w100), 200 × 200 μm (w200), and 300 × 300 μm (w300) wide. MIN6 cells were seeded into the wells at a density of 520,000 cells/cm2 in w100 devices and 940,000 cells/cm2 in w200 and w300 devices using centrifugation as described previously (25). The devices were rotated on an orbital shaker for 2 hr and cultured under static conditions for 5 d. 3D aggregates were removed from the microwell devices using a gentle flow of media.
Microscopy
To measure [Ca2+]i dynamics, 2D and 3D aggregates were stained with 4μM Fluo4-AM in imaging medium (125mM NaCl, 5.7mM KCl, 2.5mM CaCl2, 1.2mM MgCl2, 10mM Hepes, 2mM glucose, and 0.1% BSA, pH 7.4) at room temperature for 60 to 90 min before imaging. 2D aggregates were imaged in glass-bottom dishes, and 3D aggregates were imaged in polydimethylsiloxane (PDMS) microfluidic device, the fabrication of which has been previously described (11). Real-time imaging was performed on a Nikon Eclipse Ti equipped with a humidified environmental chamber maintained at 37°C. Fluo4 fluorescence was imaged with a 20× 0.8NA objective, using a Xenon-arc lamp light source (Sutter, Novato, CA) and 470/20 filter for excitation and 525/36 filter and a CCD camera (Andor Clara, Belfast, UK) for fluorescence detection. Aggregates were allowed to equilibrate after each treatment for 10 min before imaging at 1 frame/s for 15 min, with negligible photobleaching observed.
Insulin secretion
For static insulin secretion assays 2D and 3D aggregates were formed and cultured for 5 d, and conditioned in Krebs-Ringer Buffer (KRB, 128.8 mM NaCl, 5 mM NaHCO3, 5.8 mM KCl, 1.2 mM KH2PO4, 2.5 mM CaCl2, 1.2 mM MgSO4, 10 mM Hepes, 0.1% BSA, pH = 7.4) containing 2 mM glucose for 1 hr before the glucose stimulation assay. Aggregates were then incubated in KRB containing either 2 mM glucose (low glucose), 20 mM glucose only (high glucose), or 20 mM glucose and 20 mM tetraethylammonium (TEA) for one hour. Supernatant from each sample was collected and stored at -70°C until testing. Supernatant samples were tested using a sandwich ELISA per the manufacturer’s instructions (Mercodia, Uppsala, Sweden). Total insulin secreted was normalized to low glucose secretion levels to give percentage over basal secretion.
Quantitative image analysis
Image analysis was carried out in MATLAB (MathWorks, Natick, MA). To calculate the area of synchronization, a cross-correlation was performed between the fluorescence time-course of each pixel, and a reference time-course averaged over ∼ 1 cell. The peak cross-correlation coefficient represents the similarity between the reference and pixel time-course, with 1 indicating perfect overlap, and 0 indicating no overlap (Fig. S1 A in the Supporting Material). If this peak was > 0.75, the pixel was “synchronized” (9). The area of synchronized pixels was expressed as a percentage of total aggregate area. The aggregate area was scaled by the mean area of a single cell, to represent number of cells.
To calculate the area of “active” cells at low glucose, the variance of a pixel time-course was first calculated for a quiescent reference cell; manually selected from an area that displayed no significant fluctuations in intensity over time compared with image noise. A pixel was “active” if its time course showed a variance > 3 standard deviations from the variance of the quiescent reference cell (13).
The size of each aggregate and regions of synchronization/activity were expressed as the number of cells. This was achieved by first tracing the boundaries of a cell based on its fluorescence and bright field image, giving an average cell diameter of 14.5 μm (28). For the cell number in 2D aggregates, the area was divided by the average area covered by a single cell (165 μm2). For 3D aggregates, the aggregate volume was calculated from its radius assuming a spherical or ellipsoid shape, and divided by the cell volume, as calculated from the average cell radius.
To extract data regarding robustness, phase, and period of the [Ca2+]i oscillations, a Fourier Transform was performed on the fluorescent intensity time-course and the time-course with a mean intensity subtraction (the AC component). To measure the robustness (regularity), a time-course was averaged over an area similar to the 2D range of synchronization. The peak AC component of the power spectrum was then normalized to the DC (0 frequency) component (Fig. S1 B). The frequency of the peak AC component was used to calculate the [Ca2+]i oscillation period. Wave propagation was determined by mapping the temporal offset between wave peaks; as determined by the phase value at the AC peak within regions of synchronization and identifying areas of progressively increasing phase (Fig. 4). The wave velocity was calculated by selecting two cells at either end of the wave propagation (within a region of synchronization) and measuring the temporal offset between successive identical parts of the [Ca2+]i wave. The velocity was calculated by dividing the exact spatial separation by the temporal offset of the [Ca2+]i oscillations.
Figure 4.
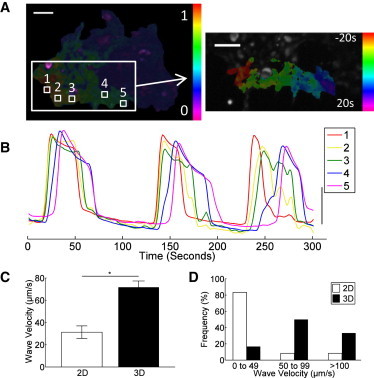
Dimensionality affects wave propagation velocity. (A) False-color map of the cross-correlation coefficient in a 2D aggregate (left) and of the phase of the oscillations representing wave propagation in the synchronized area (right). (B) Fluo4 time-course for five cells at several points along the wave propagation within the synchronized region of a 2D aggregate, indicated in A, Note the initial elevation at the start (red) and late elevation at the end (magenta) of the wave. (C) Mean (± s.e.m.) wave velocity in 2D and 3D aggregates. (D) Histogram of measured wave velocities in 2D and 3D aggregates. Data averaged over n = 18 (2D) and n = 12 (3D) aggregates. ∗ in C indicates significant difference in wave velocity (p < 0.001).
The information describing cell synchronization, oscillation period and low glucose activity was represented in false color hue-saturation-value (HSV) images as the hue (color), with saturation (the amount of color) constant and value (intensity) represented by the average fluorescence intensity. The information describing wave propagation (temporal offset, determined from the phase) was represented as the hue (color), with saturation (the amount of color) representing the threshold synchronization, and value (intensity) represented by the average fluorescence intensity. All statistics were performed in MATLAB. For comparison of two means, Student’s t-test was utilized. For comparison of multiple means, a one-way ANOVA (analysis of variance) was utilized. To determine whether a significant relationship existed between a variable and cell number, a linear regression model was used.
Network (bond percolation) simulations
Bond percolation is a submodel of percolation theory (29,30) in which for a given lattice of nodes (cells) adjacent nodes are connected (coupled) with a “percolation probability” p, or not connected with a probability (1-p) (Fig. S2 A). A 2D square lattice (four neighbors) or 3D cubic lattice (6 neighbors) was developed in MATLAB with a matrix of alternating values of 1 (node) and 0 (site for a potential bond). Probabilities were randomly assigned to each bond site based on a uniform distribution (0 to 1). If the probability was less than or equal to the assigned “percolation probability” p, a bond was established at the site and the two neighboring nodes were deemed coupled. For each individual cluster of coupled nodes that formed, an identifying number was assigned based on the number of nodes in the cluster. All potential bond sites were then removed to establish a matrix with clusters based on identified coupled nodes.
High glucose (synchronization) simulations
Simulations of high glucose synchronization were carried out with a custom MATLAB routine based on a previously published method (31). 2D networks of 25 × 25 nodes were populated with edge probabilities and clusters were formed based on a percolation probability p (as above). The largest cluster on each of the simulated lattices was identified (Fig. S2 B), and only those in which the central lattice site belonged to the largest cluster were selected. A bounding square (or cube for 3D) of area L2 (L3 for 3D) was centered on the lattice to represent different lattice sizes. For each bounding network size (L), the mass of the percolating area (M(L), the largest area in which nodes are coupled) was determined by identifying the number of nodes that were connected within the largest central cluster. For each value of L, the mass of the percolating area was normalized to the lattice size to determine the “percolation density” that represents the proportion of cells in the full network that are in the largest connected cluster:
We then deemed that if any two cells were coupled to the same connected cluster, they were synchronized; that is p represents the probability of functional coupling or the probability for two cells to be synchronization. Therefore, the percolation density is analogous to the synchronized area of each aggregate. For each value of p (Fig. S2, C and F), we ran 2000 simulations and the best fit to experimental data was determined by a chi-square test.
Low glucose (suppression) simulations
In contrast to modeling high glucose [Ca2+]i activity, where all cells within a network are deemed synchronized, low glucose modeling was based on the principle that a certain threshold number of nonresponsive (“inexcitable”) cells can hyperpolarize and suppress the [Ca2+]i activity of all other cells to which they are coupled (11). Thus in a coupled lattice network, if a proportion of the cells (nodes) are “inexcitable,” then they can be modeled to suppress all other cells within the network to which they are coupled, providing there a sufficient numbers of these “inexcitable” cells above the threshold required for suppression (Fig. S3). This threshold is a free parameter, but based on biological information it is defined as < 30%. There will be a probability that a single cell will be intrinsically active at low glucose, and thus a chance they will be inactive (“inexcitable”). This probability was used in a binomial model, which describes the probability of there being a sufficient number of inactive cells in a connected cluster to fully suppresses it; given a threshold number of inactive cells necessary for suppression (k, successes), and a total number of cells in the connected cluster (n, number of trials), where the probability of an inactive cell (q) is 33% (see Results):
where
As greater than k inactive cells will also be sufficient for suppression, the cumulative distribution for k to n was calculated (or P(X ≤ k)). After establishing bond percolation clusters see simulations for each value of p (Fig. S2, D and G) and k (Fig. S2, E and H). Sp represents k normalized to n, or the fraction of inexcitable cells required to suppress [Ca2+]i. We ran 1000 simulations and the best fit to experimental data was determined by a chi-square test.
Results
[Ca2+]i dynamics and insulin secretion under 2D and 3D coupling
To investigate how the underlying architecture of electrical coupling affects the robustness and synchronization of β-cell [Ca2+]i dynamics, we measured [Ca2+]i time-courses in 2D and 3D aggregates of defined sizes and shapes. We applied the hydrogel microarray to form 3D aggregates from the MIN6 β-cell line and compared these with 2D aggregates formed from plated cells. Under 2D coupling, aggregates exhibited irregular bursts of [Ca2+]i at high (20 mM) glucose, which were more regular upon application of the K+ channel inhibitor TEA (a K+ channel inhibitor commonly used to generate regular dynamics in MIN6 cells) (Fig. 1 A), as is generally observed in MIN6 cells under these conditions (32). However, 3D aggregates exhibited regular [Ca2+]i oscillations both in the presence and absence of TEA (Fig. 1 B). In 2D aggregates at high glucose, TEA significantly increased the robustness of oscillations, as quantified from the frequency power spectrum (Fig. 1 C). However, in 3D aggregates at high glucose, the robustness of oscillations was similar in the presence and absence of TEA, and significantly greater than in 2D clusters under high glucose alone (Fig. 1 C).
Figure 1.
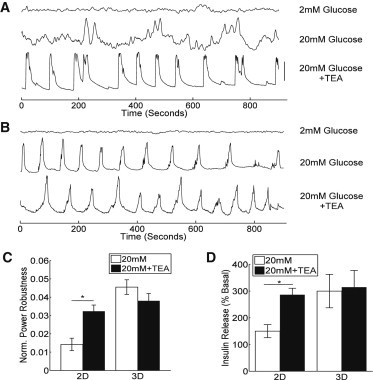
[Ca2+]i oscillations and insulin release in 2D and 3D aggregates. (A) Representative [Ca2+]i oscillations, measured from Fluo4 fluorescence, averaged over a 2D aggregate. Time-courses are offset for clarity and vertical bar represents 50% change in fluorescence. (B) As in A, under the same scale, averaged over a 3D aggregate of comparable size. (C) Mean (± s.e.m.) power robustness at 20 mM glucose and 20 mM glucose +20 mM TEA. (D) Mean (± s.e.m.) insulin release as percentage of content, normalized to release at 2 mM glucose. Data in C averaged over n = 28 (2D) and n = 22 (3D) aggregates, and data in D averaged over n = 6 (2D) and n = 12 (3D) aggregate preparations. ∗ in C and D indicates significant difference between glucose and glucose + TEA for power robustness (p = 0.00015) and insulin release (p = 0.0166).
The insulin secretion response showed a similar pattern to the [Ca2+]i oscillation robustness. TEA plus high glucose stimulated significantly greater insulin secretion in 2D aggregates compared with high glucose alone, but TEA plus high glucose stimulated no further elevation in insulin in 3D aggregates (Fig. 1 D). Therefore when β-cells are aggregated into 3D structures, they show more robust oscillatory [Ca2+]i and insulin secretion.
Dimension and size-dependence of [Ca2+]i synchronization
We next investigated the spatial variation of [Ca2+]i dynamics, by measuring the synchronization of [Ca2+]i oscillations in 2D and 3D aggregates under high glucose plus TEA. In 2D aggregates at high glucose plus TEA, oscillations were synchronized within distinct subregions of the aggregate. Compared with the oscillations in a specific cell within the aggregate, the synchronization of oscillations in other cells decreased with increased separation distance (Fig. 2, A and B). The oscillations were still highly synchronized within a radius of ∼ 5 cells. However, at greater separation distances the synchronization dropped substantially with little synchronization observed (Fig. 2 A). The change in synchronization was sudden, with adjacent cells showing very different oscillation patterns (Fig. 2, A and B). In 3D aggregates at high glucose plus TEA, the synchronization was consistent across the entire aggregate. Most cells showed similar synchronized oscillations, independent of separation distance and position within the aggregate (Fig. 2, C and D).
Figure 2.
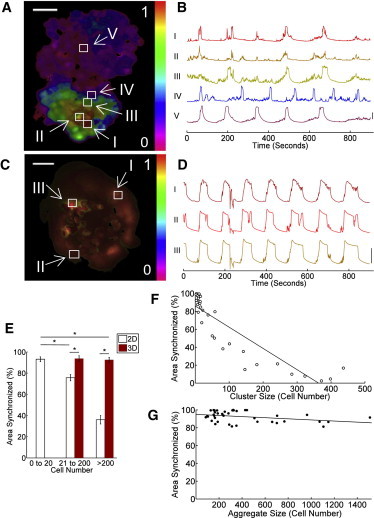
Size scaling and dimensionality of [Ca2+]i oscillation synchronization. (A) False-color map of the cross-correlation coefficient in a 2D aggregate, relative to a reference cell (I). (B) Fluo4 time-courses in cells at increasing distance from the reference cell (II-V). (C) False-color map of the cross-correlation coefficient in a 3D aggregate, relative to a reference cell (I). (D) Fluo4 time-courses in cells well separated from the reference cell in 3D (II, III). (E) Mean (± s.e.m.) area of aggregate showing synchronized [Ca2+]i oscillations, in 2D and 3D aggregates of different size ranges at 20 mM glucose +20 mM TEA. (F) Scatterplot of synchronization versus aggregate size, for 2D aggregates at 20 mM glucose +20 mM TEA. (G) As in F for 3D aggregates. ∗ in E indicates significant difference in synchronization of larger 2D aggregates (21–200 and > 200) compared with small aggregates (< 20), and a significant difference in synchronization comparing 2D and 3D aggregates (p < 0.001). Linear regression (line in F and G) shows significant size dependence in F (p < 0.0001), and a small but significant size dependence in G (p = 0.026). Scale bars represent 50 μm.
Given that cells were only synchronized within a limited (∼ 5 cells) distance in 2D aggregates, we anticipated that smaller 2D aggregates approaching this size would show a greater proportion of cells that were synchronized. Indeed, 2D aggregates consisting of fewer than 20 cells were highly synchronized (Fig. 2 E), with a synchronization similar to that measured in 3D aggregates. However larger 2D aggregates showed a significant reduction in synchronization compared with 3D aggregates containing an equivalent number of cells (Fig. 2 E). 2D aggregates showed a significant and progressive reduction in synchronization with increasing size (Fig. 2 F). However 3D aggregates showed only a small size dependence in synchronization over the full range of sizes measured, up to 300-μm diam. (Fig. 2 F); and with no size dependence in synchronization up to 200 μm diam. Therefore, the size of β-cell aggregates and the dimensions over which the β-cells couple is critical for the proper synchronization of [Ca2+]i oscillations.
Subregions of synchronization in 2D aggregates
To further investigate the limited range in 2D aggregates over which [Ca2+]i oscillations were synchronized, we measured the extent of synchronization at different positions within 2D aggregates. Multiple, nonoverlapping areas of synchronized [Ca2+]i oscillations were observed within the same large aggregate (Fig. 3, A and B). Distinct regions with similar [Ca2+]i oscillation period were also observed within the aggregate (Fig. 3 C). Importantly, those regions with similar oscillation periods overlapped strongly with regions showing a synchronization defined by our methods (Fig. 3, A-C). Within an aggregate, the largest area of synchronization was similar to the largest region with the same oscillation period (Fig. 3 D), with a mean size of ∼ 28 cells. Therefore in large 2D aggregates, multiple, distinct subregions of synchronized [Ca2+]i oscillation were observed.
Figure 3.
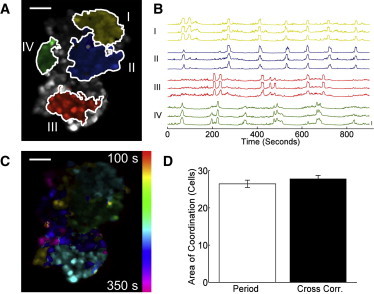
Localization of synchronized [Ca2+]i oscillations to discrete regions in 2D. (A) False-color map indicating regions of high cross-correlation coefficient in a 2D aggregate, with respect to different reference cells. Areas with no color (gray) have cells with no synchronization compared to the other regions. (B) Fluo4 time-courses of cells within each area of synchronization in A. (C) False-color map of [Ca2+]i oscillation period in same 2D aggregate as A. (D) Mean (± s.e.m.) area of oscillation period (Period) and area of high cross-correlation coefficient (Cross corr.). Data averaged over n = 28 clusters. No significant difference is observed (p = 0.3147). Scale bars represent 50 μm.
Wave velocity under 2D and 3D coupling
Since the velocity of calcium wave propagation has been linked to β-cell coupling, where reduced coupling across an islet resulted in slower calcium waves (9), we next measured whether aggregate dimensionality could affect this propagation. In 2D aggregates, calcium waves propagated across the subregions of synchronization (Fig. 4 A and Movie S1). Clear temporal separation between [Ca2+]i elevations could be observed for cells along the wave propagation (Fig. 4 B). However, little or no temporal separation was visible within 3D aggregates (not shown). As a result, the mean wave velocity was significantly faster in 3D aggregates compared with subregions of 2D aggregates (Fig. 4 C). The distribution of wave velocities was biased to waves > 50 μm/s in 3D aggregates compared with < 50 μm/s within subregions of 2D aggregates (Fig. 4 D). Therefore, 2D aggregates also show slower propagating calcium waves compared with 3D aggregates, further indicating that 2D aggregates are less effectively coupled.
Dimension and size-dependence of basal [Ca2+]i suppression
Intact islets are also characterized by a uniformly quiescent [Ca2+]i at low and basal glucose as a result of the suppressive effect of β-cell coupling (12,13). Given the dependence of [Ca2+]i dynamics at high glucose on aggregate size and dimensionality, we next measured the dependence of [Ca2+]i suppression on aggregate size and dimensionality. Under low glucose conditions (2 mM), 2D aggregates generally exhibited spontaneous, transient [Ca2+]i elevations (“activity”), whereas 3D aggregates were quiescent (Fig. S4). Large 2D aggregates consisting of > 200 cells were mostly quiescent showing similar low activity to that measured in 3D aggregates (Fig. 5 A). However, smaller 2D aggregates showed significantly increased activity compared with 3D aggregates containing an equivalent number of cells. In the smallest 2D aggregates, 67% of cells showed transient [Ca2+]i elevations. 2D aggregates showed a significant and progressive increase in suppression with increasing aggregate size (Fig. 5 B). 3D aggregates showed size-independent suppression up to 200-μm diam. with ∼ 20% active cells, and up to 300-μm diam. only a small size-dependent suppression was measured, (Fig. 5 C).
Figure 5.
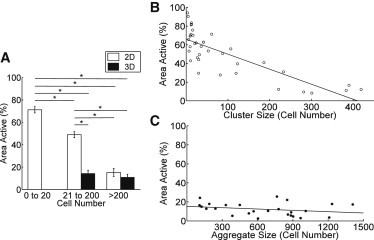
Size scaling and dimensionality of [Ca2+]i suppression at low glucose. (A) Mean (± s.e.m.) area of aggregate showing transient [Ca2+]i elevations in 2D and 3D aggregates of different sizes at 2 mM glucose. (B) Scatterplot of transient [Ca2+]i elevations vs. aggregate size for 2D aggregates. (C) As in B for 3D aggregates. ∗ in A indicates significant difference in transient [Ca2+]i elevations of small 2D aggregates (< 20) compared with larger aggregates (20–200, > 200), and a significant difference in elevation comparing 2D and 3D aggregates at moderate size (20–200, p < 0.001), but not very large clusters (> 200, p > 0.05). Linear regression (line in B and C) shows significant size dependence in B (p < 0.001), but not in C (p > 0.05).
Network model of [Ca2+]i dynamics
We next tested whether the lattice resistor network model approximation, which previously described a dependence of [Ca2+]i dynamics on coupling strength between β-cells (9), would describe the size and dimensionality dependence of synchronized [Ca2+]i oscillations and suppression of spontaneous [Ca2+]i elevations. We simulated partially coupled resistor networks covering different sizes over 2D and 3D, for a given proportion of node (β-cell) connectivity (p) (Fig. S2). Examples of simulated 2D networks in Fig. 6 A highlight nodes connected within the same cluster. In a 2D network, for low connectivity (p < 0.5) multiple small clusters of connected nodes were generated (Fig. 6 A, left), which were similar to the subregions of synchronized oscillations experimentally measured in 2D aggregates (Figs. 2 and 3). For higher connectivity (p > 0.5) and for 3D networks with the same lower connectivity (p < 0.5), a single cluster of connected nodes spanned the whole network (Fig. 6, A (right) and B, respectively), which was similar to the uniform synchronization and wave propagation measured in 3D aggregates (Figs. 2 and 4). This suggests that the network simulations can be related to [Ca2+]i oscillation synchronization: β-cells are synchronized if their corresponding nodes belong to the same connected cluster, with an unbroken path traced between these nodes. In this model at high glucose + TEA, p represents the probability for two neighboring cells to be functionally coupled to synchronize their oscillations.
Figure 6.
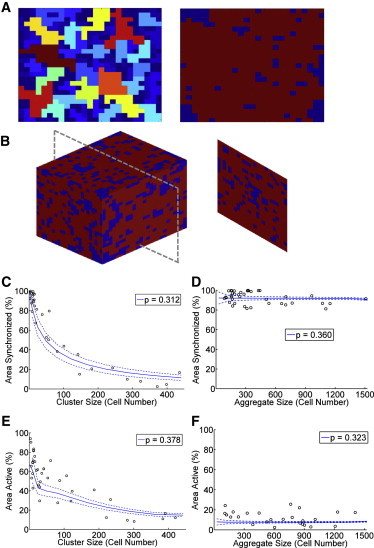
Coupled resistor network model describes experimental size scaling and dimensionality. (A) False-color simulation of network size for 2D bond percolation with p below (p = 0.31, left) and above (p = 0.51, right) the 2D critical probability (pc ≈ 0.5). (B) False-color simulation of cluster size for 3D bond percolation with p above (p = 0.31, right) the 3D critical probability (pc ≈ 0.25). Different colors in A, B represent different connected clusters. (C) Simulation and experimental data of 2D oscillation synchronization. Circles represent experimental data, solid blue line represents mean of simulations for p = 0.312 (χ2 = 3.94), dashed blue lines represents mean ± 1 standard deviation of the simulations for p = 0.312. (D) As in C for 3D oscillation synchronization, p = 0.360 (χ2 = 0.41). (E) Simulation and experimental data of 2D transient elevations, p = 0.378 (χ2 = 4.65). (F) As in E for 3D transient elevations, p = 0.323 (χ2 = 4.45). Mean and standard deviation in C and D are calculated more than n = 2000 simulations, in E and F more than n = 1000 simulations. To see this figure in color, go online.
To test whether this network model could describe the [Ca2+]i oscillation synchronization, we simulated low connectivity 2D networks for varying p. A p = 0.320 ± 0.005 generated multiple clusters of connected nodes, with a mean largest size of 28 nodes. This is similar to the mean number of cells experimentally measured (27 to 28 cells) in the largest synchronized region of 2D clusters (Fig. 3 D). Second, for varying network sizes, we measured the proportion of nodes in the largest cluster relative to the total network size, which models the percentage of cells that belong to the largest synchronized region. A p = 0.312 (95% CI: 0.284 to 0.337) generated a size variation that best fits the experimental 2D synchronization (Fig. 6 C). This is in close agreement with the p describing the theoretical number of cells within the largest synchronized region (above). A p = 0.360 (95% CI: 0.333 to 0.402) generated a size variation that best fits the experimental 3D synchronization (Fig. 6 D), in good agreement with the 2D model.
We then tested whether this same network model could also describe the suppression of spontaneous [Ca2+]i elevations under low glucose conditions. “Inexcitable” β-cells can suppress activity in excitable β-cells via electrical coupling (11), with fewer than 30% inexcitable cells necessary for this suppression. With this principle we defined a rule where if a proportion of cells in a connected cluster are “inexcitable” they can be modeled to suppress all other cells within the connected cluster to which they are coupled, providing the proportion of these “inexcitable” cells is above the threshold required for suppression (Fig. S3). In this case, p represents the probability for two cells to be functionally coupled to mediate this suppression at low glucose. In small 2D aggregates, 67% of cells were active at low glucose (Fig. 5 B), such that 67% of the cells in a network are considered to be intrinsically active (“excitable”), and therefore 33% are inactive (“inexcitable”). The threshold proportion of “inexcitable” cells necessary for suppression of all connected cells was best fit to 15% (i.e., between 0% and 30%), but little variation was observed in the model for a threshold between 10% and 30% (Fig. S2, E and H). With these values, there was strong agreement between experimental data and the network model in both 2D and 3D: for a p = 0.378 (95% CI: 0.354 to 0.398) in 2D (Fig. 6 E); and a p = 0.323 (95% CI: 0.263 to 0.387) in 3D (Fig. 6 F). These are in strong agreement with the 2D and 3D models that describe the size dependence of synchronization at high glucose.
Therefore the size dependence of synchronized [Ca2+]i oscillations and spontaneous [Ca2+]i suppression can be quantitatively described by similar models of network architecture.
Discussion
Islets of Langerhans show coordinated [Ca2+]i oscillations and propagating calcium waves at elevated glucose mediated by Cx36 gap junction channels, which are important for proper insulin release and glucose homeostasis. By utilizing a microfabricated microwell array, we could generate β-cell aggregates of defined sizes, enabling us to examine the dependence of [Ca2+]i dynamics on size and dimension.
Insufficient β-cell coupling in two dimensions
When MIN6 cells were coupled within a 3D architecture, they showed more robust [Ca2+]i dynamics compared with a 2D architecture. This included more robust oscillations (Fig. 1), increased oscillations synchronization (Fig. 2) and faster calcium wave propagation (Fig. 4) at high glucose, as well as more efficient suppression of spontaneous [Ca2+]i at low glucose (Fig. 5). Within this 3D architecture, MIN6 cells showed similar responses to intact islets (9), with similar wave velocities (72 ± 6 μm/s vs. 69 ± 5 μm/s respectively) and oscillation synchronization (96 ± 2% vs. 91 ± 2% respectively) (9). 3D aggregates consist of only MIN6 β-cells; however, islets contain vascular endothelial cells that degrade in culture (33). This could reduce the incidence of coupling between β-cells and explain the small difference in synchronization. Nevertheless, these aggregates can serve as a model system in which to examine the effects of β-cell coupling.
When the coupling architecture is reduced to 2D, the behavior observed is qualitatively similar to that previously measured in islets showing a partial loss of electrical coupling: synchronized oscillations are restricted to subregions (9) and basal [Ca2+]i is elevated. This can be partially explained by the reduced number of direct connections a cell makes to neighboring cells in 2D. Within the islet, β-cells are coupled to ∼ 6 neighboring cells (34) that can be approximated to a cubic architecture. Therefore, a decrease in coupling to adjacent cells of ∼ 33% occurs in a 2D network compared with 3D network (each cell coupled to four cells instead of six). However, this contrasts with the disproportionate reductions in synchronization in 3D islets after a greater (> 50%) loss of coupling (9). Nevertheless, by considering properties of discretely coupled networks to model the synchronization (see next section), we can describe this effect more precisely.
At low glucose, there is size invariance in 3D aggregates over which [Ca2+]i is suppressed. However, the suppression improved with increasing size in 2D aggregates, in contrast to the opposite size-dependence of synchronization at elevated glucose. As a result there is no optimal size for 2D aggregates to show well-regulated [Ca2+]i: as the aggregate gets larger it shows better low glucose control, but poorer high glucose control. This difference can be qualitatively explained by considering how synchronization and suppression result from coupling. For all cells in an aggregate to be synchronized, they must be effectively coupled with each other across the aggregate. The size of this synchronized region is limited (i.e., ∼ 28 cells, Fig. 3). Therefore, in larger aggregates the synchronized region is smaller relative to the aggregate size, and the synchronization is lower. For cells in an aggregate to be suppressed, they must be connected to a sufficient number of inactive cells. In a large aggregate, there will be a greater number of large “synchronized regions” relative to small “synchronized regions,” whereas a smaller aggregate will only have small synchronized regions (Fig. S3). Large synchronized regions will have a much greater chance of containing sufficient number of inactive cells to suppress the active cells (as defined in a binomial distribution, Fig. S3), and therefore have a greater probability of being silent at low glucose. This reveals a fundamental and unexpected difference in the way in which cell-cell coupling plays a role in the suppression of [Ca2+]i compared with the synchronization of [Ca2+]i oscillations, which can be further explained next using the network model (see also Fig. S3).
Network model describes dimension and size-scaling of [Ca2+]i
To model how coupling architecture contributes to network synchronization we utilized a probability-based Boolean model, based on an approximation that previously described how altered gap junction coupling affected cell synchronization and wave propagation (9). This described several aspects of the [Ca2+]i size scaling: the size of synchronized regions within 2D and 3D aggregates, and the change in synchronization and low glucose suppression with 2D and 3D aggregate size. One floating parameter p describes all six sets of data, supporting that changes in [Ca2+]i were primarily because of altered coupling architecture. The additional Sp parameter required for the suppression data are in accordance with past experimental data (< 30% of inexcitable cells (11), but > 1 inexcitable cell (12)) and was fixed within a range where little variation occurred (Fig. S2, E and H).
The fitted p parameter (0.32 to 0.37) was substantially less than 1, indicating a limited level of coupling in each aggregate: two to three functional connections per cell in 3D aggregates under the model approximation. In islets there is a distribution of conductance strengths that couple cells (9,35). Our model suggests a “backbone” of two to three functional connections per cell is sufficient to support the overall multicellular behavior; possibly as connections with high conductance overcome a threshold necessary to functionally couple β-cells. This is consistent with a recent study that suggested a relatively small proportion of highly conducting β-cells most efficiently mediate propagating calcium waves to synchronize [Ca2+]i across the islet (36). As such, many aspects of the multicellular behavior may be highly dependent on the network topology, although further studies will be required to test this assertion.
Percolation theory (30) describes a critical connection probability (pc) required for coupling to span a network, dependent on the network arrangement (pc ∼ 0.25 for 3D cubic networks, pc = 0.5 for 2D square networks (29)). Therefore, 2D aggregates require p > 0.5 (> 2 functional connections/cell) for fully coupled behavior but 3D aggregates require p > 0.25 (> 1.5 functional connections/cell). The p that describes experimental data (0.32 to 0.37) falls between the pc for 2D and 3D networks, which can also explain the differential behavior (Figs. 6, A and B and S2). From this, we predict an increase in coupling conductance in 2D aggregates, such that p increases above pc from ∼ 0.35 to > 0.5, would transition the behavior similar to synchronized 3D aggregates (Fig. 6 A). Conversely a decrease in coupling conductance in 3D aggregates, such that p decreases below pc from ∼ 0.35 to < 0.25, would transition the behavior similar to unsynchronized 2D aggregates. Furthermore, we predict that this model will describe how coupled β-cell behavior can be related to other properties of a partially coupled network, such as lower dimensions (a one-dimensional line of cells requiring very high coupling), size-scaling beyond the ranges we experimentally measure (reduced synchronization in much larger 3D aggregates), and the proportion of inexcitable cells, (manuscript in preparation). However, further experiments will be required to fully test these predictions.
It is also important to consider other limitations to the model. The network connectivity parameter p approximates functional coupling, which can represent the coupling current and is proportional to coupling conductance. However, treating cells as active or inactive in a static framework does not consider dynamical aspects of the system. Although simplifying the system for analysis, this may omit other details of cellular dynamics that may be important for multicellular behavior. Cells with different oscillation patterns or excitabilities may synchronize less readily even in the presence of robust gap junction coupling. In the static framework this will be factored into p but may fail to differentiate coupling/architecture from intrinsic cellular properties, and therefore predicted changes in multicellular behavior may occur with different p and pc values than we describe above. Further if properties of cellular signaling change, a different p value may also be required: [Ca2+]i oscillations in MIN6 aggregates are slightly faster than physiological islet oscillations (3-8 min) which may be because of subtle differences between β-cells and MIN6 cells and, therefore, will have different p values. However, for a given functional state of a cell, we can describe the size and dimensionality scaling for that state. Nevertheless comparisons with coupled oscillator models, and understanding for which conditions the complex multicellular dynamical system of coupled β-cells can reduce to a static network model, will be a goal for future work.
Physiological importance
Size and dimensionality play key roles in the regulation of electrical activity in β-cell aggregates. Higher dimensionality aggregates show enhanced suppression of [Ca2+]i at low glucose and a coordinated, robust [Ca2+]i response at high glucose. This can explain the elevated insulin secretion seen in 3D aggregates. Although we did not examine the size-dependence of insulin secretion, we have previously demonstrated a size-invariance for insulin secretion in 3D MIN6 β-cell aggregates (25). Furthermore, previous studies have shown that confluent MIN6 cells (large 2D aggregates) show reduced insulin secretion at low glucose compared with nonconfluent MIN6 cells (small 2D aggregates) (37). Additionally, though electrical coupling is critical to β-cell function, other factors also play a role. Recent work comparing dispersed versus randomly aggregated MIN6 cells found a role for altered mitochondrial metabolism and IRS-1 phosphorylation (38). Together with our measurements of [Ca2+]i and insulin secretion, these data indicate a key role that coupling architecture plays in determining coupled β-cell function.
Human islets have been described by a number of architectures (39,40); however, defects that alter the system architecture and reduce the dimensionality over which coupling occurs would be expected to lead to dysfunction, similar to defects induced by a loss of gap junction coupling (14). For instance, in islets from donors with type 2 diabetes there is a reduction in the number of β-cell β-cell connections (41) which may be mediated through α-cell infiltration and β-cell death. The decrease in β-cell coupling would then suggest a reduction in [Ca2+]i regulation and insulin secretion, as we measure upon lower dimension coupling.
The results presented here are also important to consider for generating alternate sources of β-cells for islet transplantations. Our data suggests that the architecture for cellular coupling will be an important parameter. 2D sheets of β-cells will likely provide insufficient coupling for well-regulated insulin secretion, and 3D structures will be necessary. This will also be important when seeding β-cells onto scaffolds (42,43), where we predict those scaffolds that promote the formation of higher-dimensional structures will show enhanced function. It is necessary to also consider how other factors such as revascularization, nutrient diffusion, and hypoxia are dependent on architecture. For example, transplanting smaller 3D islets better reverses diabetes than large 3D islets (44). The controlled aggregation method we utilized to generate well-defined 3D β-cell structures (25) could be beneficial in generating appropriately functioning transplantation material from isolated β-cells.
Finally, other neuroendocrine cell systems share properties of the islet, where coupling between constituent cells enhances and coordinates hormone-secretion dynamics. For example, robust and enhanced pulsatile growth-hormone (GH) secretion results from the coupling between GH cells and the coordination of [Ca2+]i (45,46); where remodeling of the coupling architecture can regulate GH release (45). Gap junctions couple chromaffin cells in the adrenal medulla that synchronize [Ca2+]i transients and regulate catecholamine release (47,48); and where remodeling of electrical coupling enhances chromaffin cell excitability (48,49). Therefore, we speculate that the importance of dimensionality and size scaling could be applied broadly to other cellular systems; to understand how the system architecture regulates hormone secretion dynamics and hormone action.
To summarize, by utilizing a microwell-based aggregation method to generate β-cell aggregates of defined sizes we have investigated size and dimensionality scaling behavior. The dimension and size over which coupling occurs are critical factors for regulating the electrical dynamics and insulin release. This behavior at high and low glucose can be described using a model of network connectivity indicating the complexity in 3D aggregates. This is important for fundamental understanding of β-cell coupling and pancreatic islet function, as well as understanding how multicellular dynamics in other systems can emerge from the coupling architecture of constituent cells.
Acknowledgments
This study was supported by NIH grants R00 DK085145 (RKPB), R01 DK076084 (KSA), and NSF grant DGE0742434 (THH). The authors acknowledge DERC cores supported by NIH grant P30DK057516 and JDRF Center services supported by JDRF grant 4-2007-1056.
Footnotes
Thomas Hraha, and Abigail Bernard contributed equally to this work.
This is an Open Access article distributed under the terms of the Creative Commons-Attribution Noncommercial License (http://creativecommons.org/licenses/by-nc/2.0/), which permits unrestricted noncommercial use, distribution, and reproduction in any medium, provided the original work is properly cited.
Supporting Material
References
- 1.Bergsten P. Slow and fast oscillations of cytoplasmic Ca2+ in pancreatic islets correspond to pulsatile insulin release. Am. J. Physiol. 1995;268:E282–E287. doi: 10.1152/ajpendo.1995.268.2.E282. [DOI] [PubMed] [Google Scholar]
- 2.Nunemaker C.S., Zhang M., Satin L.S. Individual mice can be distinguished by the period of their islet calcium oscillations: is there an intrinsic islet period that is imprinted in vivo? Diabetes. 2005;54:3517–3522. doi: 10.2337/diabetes.54.12.3517. [DOI] [PubMed] [Google Scholar]
- 3.Matthews D.R., Naylor B.A., Turner R.C. Pulsatile insulin has greater hypoglycemic effect than continuous delivery. Diabetes. 1983;32:617–621. doi: 10.2337/diab.32.7.617. [DOI] [PubMed] [Google Scholar]
- 4.Meier J.J., Veldhuis J.D., Butler P.C. Pulsatile insulin secretion dictates systemic insulin delivery by regulating hepatic insulin extraction in humans. Diabetes. 2005;54:1649–1656. doi: 10.2337/diabetes.54.6.1649. [DOI] [PubMed] [Google Scholar]
- 5.Menge B.A., Grüber L., Meier J.J. Loss of inverse relationship between pulsatile insulin and glucagon secretion in patients with type 2 diabetes. Diabetes. 2011;60:2160–2168. doi: 10.2337/db11-0251. [DOI] [PMC free article] [PubMed] [Google Scholar]
- 6.Pørksen N., Hollingdal M., Schmitz O. Pulsatile insulin secretion: detection, regulation, and role in diabetes. Diabetes. 2002;51(Suppl 1):S245–S254. doi: 10.2337/diabetes.51.2007.s245. [DOI] [PubMed] [Google Scholar]
- 7.Lernmark A. The preparation of, and studies on, free cell suspensions from mouse pancreatic islets. Diabetologia. 1974;10:431–438. doi: 10.1007/BF01221634. [DOI] [PubMed] [Google Scholar]
- 8.Pipeleers D.G. Heterogeneity in pancreatic beta-cell population. Diabetes. 1992;41:777–781. doi: 10.2337/diab.41.7.777. [DOI] [PubMed] [Google Scholar]
- 9.Benninger R.K.P., Zhang M., Piston D.W. Gap junction coupling and calcium waves in the pancreatic islet. Biophys. J. 2008;95:5048–5061. doi: 10.1529/biophysj.108.140863. [DOI] [PMC free article] [PubMed] [Google Scholar]
- 10.Ravier M.A., Güldenagel M., Meda P. Loss of connexin36 channels alters beta-cell coupling, islet synchronization of glucose-induced Ca2+ and insulin oscillations, and basal insulin release. Diabetes. 2005;54:1798–1807. doi: 10.2337/diabetes.54.6.1798. [DOI] [PubMed] [Google Scholar]
- 11.Rocheleau J.V., Remedi M.S., Piston D.W. Critical role of gap junction coupled KATP channel activity for regulated insulin secretion. PLoS Biol. 2006;4:221–227. doi: 10.1371/journal.pbio.0040026. [DOI] [PMC free article] [PubMed] [Google Scholar]
- 12.Speier S., Gjinovci A., Rupnik M. Cx36-mediated coupling reduces beta-cell heterogeneity, confines the stimulating glucose concentration range, and affects insulin release kinetics. Diabetes. 2007;56:1078–1086. doi: 10.2337/db06-0232. [DOI] [PubMed] [Google Scholar]
- 13.Benninger R.K.P., Head W.S., Piston D.W. Gap junctions and other mechanisms of cell-cell communication regulate basal insulin secretion in the pancreatic islet. J. Physiol. 2011;589:5453–5466. doi: 10.1113/jphysiol.2011.218909. [DOI] [PMC free article] [PubMed] [Google Scholar]
- 14.Head W.S., Orseth M.L., Benninger R.K.P. Connexin-36 gap junctions regulate in vivo first- and second-phase insulin secretion dynamics and glucose tolerance in the conscious mouse. Diabetes. 2012;61:1700–1707. doi: 10.2337/db11-1312. [DOI] [PMC free article] [PubMed] [Google Scholar]
- 15.Ravier M.A., Sehlin J., Henquin J.C. Disorganization of cytoplasmic Ca(2+) oscillations and pulsatile insulin secretion in islets from ob/obmice. Diabetologia. 2002;45:1154–1163. doi: 10.1007/s00125-002-0883-9. [DOI] [PubMed] [Google Scholar]
- 16.Carvalho C.P., Oliveira R.B., Collares-Buzato C.B. Impaired β-cell-β-cell coupling mediated by Cx36 gap junctions in prediabetic mice. Am. J. Physiol. Endocrinol. Metab. 2012;303:E144–E151. doi: 10.1152/ajpendo.00489.2011. [DOI] [PubMed] [Google Scholar]
- 17.Bertram R., Sherman A., Satin L.S. Metabolic and electrical oscillations: partners in controlling pulsatile insulin secretion. Am. J. Physiol. Endocrinol. Metab. 2007;293:E890–E900. doi: 10.1152/ajpendo.00359.2007. [DOI] [PubMed] [Google Scholar]
- 18.Zimliki C.L., Mears D., Sherman A. Three roads to islet bursting: emergent oscillations in coupled phantom bursters. Biophys. J. 2004;87:193–206. doi: 10.1529/biophysj.103.038471. [DOI] [PMC free article] [PubMed] [Google Scholar]
- 19.Pedersen M.G. Homogenization of heterogeneously coupled bistable ODE’s—applied to excitation waves in pancreatic islets of Langerhans. J. Biol. Phys. 2004;30:285–303. doi: 10.1023/B:JOBP.0000046727.28337.f4. [DOI] [PMC free article] [PubMed] [Google Scholar]
- 20.Tsaneva-Atanasova K., Sherman A. Accounting for near-normal glucose sensitivity in Kir6.2[AAA] transgenic mice. Biophys. J. 2009;97:2409–2418. doi: 10.1016/j.bpj.2009.07.060. [DOI] [PMC free article] [PubMed] [Google Scholar]
- 21.Nittala A., Ghosh S., Wang X. Investigating the role of islet cytoarchitecture in its oscillation using a new beta-cell cluster model. PLoS ONE. 2007;2:e983. doi: 10.1371/journal.pone.0000983. [DOI] [PMC free article] [PubMed] [Google Scholar]
- 22.Strogatz S.H. Exploring complex networks. Nature. 2001;410:268–276. doi: 10.1038/35065725. [DOI] [PubMed] [Google Scholar]
- 23.Watts D.J., Strogatz S.H. Collective dynamics of ‘small-world’ networks. Nature. 1998;393:440–442. doi: 10.1038/30918. [DOI] [PubMed] [Google Scholar]
- 24.Long J., Junkin M., Deymier P. Calcium wave propagation in networks of endothelial cells: model-based theoretical and experimental study. PLOS Comput. Biol. 2012;8:e1002847. doi: 10.1371/journal.pcbi.1002847. [DOI] [PMC free article] [PubMed] [Google Scholar]
- 25.Bernard A.B., Lin C.C., Anseth K.S. A microwell cell culture platform for the aggregation of pancreatic β-cells. Tissue Eng. Part C Methods. 2012;18:583–592. doi: 10.1089/ten.tec.2011.0504. [DOI] [PMC free article] [PubMed] [Google Scholar]
- 26.Lin C.C., Anseth K.S. Cell-cell communication mimicry with poly(ethylene glycol) hydrogels for enhancing beta-cell function. Proc. Natl. Acad. Sci. USA. 2011;108:6380–6385. doi: 10.1073/pnas.1014026108. [DOI] [PMC free article] [PubMed] [Google Scholar]
- 27.Kloxin A.M., Tibbitt M.W., Anseth K.S. Synthesis of photodegradable hydrogels as dynamically tunable cell culture platforms. Nat. Protoc. 2010;5:1867–1887. doi: 10.1038/nprot.2010.139. [DOI] [PMC free article] [PubMed] [Google Scholar]
- 28.Ni Q., Ganesan A., Zhang J. Signaling diversity of PKA achieved via a Ca2+-cAMP-PKA oscillatory circuit. Nat. Chem. Biol. 2011;7:34–40. doi: 10.1038/nchembio.478. [DOI] [PMC free article] [PubMed] [Google Scholar]
- 29.Stauffer D., Aharony A. Taylor & Francis; London: 2003. Introduction to percolation theory. [Google Scholar]
- 30.Albert R., Barabasi A.L. Statistical mechanics of complex networks. Rev. Mod. Phys. 2002;74:47–97. [Google Scholar]
- 31.Kapitulnik A., Aharony A., Stauffer D. Self similarity and correlations in percolation. J. Phys. A. Math. Gen. 1983;16:L269. [Google Scholar]
- 32.Bokvist K., Rorsman P., Smith P.A. Effects of external tetraethylammonium ions and quinine on delayed rectifying K+ channels in mouse pancreatic beta-cells. J. Physiol. 1990;423:311–325. doi: 10.1113/jphysiol.1990.sp018024. [DOI] [PMC free article] [PubMed] [Google Scholar]
- 33.Brissova M., Fowler M., Powers A.C. Intraislet endothelial cells contribute to revascularization of transplanted pancreatic islets. Diabetes. 2004;53:1318–1325. doi: 10.2337/diabetes.53.5.1318. [DOI] [PubMed] [Google Scholar]
- 34.Zhang Q., Galvanovskis J., Rorsman P. Cell coupling in mouse pancreatic beta-cells measured in intact islets of Langerhans. Philos Transact A Math Phys. Eng. Sci. 2008;366:3503–3523. doi: 10.1098/rsta.2008.0110. [DOI] [PubMed] [Google Scholar]
- 35.Moreno A.P., Berthoud V.M., Pérez-Armendariz E.M. Biophysical evidence that connexin-36 forms functional gap junction channels between pancreatic mouse beta-cells. Am. J. Physiol. Endocrinol. Metab. 2005;288:E948–E956. doi: 10.1152/ajpendo.00216.2004. [DOI] [PubMed] [Google Scholar]
- 36.Stožer A., Gosak M., Korošak D. Functional connectivity in islets of Langerhans from mouse pancreas tissue slices. PLOS Comput. Biol. 2013;9:e1002923. doi: 10.1371/journal.pcbi.1002923. [DOI] [PMC free article] [PubMed] [Google Scholar]
- 37.Konstantinova I., Nikolova G., Lammert E. EphA-Ephrin-A-mediated beta cell communication regulates insulin secretion from pancreatic islets. Cell. 2007;129:359–370. doi: 10.1016/j.cell.2007.02.044. [DOI] [PubMed] [Google Scholar]
- 38.Chowdhury A., Dyachok O., Bergsten P. Functional differences between aggregated and dispersed insulin-producing cells. Diabetologia. 2013;56:1557–1568. doi: 10.1007/s00125-013-2903-3. [DOI] [PMC free article] [PubMed] [Google Scholar]
- 39.Cabrera O., Berman D.M., Caicedo A. The unique cytoarchitecture of human pancreatic islets has implications for islet cell function. Proc. Natl. Acad. Sci. USA. 2006;103:2334–2339. doi: 10.1073/pnas.0510790103. [DOI] [PMC free article] [PubMed] [Google Scholar]
- 40.Bosco D., Armanet M., Berney T. Unique arrangement of alpha- and beta-cells in human islets of Langerhans. Diabetes. 2010;59:1202–1210. doi: 10.2337/db09-1177. [DOI] [PMC free article] [PubMed] [Google Scholar]
- 41.Kilimnik G., Zhao B., Hara M. Altered islet composition and disproportionate loss of large islets in patients with type 2 diabetes. PLoS ONE. 2011;6:e27445. doi: 10.1371/journal.pone.0027445. [DOI] [PMC free article] [PubMed] [Google Scholar]
- 42.Pedraza E., Brady A.C., Stabler C.L. Macroporous three-dimensional PDMS scaffolds for extrahepatic islet transplantation. Cell Transplant. 2013;22:1123–1135. doi: 10.3727/096368912X657440. [DOI] [PMC free article] [PubMed] [Google Scholar]
- 43.Kodama S., Kojima K., Vacanti C.A. Engineering functional islets from cultured cells. Tissue Eng. Part A. 2009;15:3321–3329. doi: 10.1089/ten.TEA.2008.0459. [DOI] [PubMed] [Google Scholar]
- 44.Lehmann R., Zuellig R.A., Spinas G.A. Superiority of small islets in human islet transplantation. Diabetes. 2007;56:594–603. doi: 10.2337/db06-0779. [DOI] [PubMed] [Google Scholar]
- 45.Bonnefont X., Lacampagne A., Mollard P. Revealing the large-scale network organization of growth hormone-secreting cells. Proc. Natl. Acad. Sci. USA. 2005;102:16880–16885. doi: 10.1073/pnas.0508202102. [DOI] [PMC free article] [PubMed] [Google Scholar]
- 46.Hodson D.J., Schaeffer M., Romano N., Fontanaud P., Lafont C., Birkenstock J., Molino F., Christian H., Lockey J., Carmignac D., Fernandez-Fuente M., Le Tissier P., Mollard P. Existence of long-lasting experience-dependent plasticity in endocrine cell networks. Nature Communications. 2012;3:605. doi: 10.1038/ncomms1612. [DOI] [PMC free article] [PubMed] [Google Scholar]
- 47.Martin A.O., Mathieu M.N., Chevillard C., Guerineau N.C. Gap junctions mediate electrical signaling and ensuing cytosolic Ca2+ increases between chromaffin cells in adrenal slices: A role in catecholamine release. J. Neurosci. 2001;21:5397–5405. doi: 10.1523/JNEUROSCI.21-15-05397.2001. [DOI] [PMC free article] [PubMed] [Google Scholar]
- 48.Colomer C., Olivos Ore L.A., Coutry N., Mathieu M.N., Arthaud S., Fontanaud P., Iankova I., Macari F., Thouennon E., Yon L., Anouar Y., Guerineau N.C. Functional remodeling of gap junction-mediated electrical communication between adrenal chromaffin cells in stressed rats. J. Neurosci. 2008;28:6616–6626. doi: 10.1523/JNEUROSCI.5597-07.2008. [DOI] [PMC free article] [PubMed] [Google Scholar]
- 49.Hill J., Lee S.K., Smith C. Pituitary adenylate cyclase-activating peptide enhances electrical coupling in the mouse adrenal medulla. Am. J. Physiol. Cell Physiol. 2012;303:C257–C266. doi: 10.1152/ajpcell.00119.2012. [DOI] [PMC free article] [PubMed] [Google Scholar]
Associated Data
This section collects any data citations, data availability statements, or supplementary materials included in this article.