

Abstract
Background
Short sleep has been implicated in higher risk of obesity in humans, and is associated with insulin resistance. However, the effects of fragmented sleep (SF) rather than curtailed sleep on glucose homeostasis are unknown.
Methods
Wild type and NADPH oxidase 2 (Nox2) null male mice were subjected to SF or sleep control (SC) conditions for 3 days-3 weeks. Systemic and visceral adipose tissue (VAT) insulin sensitivity tests, glucose tolerance test, FACS and immunohistochemistry for macrophages and sub-types (M1 and M2) and Nox expression and activity were examined.
Results
Here show that SF in the absence of sleep curtailment induces time-dependent insulin resistance, in vivo and also in vitro in VAT. Oxidative stress pathways were up-regulated by SF in VAT, and were accompanied by M1 macrophage polarization. SF-induced oxidative stress, inflammation, and insulin resistance in VAT were completely abrogated in genetically altered mice lacking Nox2 activity.
Conclusions
These studies imply that SF, a frequent occurrence in many disorders and more specifically in sleep apnea, is a potent inducer of insulin resistance via activation of oxidative stress and inflammatory pathways, thereby opening the way for therapeutic strategies.
Keywords: sleep disruption, insulin resistance, adipose tissue, NADPH oxidase, macrophage polarity, inflammation, oxidative stress
Introduction
Chronic sleep restriction and sleepiness are highly prevalent conditions in industrialized societies, and have been associated with increased risk for development of metabolic dysfunction (1–6). However, another alteration of sleep, namely sleep fragmentation (SF) is also very frequently encountered in the context of multiple disorders, such as sleep apnea, depression, COPD, and asthma. Furthermore, excessive daytime sleepiness (EDS) is a frequent occurrence in the context of SF, even though SF does not mandatorily lead to reduced sleep duration.
Experimentally-imposed sleep restriction conditions have now repeatedly demonstrated the emergence of insulin resistance even in young healthy individuals (1–4, 6). Initial preliminary studies in which SF was induced in the sleep laboratory in healthy human subjects showed the emergence of adverse metabolic consequences such as increased orexigenic behaviors and insulin resistance (7,8). However, the mechanisms underlying SF-associated metabolic are unknown, and have yet to be investigated in animal models.
NADPH oxidase is a multi-subunit enzyme complex that localizes to both the plasma membrane and membranes of sub-cellular organelles, and catalyzes electron transfer from NADPH to molecular oxygen, producing superoxide (9, 10). De-regulated activation of NADPH oxidase leads to ROS production in large quantities that are likely involved in oxidative cellular damage. In a previous study, we showed that SF elicited increased sleepiness in the absence of reductions in total sleep duration, and manifested cognitive and behavioral alterations (11, 12). In this context, Nox2-deficient mice were protected from SF-induced cognitive dysfunction, suggesting a role for NADPH oxidase in end-organ morbidities associated with disrupted sleep architecture. We therefore hypothesized that the previously demonstrated increases in NADPH oxidase (Nox) induced by chronic SF exposures would not be restricted to the central nervous system, and would potentially be activated in other metabolically-active tissues such as visceral fat (VAT) in mice (13). We further posited that such increases in Nox2 activity would underlie potential alterations in insulin sensitivity associated with SF, and would further reflect changes in VAT macrophage populations and polarity within the VAT (13–15). We therefore took advantage of a SF-murine model, in which SF is applied during the light phase of the circadian cycle for extended periods of time and induces substantial increases in sleepiness without sleep restriction (9,10), and assessed changes in systemic and VAT-insulin sensitivity.
Materials and Methods
Animals
Male C57BL/6J mice and hemizygous gp91phox-/Y mice of similar age and weighing 22–25 g were purchased from Jackson Laboratories (Bar Harbor, Maine), were housed in a 12 hr light/dark cycle (light on 7:00 am to 7:00 pm) at a constant temperature (24 ± 1°C) and were allowed access to food and water ad libitum. The experimental protocols were approved by the Institutional Animal Use and Care Committee and are in close agreement with the National Institutes of Health Guide in the Care and Use of Animals. All efforts were made to minimize animal suffering and to reduce the number of animals used. However, because the systemic tests below can be stressful, no animal underwent more than one experimental procedure.
Sleep fragmentation
The sleep fragmentation device used to induce SF in rodents has been previously described (11, 12, 16) and employs intermittent tactile stimulation of freely behaving mice in a standard laboratory mouse cage, using a near-silent motorized mechanical sweeper. This method prevents the need for human contact and intervention, introduction of foreign objects or touching of the animals during sleep, and is therefore superior to other existing methods of sleep disruption. To induce moderate to severe sleep fragmentation, we chose a 2-min interval between each sweep, implemented during the light period (7 a.m. to 7 p.m.). Of note, 4 mice were housed in each sleep fragmenter cage to prevent isolation stress, and had ad libitum access to food and water. We should also point out that imposition of SF for extended periods of time is not associated with any measurable changes in sleep duration, such that sleep disruption is imposed in the absence of sleep curtailment or deprivation (11,12).
Surgical procedure and implantation of telemetric transmitter and electrodes for sleep recordings
All surgical procedures were performed under sterile conditions and isoflurane general anesthesia, as previously described (11,12, 16). Briefly, a telemetric transmitter weighing 3.5 g, F20-EET (DSI, Minnesota, USA), which allows simultaneous monitoring of two biopotential channels, temperature and locomotor activity was inserted, biopotential leads were exteriorized, and the abdominal wall was closed. The 2 pairs of biopotential leads were then advanced to the dorsal neck incision the first pair of biopotential leads were fixed to the skull above the frontal area (1mm anterior to bregma and 2mm lateral to mid sagittal suture for one of the leads, and 1mm anterior to lambda and 2.5 mm lateral to mid sagittal suture for the other lead). The other pair of biopotential leads was placed within the same bundle of dorsal neck muscles for the recording of nuchal EMG.
Acclimatization, sleep recording and sleep fragmentation
After complete recovery from surgery (7–10 days), mice were transferred to the sleep fragmenter device for 1-week acclimatization. The recording cages were mounted on a DSI telemetry receiver (RPC-1), which was in turn connected to an acquisition computer through a data exchange matrix. Physiological data were continuously acquired for 24h using Dataquest ART acquisition software (DSI, Minnesota, USA; version 3.1), at a sampling rate of 500 Hz. Data were first scored automatically using Sleepsign software (Kissei Comtec, Japan), and records were visually confirmed or corrected as needed.
Behavior was classified into 3 different states: wake, slow wave sleep (SWS) and rapid eye movement (REM) sleep (11,12, 16). To determine the number of wake events during SF, the mean wake episodes of 2-h bin was calculated). Furthermore to determine the time elapsed following a wake episode to initiation of SWS, the latency in seconds was calculated for each arousal throughout the 24 h period. The time was measured from the beginning of each wake episode to the beginning of the next SWS episode and the mean calculated (17).
GTT and ITT
Both tests were performed following 2 weeks of either sleep control or SF conditions, using protocols described previously (18). Briefly, animals were fasted for 3 hours with water available ad libitum. Sterile glucose (2mg/g of body weight for GTT) or sterile humulin (0.25units/kg of body weight for ITT) was injected intraperitoneally. Blood was sampled from a nick at the tip of the tail at various time points after injection and blood glucose was assessed using an OneTouch Ultra2 glucometer (Life Scan, Inc; Milpitas, CA). Slopes A and B were calculated for GTT using the glucose levels between 0–15 min after glucose injection and those between the peak (30 min) and 120 min after glucose injection, respectively. On the other hand, only Slope A was calculated for ITT using glucose levels between 0 min and the nadir (60 min) after insulin injection. In addition, area under the curve (AUC) was calculated for GTT.
Insulin Sensitivity Assay
Adipocyte insulin sensitivity was assessed as described previously (19). Briefly, primary VAT adipocytes were isolated from epididymal fat pads by collagenase digestion and flotation centrifugation. They were then incubated with insulin at various concentrations at 37°C for 10 min with gentle vortexing every 2 min. After two washes with cold Krebs–Ringer buffer (KRB), cells were lysed in Laemmli buffer and assessed using Western blotting analysis for phosphorylated and total Akt (antiphospho-Akt [Ser473] and anti-Akt; Cell Signaling Technology, Danvers, MA).
Isolation of stromal-vascular fraction (SVF) and flow cytometry analysis
Epididymal fat pads representing VAT were minced in KRB supplemented with 1% BSA and incubated with collagenase (1 mg/mL; Worthington Biochemical Corporation, Lakewood, NJ) at 37°C for 45 min with shaking. Cell suspensions were filtered through a 100 μm mesh and centrifuged at 500 g for 5 min to separate floating adipocytes from the SVF pellet. SVF pellets were then resuspended in FACS buffer (PBS plus 2% FBS) and 106 cells were used for staining with fluorescence-conjugate-primary antibodies or control IgGs at 4°C for 30 min. Cells were then washed twice and analyzed with a flow cytometer (Canto II; BD Biosciences, San Jose, CA). Data analysis was performed using the FlowJo software (Tree Star, Ashland, OR). Adipose tissue macrophages (ATMs) were defined as F4/80+ and CD11b+ cells, from which M1 and M2 macrophages were identified as CD11c+ or CD206+ cells, respectively. All antibodies were from Biolegend (San Diego, CA).
Immunohistochemistry
Sections of formalin-fixed paraffin-embedded adipose tissue were deparaffinized and rehydrated prior to antigen unmasking by boiling in 10 mM sodium citrate, pH 6.0, with 0.05% Tween-20 for 30 min. Sections were blocked in 5% Donkey/Goat serum in PBS with 0.5% Triton X-100 for 1 h followed by incubation with F4/80 and CD11C antibodies at 4°C overnight. Secondary antibody staining was performed using Donkey anti-rat Daylight 488 and Goat anti hamster daylight 649 (Jackson ImmunoResearch, West Grove, PA) and cell nuclei were labeled with the Hoechst dye. Images were captured with a Nikon Eclipse Ti microscope (Nikon Instruments, Melville, NY).
Inflammatory Genes and NADPH Oxidase Expression
mRNA levels of the p47phox subunit in visceral fat were analyzed with qRT-PCR in triplicates, using primers 5′-CAGCCAGCACTATGTGTACA-3′ and 5′-GAACTCGTAGATCTCGGTGAA-3′ (Applied Biosystems, Foster City, CA). Ribosomal 18S rRNA was used as an internal control. The mRNA expression in adipose tissue macrophages of tumor necrosis α (TNF-α), interferon γ (IFN), interleukin-1 (IL-1) and interleukin 6 (IL-6) was determined by quantitative RT-PCR using commercially available specific Taqman primers (Applied Biosystems, Foster City, CA).
-NADPH oxidase activity
1×10⁶ SVF cells were incubated in RPMI-1640 medium containing 2% FBS, 20 mM HEPES, and 5 μM lucigenin. Superoxide-dependent reduction of lucigenin was initialized by the addition of phorbol 12-myristate 13-acetate (PMA, 100 nM). Light emission was recorded using a VICTOR3V plate reader (Perkin Elmer, Waltham, MA) at 30-sec intervals for 30 min and specific NOX activities were determined by subtracting the background level of luminescence of paired samples containing 10 μM diphenyliodonium.
Data analysis
All data are reported as mean ± SE. Comparison of glucose and p47phox mRNA levels among SF and sleep control conditions was performed using one-way ANOVA followed by unpaired Student’s T-test with Bonferroni correction. Comparison of all other quantitative data between SF and sleep control conditions was performed using unpaired Student’s T-tests. For all comparisons, a p value <0.05 was considered as statistically significant.
Results
Long-term SF Increases Sleep Propensity Without Changes In Sleep Duration
Sleep recordings following 15 days of SF exposures were conducted in a separate subset of 5–7 mice/group, and revealed an increased number of awakenings while the SF device was activated, as well as reduced mean sleep latencies among both WT mice and Nox2 null mice, when compared to corresponding controls. However, no significant changes in total sleep duration of sleep state distribution were apparent (Table 1).
Table 1.
Sleep state distribution, mean sleep latency, awakenings, and body weight in wild type and Nox2 null mice subjected to sleep fragmentation for 15 days and controls.
| WT-SC | WT-SF | WT SC vs. SF | Nox2-SC | Nox2-SF | Nox2 SC vs. SF | ||
|---|---|---|---|---|---|---|---|
| State | Time of day | Percentage time spent | Percentage time spent | Significance | Percentage time spent | Percentage time spent | Significance |
| Wake | 7:00 AM – 7:00 PM | 31.78 ± 4.18 | 27.56 ± 3.78 | p>0.05 | 34.29 ± 4.87 | 31.17 ± 4.70 | p>0.05 |
| 7:00 PM – 7.00 AM | 67.9 ± 5.67 | 70.29 ± 6.83 | p>0.05 | 66.5 ± 6.16 | 69.85 ± 6.74 | p>0.05 | |
| SWS | 7:00 AM – 7:00 PM | 51.25 ± 5.42 | 54.18 ± 6.79 | p>0.05 | 55.08 ± 7.7 | 54.4 ± 7.4 | p>0.05 |
| 7:00 PM – 7.00 AM | 21.48 ± 4.46 | 24.46 ± 4.80 | p>0.05 | 20.56 ± 4.52 | 22.11 ± 4.16 | p>0.05 | |
|
REMS Awakenings (#/2 hours) |
7:00 AM – 7:00 PM | 14.96 ± 2.39 | 15.27 ± 3.17 | p>0.05 | 13.73 ± 2.83 | 14.9 ± 2.92 | p>0.05 |
| 7:00 PM – 7.00 AM 7:00 AM – 7:00 PM |
6.5 ± 1.57 12.3± 3.57 |
7.24 ± 2.13 42.3± 4.63 |
p>0.05 p<0.0001 |
7.5 ± 2.05 11.7± 2.93 |
8.1 ± 2.92 41.9± 3.92 |
p>0.05 p<0.0001 |
|
| MSL (min) | 7:00 PM – 7.00 AM | 7.4± 1.2 | 2.1± 0.9 | p<0.0001 | 7.4± 1.2 | 2.1± 0.9 | p<0.0001 |
| Body Weight (grams)* | 26.8±1.7 | 27.2±1.8 | p>0.05 | 25.8±1.6 | 26.0±1.8 | p>0.05 | |
REMS – rapid eye movement sleep; SWS – slow wave sleep; MSL – mean sleep latency; WT vs. Nox2 – no significant differences for all measures.
refers to n=24–36/group
SF Promotes Systemic and Visceral Fat Insulin Resistance
The temporal trajectory of changes in insulin sensitivity in visceral fat, as assessed by Akt phosphorylation in response to insulin, indicated an initial increase in insulin sensitivity after 3 days of SF, followed by subsequent reductions in insulin responsiveness, ultimately manifesting as insulin resistance (Figure 1A, 1B), in the absence of any significant changes in body weight (Table 1).
Figure 1. SF-induced insulin resistance in wild-type, but not Nox2-deficient mice.
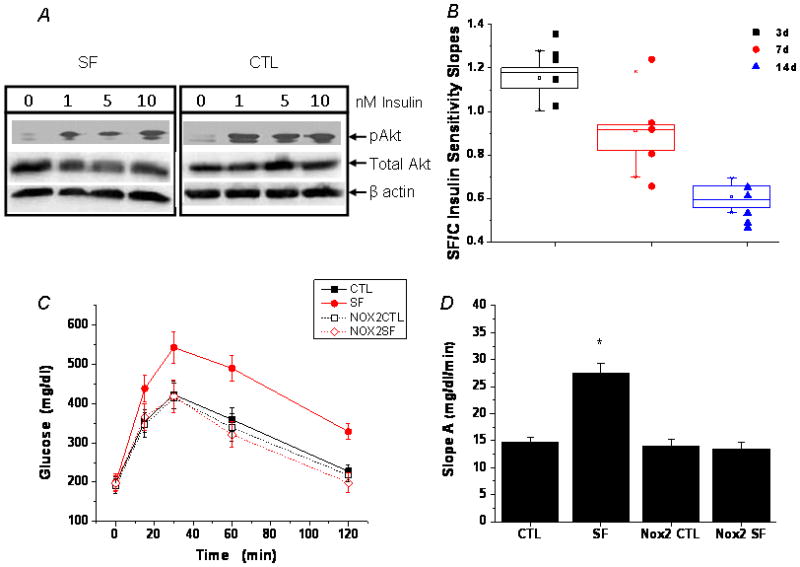
A. Adipocyte insulin sensitivity in WT mice assessed by insulin-induced Akt phosphorylation in adipocytes isolated from epididymal fat pads. Shown are representative Western blots. B. Boxplots of SF-induced temporal alterations in in vitro adipocyte insulin sensitivity in WT mice, cxalculated as the SF vs. control ratio of insulin dose-response slopes. N=5 for each group. Slopes of mice exposed to SF for 3 days were significantly increased (p<0.01) compared to timed controls. After 7 days of SF no significant changes emerged (p>0.1), while after 14 days a dramatic decrease (p<0.00003) in insulin sensitivity became apparent. C. SF-induced glucose intolerance as shown by GTT. Data are mean ± SE; n=6 for each experimental group. D. SF-induced glucose intolerance in WT, but not Nox2-deficient mice as shown by a steeper slope A calculated using the glucose levels between 0–15 min after glucose injection. Data are mean ± SE; n=6 for each group; *P< 0.05 vs. all other three groups. E. SF-induced reduced glucose clearance in WT, but not Nox2-deficient mice as shown by a flatter slope B calculated using glucose levels between the peak (30 min) and 120 min after glucose injection. Data are mean ± SE; n=6 for each group; *P< 0.05 vs. all other three groups. F. SF-induced glucose intolerance in WT, but not Nox2-deficient mice as shown by a greater area under the curve (AUC) after glucose injection. Data are mean ± SE; n=6 for each group; *P< 0.05 vs all other three groups. G. SF-induced insulin insensitivity as shown by ITT. Data are mean ± SE; n=6 for each group. H. SF-induced insulin insensitivity in WT, but not Nox2-deficient mice as shown by a flatter slope A calculated using the glucose levels between 0 min and the nadir (60 min) after insulin injection. Data are mean ± SE; n=6 for each group; *P< 0.05 vs. all other three groups.
In wild type mice, glucose tolerance tests after 2 weeks of SF showed higher glycemic levels and greater area under the curve (AUC) responses (Figure 1C – 1F), and insulin tolerance tests showed clear evidence of reduced insulin sensitivity (Figure 1G, 1H), despite no evidence of increased body weight gains at this time point of SF exposures. In contrast, Nox2-deficient mice exposed to SF for 2 weeks showed no changes in either GTT or ITT responses when compared to littermates exposed to sleep control conditions (Figure 1C–1H).
SF Is Associated with Increased Macrophage Number and Polarization in Visceral Fat
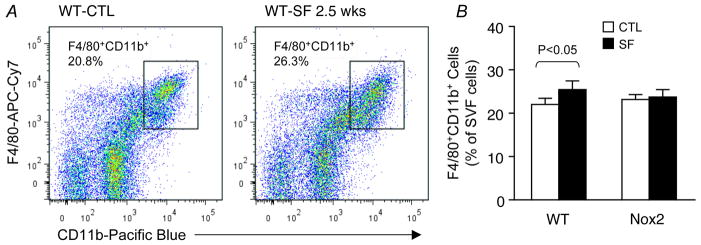
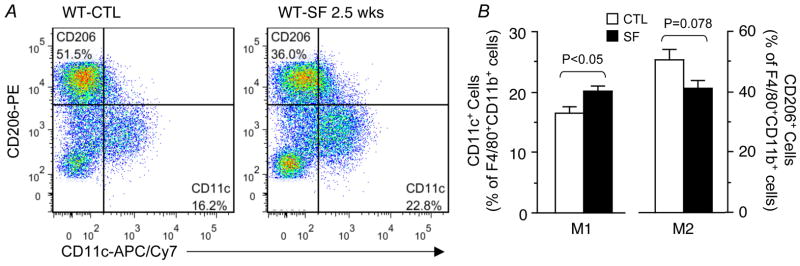
SF for a period of 2–3 weeks induced increases in the global number of macrophages present in the stromal vascular fraction (SVF) of visceral fat in WT mice, but not in Nox2-deficient mice (Figure 2). Such increases consisted primarily of macrophages exhibiting the pro-inflammatory M1 phenotype (Figure 3), which localized mainly in perivascular areas (Figure 4). Interestingly, SF seemed to cause a concurrent reduction in M2 macrophages in SVF in comparison with sleep controls, although the difference between the two groups did not reach significance at this early stage (P=0.078; Figure 3B). SF-induced changes in both M1 and M2 macrophages were conspicuously absent in Nox2-deficient mice exposed to SF. In addition, when compared to control wild type mice, macrophages harvested from visceral fat in mice exposed to SF exhibited increased mRNA expression of TNF-α (3.4 fold; n=6; p<0.01), IL-6 (4.2 fold; n=7; p<0.01), and interferon-γ (2.9 fold; n=6; p<0.03), while no significant changes in IL-1 emerged (p>0.05; n=7). Such changes were absent for all these cytokines in SF-exposed Nox2-deficient mice.
Figure 2. SF-induced increases in global macrophage numbers in visceral fat of wild-type, but not Nox2-deficient mice.

A. A representative flow cytometry analysis showing a moderate increase in the number of F4/80+CD11b+ macrophages in visceral fat of a WT mouse exposed to SF for 2.5 weeks. This phenomenon was absent in Nox2-deficient gp91phox-/Y mice. B. Summary of 4 independent flow cytometry experiments. Data are mean ± SE; n=4 for each group.
Figure 3. SF-induced selective increase in the number of pro-inflammatory M1 macrophages in visceral fat of wild-type, but not Nox2-deficient mice.
A. A representative flow cytometry analysis showing an increase in the number of CD11c+ M1 macrophages in visceral fat of a WT mouse exposed to SF for 2.5 weeks. Such SF-induced effect on the pro-inflammatory M1 subset was not observed in Nox2-deficient gp91phox-/Y mice. B. Summary of 5 independent flow cytometry experiments. Notice that SF-induced decrease in the M2 subset was not significant at this stage of chronic SF. Data are mean ± SE; n=5 for each group.
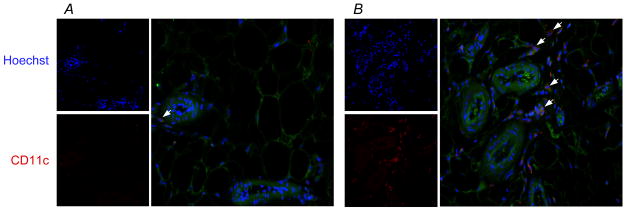
Figure 4. SF induces pro-inflammatory M1 macrophage infiltration in visceral fat.
A. Visceral fat from a WT control mouse immunostained with the M1 marker CD11c. Nuclei were co-stained with the Hoechst dye. Sporadic CD11c+ M1 cells are shown in perivascular areas. B. Visceral fat from a WT mouse exposed to SF for 3 weeks, showing clusters of CD11c+ M1 cells in perivascular areas.
SF Induces Nox2 Expression and Activity in Visceral Fat
WT mice exposed to SF showed time-dependent increases in mRNA expression levels of the p47phox subunit of the NOX2 complex in visceral adipose tissues (Figure 5A). Furthermore, these mice manifested marked increases in NOX enzymatic activities in SVF cells, which were absent in Nox2-deficient mice (Figure 5B, 5C).
Figure 5. SF-induced increases in Nox subunit expression and enzymatic activity in visceral adipose tissue.
A. SF increased p47phox mRNA expression in visceral fat from WT mice. Data are mean ± SD; n=6 for each group. * P<0.05 vs. the control group. B. SVF cells isolated from WT, but not Nox2-deficient gp91phox-/Y mice exposed to SF for 3–4 weeks possessed elevated Nox enzymatic activity. Shown are representative kinetic tracings. C. Summary of 6 enzymatic activity experiments. Data are mean ± SE; n=6 for each group.
Discussion
In the present study, we show that mice that are subjected to sleep disruption during the course of their natural sleep period develop reductions in both systemic and visceral adipocyte cell insulin sensitivity. Similarly, SF induces increased activity of Nox2 in VAT, along with polarization and infiltration of M1-type macrophages in visceral fat. Furthermore, both systemic and VAT SF-induced changes are either markedly attenuated or altogether absent in Nox2-deficient mice.
Systemic and adipose tissue insulin resistance will develop after sleep restriction or even after acute SF in humans (1,7, 20, 21). Such changes in insulin sensitivity have been attributed to altered autonomic nervous system balance, particularly to increases in sympatho-excitatory balance, as well as ascribed to increased activity of the hypothalamic–pituitary–adrenal (HPA) axis, both of which develop after acute sleep restriction (22), since exogenous administration of cortisol and norepinephrine will induce systemic or tissue insulin resistance (23, 24). However, the evidence supporting the activation of the HPA axis has been conflictive (25, 26). Furthermore, we have previously shown that no increases in systemic cortisol or in norepinephrine (data not shown) are detectable in the context of chronic SF exposures (16), suggesting that the effects of chronic SF are most likely mediated by increased oxidative stress (27).
There is now compelling evidence that high fat diet leads to adipose tissue macrophage (ATM) infiltration in white adipose tissue in both humans and mice, and that the magnitude of such infiltration is tightly associated with the degree of adiposity as well as with insulin resistance (28–30). Concurrent with the increased presence of ATM in adipose tissues, there is also a shift in their phenotypes, such that increased populations of M1 ATM are apparent, and most likely represent specific migration of inflammatory monocytes from the circulation (30). Here we show that SF alone (i.e., without sleep restriction and in the absence of high fat diet), is sufficient to induce the polarization of ATM in VF, concurrent with the development of insulin resistance, and that such events precede the onset of accelerated somatic weight accrual. Although our findings do not intend to challenge the potential contributions of sleep restriction to obesity and inflammation (31, 32), they provide initial evidence that inflammatory and metabolic changes may develop during disrupted sleep conditions, even in the absence of sleep curtailment. The absence of such changes in Nox2-deficient mice further supports the concept that initial activation of oxidative stress pathways in the context of SF is a critical and necessary early event that is temporally followed by ATM polarization and onset of insulin resistance (33).
In summary, the present study provides compelling evidence in support of an intimate mechanistic link between sleep integrity, in addition to sleep duration, and metabolic regulatory pathways. Current findings further highlight the role of preserved and intact sleep architecture in the regulation of oxidative stress pathways, whose homeostatic preservation emerges as an essential component for maintaining physiological metabolic functions.
Acknowledgments
DG is supported by National Institutes of Health grants HL65270 and HL86662. AK and SZ were supported by Comer Kids Classic grants.
Footnotes
Conflict of Interest: The authors have no conflict of interest to declare in relation to this manuscript.
Authors Contributions: SZ and AK performed experiments and analyzed data. YW conducted experiments, analyzed data, drafted portions of the manuscript, and served as blinded observer. AC and FH performed GTT and ITT assays. AC and CH performed sleep recordings. BN and MB assisted with technical aspects of adipose tissue insulin sensitivity assays. ZQ performed experiments, particularly immunohistochemistry. DG provided the conceptual design of the project, analyzed data, drafted the manuscript, and is responsible for the financial support of the project and the manuscript content. All authors have reviewed and approved the final version of the manuscript. DG is supported by National Institutes of Health grants HL-65270, HL-086662, and HL-107160. Dr. Gozal is the guarantor of this work, had full access to all the data, and takes full responsibility for the integrity of data and the accuracy of data analysis.
References
- 1.Spiegel K, Leproult R, Van Cauter E. Impact of sleep debt on metabolic and endocrine function. Lancet. 1999;354:1435–9. doi: 10.1016/S0140-6736(99)01376-8. [DOI] [PubMed] [Google Scholar]
- 2.Tasali E, Leproult R, Ehrmann DA, Van Cauter E. Slow-wave sleep and the risk of type 2 diabetes in humans. Proc Natl Acad Sci U S A. 2008;105:1044–9. doi: 10.1073/pnas.0706446105. [DOI] [PMC free article] [PubMed] [Google Scholar]
- 3.Morselli L, Leproult R, Balbo M, Spiegel K. Role of sleep duration in the regulation of glucose metabolism and appetite. Best Pract Res Clin Endocrinol Metab. 2010;24:687–702. doi: 10.1016/j.beem.2010.07.005. [DOI] [PMC free article] [PubMed] [Google Scholar]
- 4.Buxton OM, Pavlova M, Reid EW, Wang W, Simonson DC, Adler GK. Sleep restriction for 1 week reduces insulin sensitivity in healthy men. Diabetes. 2010;59:2126–33. doi: 10.2337/db09-0699. [DOI] [PMC free article] [PubMed] [Google Scholar]
- 5.Pejovic S, Vgontzas AN, Basta M, Tsaoussoglou M, Zoumakis E, Vgontzas A, et al. Leptin and hunger levels in young healthy adults after one night of sleep loss. J Sleep Res. 2010;19:552–8. doi: 10.1111/j.1365-2869.2010.00844.x. [DOI] [PMC free article] [PubMed] [Google Scholar]
- 6.Buxton OM, Cain SW, O’Connor SP, Porter JH, Duffy JF, Wang W, et al. Adverse metabolic consequences in humans of prolonged sleep restriction combined with circadian disruption. Sci Transl Med. 2012;4(129):129ra43. doi: 10.1126/scitranslmed.3003200. [DOI] [PMC free article] [PubMed] [Google Scholar]
- 7.Stamatakis KA, Punjabi NM. Effects of sleep fragmentation on glucose metabolism in normal subjects. Chest. 2010;137:95–101. doi: 10.1378/chest.09-0791. [DOI] [PMC free article] [PubMed] [Google Scholar]
- 8.Gonnissen HK, Hursel R, Rutters F, Martens EA, Westerterp-Plantenga MS. Effects of sleep fragmentation on appetite and related hormone concentrations over 24 h in healthy men. Br J Nutr. 2012;8:1–9. doi: 10.1017/S0007114512001894. [DOI] [PubMed] [Google Scholar]
- 9.Lambeth JD. NOX enzymes and the biology of reactive oxygen. Nat Rev Immunol. 2004;4:181–189. doi: 10.1038/nri1312. [DOI] [PubMed] [Google Scholar]
- 10.Bedard K, Krause KH. The NOX family of ROS-generating NADPH oxidases: physiology and pathophysiology. Physiol Rev. 2007;87:245–313. doi: 10.1152/physrev.00044.2005. [DOI] [PubMed] [Google Scholar]
- 11.Nair D, Zhang SX, Ramesh V, Hakim F, Kaushal N, Wang Y, et al. Sleep fragmentation induces cognitive deficits via nicotinamide adenine dinucleotide phosphate oxidase-dependent pathways in mouse. Am J Respir Crit Care Med. 2011;184:1305–1312. doi: 10.1164/rccm.201107-1173OC. [DOI] [PMC free article] [PubMed] [Google Scholar]
- 12.Ramesh V, Nair D, Zhang SX, Hakim F, Kaushal N, Kayali F, et al. Disrupted sleep without sleep curtailment induces sleepiness and cognitive dysfunction via the tumor necrosis factor-α pathway. J Neuroinflammation. 2012;9:91. doi: 10.1186/1742-2094-9-91. [DOI] [PMC free article] [PubMed] [Google Scholar]
- 13.Bouloumié A, Casteilla L, Lafontan M. Adipose tissue lymphocytes and macrophages in obesity and insulin resistance: makers or markers, and which comes first? Arterioscler Thromb Vasc Biol. 2008;28:1211–3. doi: 10.1161/ATVBAHA.108.168229. [DOI] [PubMed] [Google Scholar]
- 14.Nishimura S, Manabe I, Nagasaki M, Seo K, Yamashita H, Hosoya Y, et al. In vivo imaging in mice reveals local cell dynamics and inflammation in obese adipose tissue. J Clin Invest. 2008;118:710–21. doi: 10.1172/JCI33328. [DOI] [PMC free article] [PubMed] [Google Scholar]
- 15.Donga E, van Dijk M, van Dijk JG, Biermasz NR, Lammers GJ, van Kralingen KW, et al. A single night of partial sleep deprivation induces insulin resistance in multiple metabolic pathways in healthy subjects. J Clin Endocrinol Metab. 2010;95:2963–8. doi: 10.1210/jc.2009-2430. [DOI] [PubMed] [Google Scholar]
- 16.Vijay R, Kaushal N, Gozal D. Sleep fragmentation differentially modifies EEG delta power during slow wave sleep in socially isolated and paired mice. Sleep Science. 2009;2:64–75. [Google Scholar]
- 17.Veasey SC, Yeou-Jey H, Thayer P, Fenik P. Murine Multiple Sleep Latency Test: phenotyping sleep propensity in mice. Sleep. 2004;27:388–393. doi: 10.1093/sleep/27.3.388. [DOI] [PubMed] [Google Scholar]
- 18.Carreras A, Kayali F, Zhang J, Hirotsu C, Wang Y, Gozal D. Metabolic effects of intermittent hypoxia in mice: steady versus high-frequency applied hypoxia daily during the rest period. Am J Physiol Regul Integr Comp Physiol. 2012;303:R700–R709. doi: 10.1152/ajpregu.00258.2012. [DOI] [PMC free article] [PubMed] [Google Scholar]
- 19.Sargis RM, Neel BA, Brock CO, Lin Y, Hickey AT, Carlton DA, et al. The novel endocrine disruptor tolylfluanid impairs insulin signaling in primary rodent and human adipocytes through a reduction in insulin receptor substrate-1levels. Biochim Biophys Acta. 2012;1822:952–960. doi: 10.1016/j.bbadis.2012.02.015. [DOI] [PMC free article] [PubMed] [Google Scholar]
- 20.Broussard JL, Ehrmann DA, Van Cauter E, Tasali E, Brady MJ. Impaired insulin signaling in human adipocytes after experimental sleep restriction. A randomized, crossover study. Ann Intern Med. 2012;157:549–557. doi: 10.7326/0003-4819-157-8-201210160-00005. [DOI] [PMC free article] [PubMed] [Google Scholar]
- 21.Nedeltcheva AV, Kessler L, Imperial J, Penev PD. Exposure to recurrent sleep restriction in the setting of high caloric intake and physical inactivity results in increased insulin resistance and reduced glucose tolerance. J Clin Endocrinol Metab. 2009;94:3242–50. doi: 10.1210/jc.2009-0483. [DOI] [PMC free article] [PubMed] [Google Scholar]
- 22.Kumari M, Badrick E, Ferrie J, Perski A, Marmot M, Chandola T. Self reported sleep duration and sleep disturbance are independently associated with cortisol secretion in the Whitehall II study. J Clin Endocrinol Metab. 2009;94:4801–9. doi: 10.1210/jc.2009-0555. [DOI] [PMC free article] [PubMed] [Google Scholar]
- 23.Fantus IG, Ryan J, Hizuka N, Gorden P. The effect of glucocorticoids on the insulin receptor: an in vivo and in vitro study. J Clin Endocrinol Metab. 1981;52:953–60. doi: 10.1210/jcem-52-5-953. [DOI] [PubMed] [Google Scholar]
- 24.Marangou AG, Alford FP, Ward G, Liskaser F, Aitken PM, Weber KM, et al. Hormonal effects of norepinephrine on acute glucose disposal in humans: a minimal model analysis. Metabolism. 1988;37:885–91. doi: 10.1016/0026-0495(88)90124-2. [DOI] [PubMed] [Google Scholar]
- 25.Tobaldini E, Cogliati C, Fiorelli EM, Nunziata V, Wu MA, et al. One night on-call: Sleep deprivation affects cardiac autonomic control and inflammation in physicians. Eur J Intern Med. 2013 Apr 16; doi: 10.1016/j.ejim.2013.03.011. S0953–6205(13)00095-2 [Epub aheadof print] [DOI] [PubMed] [Google Scholar]
- 26.Reynolds AC, Dorrian J, Liu PY, Van Dongen HP, Wittert GA, et al. Impact of five nights of sleep restriction on glucose metabolism, leptin and testosterone in young adult men. PLoS One. 2012;7(7):e41218. doi: 10.1371/journal.pone.0041218. [DOI] [PMC free article] [PubMed] [Google Scholar]
- 27.Houstis N, Rosen ED, Lander ES. Reactive oxygen species have a causal role in multiple forms of insulin resistance. Nature. 2006;440:944–8. doi: 10.1038/nature04634. [DOI] [PubMed] [Google Scholar]
- 28.Weisberg SP, McCann D, Desai M, Rosenbaum M, Leibel RL, Ferrante AW., Jr Obesity is associated with macrophage accumulation in adipose tissue. J Clin Invest. 2003;112:1796–1808. doi: 10.1172/JCI19246. [DOI] [PMC free article] [PubMed] [Google Scholar]
- 29.Xu H, Barnes GT, Yang Q, Tan G, Yang D, Chou CJ, et al. Chronic inflammation in fat plays a crucial role in the development of obesity-related insulin resistance. J Clin Invest. 2003;112:1821–1830. doi: 10.1172/JCI19451. [DOI] [PMC free article] [PubMed] [Google Scholar]
- 30.Di Gregorio GB, Yao-Borengasser A, Rasouli N, Varma V, Lu T, Miles LM, et al. Expression of CD68 and macrophage chemoattractant protein-1 genes in human adipose and muscle tissues: association with cytokine expression, insulin resistance, and reduction by pioglitazone. Diabetes. 2005;54:2305–2313. doi: 10.2337/diabetes.54.8.2305. [DOI] [PubMed] [Google Scholar]
- 31.Vgontzas AN, Zoumakis E, Bixler EO, Lin HM, Follett H, et al. Adverse effects of modest sleep restriction on sleepiness, performance, and inflammatory cytokines. J Clin Endocrinol Metab. 2004;89(5):2119–26. doi: 10.1210/jc.2003-031562. [DOI] [PubMed] [Google Scholar]
- 32.Mullington JM, Simpson NS, Meier-Ewert HK, Haack M. Sleep loss and inflammation. Best Pract Res Clin Endocrinol Metab. 2010;24(5):775–84. doi: 10.1016/j.beem.2010.08.014. [DOI] [PMC free article] [PubMed] [Google Scholar]
- 33.Lumeng CN, Del Proposto JB, Westcott DJ, Saltiel AR. Phenotypic switching of adipose tissue macrophages with obesity is generated by spatiotemporal differences in macrophage subtypes. Diabetes. 2008;57:3239–3246. doi: 10.2337/db08-0872. [DOI] [PMC free article] [PubMed] [Google Scholar]