Abstract
Ultrasound is an attractive modality for imaging muscle and tendon motion during dynamic tasks and can provide a complementary methodological approach for biomechanical studies in a clinical or laboratory setting. Towards this goal, methods for quantification of muscle kinematics from ultrasound imagery are being developed based on image processing. The temporal resolution of these methods is typically not sufficient for highly dynamic tasks, such as drop-landing. We propose a new approach that utilizes a Doppler method for quantifying muscle kinematics. We have developed a novel vector tissue Doppler imaging (vTDI) technique that can be used to measure musculoskeletal contraction velocity, strain and strain rate with sub-millisecond temporal resolution during dynamic activities using ultrasound. The goal of this preliminary study was to investigate the repeatability and potential applicability of the vTDI technique in measuring musculoskeletal velocities during a drop-landing task, in healthy subjects. The vTDI measurements can be performed concurrently with other biomechanical techniques, such as 3D motion capture for joint kinematics and kinetics, electromyography for timing of muscle activation and force plates for ground reaction force. Integration of these complementary techniques could lead to a better understanding of dynamic muscle function and dysfunction underlying the pathogenesis and pathophysiology of musculoskeletal disorders.
Keywords: Medicine, Issue 79, Anatomy, Physiology, Joint Diseases, Diagnostic Imaging, Muscle Contraction, ultrasonic applications, Doppler effect (acoustics), Musculoskeletal System, biomechanics, musculoskeletal kinematics, dynamic function, ultrasound imaging, vector Doppler, strain, strain rate
Introduction
Musculoskeletal disorders are widely prevalent in adulthood 1. They are a leading chronic condition in the United States 2 and are reported to affect 25% of people worldwide 3. Musculoskeletal disorders are associated with decreased function in activities of daily living (ADL), functional limitations and lower quality of life 4. Their economic burden is significant because of lost productivity and high healthcare costs 4. The pathophysiology of several of these disorders remains inadequately understood. For example, the pathogenesis of osteoarthritis (OA) 4 following reconstruction of anterior cruciate ligament (ACL) injuries has been linked to alterations in quadriceps muscle strength and function 5, but the underlying mechanisms are unclear. To elucidate the underlying mechanisms, there is a need to better understand dynamic muscle function.
The functional assessment of individual muscles, during the performance of a partial or an entire task related to ADL and active lifestyles (i.e. sports) can provide further insight about muscle function and its potential role in the pathogenesis and pathophysiology of these disorders. Further the quantification of muscle function improvement during rehabilitation can be used as an outcome measure. Conventional techniques of measuring muscle and joint function in the clinic involve physical examination such as range of motion, muscle strength and/or muscle group endurance. Currently in the clinic, electromyography (EMG) is used to assess muscle activation/co-activation, frequency, and amplitude of muscle activity. However, EMG is a measure of electrical activation in the muscle and does not necessarily provide information about the muscle strength, contraction ability and other functional factors of the muscle. Other sophisticated biomechanical assessments, such as 3D motion capture system for joint kinetics and kinematics and force plates for ground reaction force can be performed in a gait lab 6-9. The measurements made by these techniques are at the joint level and do not necessarily provide a direct understanding of individual muscle function during a dynamic or functional activity. The ability to perform imaging of the muscle simultaneously while performing a dynamic activity could potentially lead to a better and more realistic functional assessment at the muscle level.
The majority of studies have focused on muscle function in static prone positions, and this method can open new avenues to further enhance our understanding of muscle behavior during real-time situations.
Diagnostic ultrasound can enable direct imaging of muscle and tendons in real time, and therefore is an attractive alternative for measuring musculoskeletal dynamics and function during ADL. Ultrasound-based quantitative measures of muscle morphology and architecture, such as muscle thickness, length, width, cross sectional area (CSA), fiber pennation angle and fascicle length have been widely used 10-12. In recent years, image-processing methods have been employed to assess and quantify these quantitative measures during dynamic tasks 13-14. These advances have enabled a new methodological approach to understanding in vivo muscle function. However, these methods have primarily relied on using conventional grayscale (or B-mode) ultrasound imaging, and therefore have not fully exploited the possibilities of ultrasound to measure tissue velocities, strain and strain rate using Doppler principles, that have been shown to be valuable in evaluating cardiac muscle function 15-16.
We have developed a vector tissue Doppler imaging (vTDI) technique that can measure contraction velocity, strain and strain rate with high temporal resolution (sub millisecond) during dynamic activities 17-18. Specifically, the vTDI technique can make measurements of muscles and tendons during highly dynamic tasks (e.g. drop-landing, gait, etc.) at high frame rates. The vTDI technique is an improvement over conventional Doppler ultrasound, which estimates only the component of the velocity along the ultrasound beam, and is therefore dependent on the insonation angle. vTDI estimates the velocity of the muscle and tendon using two different ultrasound beams steered at different angles, and is therefore independent of the insonation angle in the imaging plane. However, since muscle contraction happens in 3D, the angulation of the imaging plane is still important. We have implemented this method on a commercially available ultrasound system with a research interface, enabling these measurements to be made in a clinical setting.
To investigate the repeatability and potential applicability of the vTDI system in measuring the rectus femoris muscle velocities during a dynamic task, we performed a preliminary study on healthy adult volunteers. This paper demonstrates the methodology and experimental setup for estimating contraction velocities, strain and strain rate of the rectus femoris muscle with sub-millisecond temporal resolution during a drop-landing task.
Protocol
1. Instrumentation
Vector TDI is based on estimating the resultant velocity vector from Doppler velocity measurements taken from two or more independent directions. An ultrasound system with a research interface was used for developing vTDI. The research interface allowed low level beamforming and pulse sequence control using a software development kit (SDK). A 5-14 MHz linear array transducer, consisting of 128 transducer elements and with a 38 mm field of view was used. The research interface was employed to split the array transducer into two transmit and receive apertures and steer the receive beams by 15° with respect to the normal. The transmit beam was focused in the region of interest (e.g. muscle belly). Transmit and receive apertures were set to 32 elements.
Eight subjects, 4 men and 4 women (29.7±6.5 years) were recruited in this study. Kinematic measures from the subjects of the right lower extremities were captured using an eight-camera motion capture system with high speed capability and a sampling rate of 200 Hz. Ground reaction force data during the experiment were obtained through two force plates sampling at 2,000 Hz.
A high-speed camera mounted on a tripod and placed at 2 m from the subject, was used to capture the drop landing at 500 frames/sec.
2. Subject Preparation
Ask the subjects to wear a pair of shorts, sports bra or a short t-shirt and running shoes.
Instruct the subjects to perform a 10 min self-directed warm-up and stretching prior to the data collection. This is to avoid any abnormal muscular contractions and reduce the scope of any muscle cramps.
After the warm-up session, place reflective markers on specific landmarks on the body. Specifically, place calibration markers on the greater trochanters, bilateral medial and lateral knee and medial and lateral malleoli. Place tracking markers on the posterior and anterior superior iliac crests, and place clusters on the thighs and shanks, and five markers on each foot 19-20.
Direct the subjects to the stand in the center of the focus area of the 3D cameras to obtain a static trial. The participants must stand on the force plates with their arms across their shoulders, to obtain static 3D motion capture data.
Then, place the ultrasound transducer in a transducer holder and ensure good contraption, to avoid dislodging of the ultrasound transducer from the transducer holder. The transducer holder was made using Lexen polycarbonate and moldable plastic.
To ensure good contact with the skin and ultrasound transducer, apply generous amount of ultrasound transmission gel on the transducer.
Place the ultrasound transducer along with the transducer holder on the thigh of the subject to image the rectus femoris muscle in the longitudinal axis. The transducer must be placed halfway between the anterior iliac spine and the lateral epicondoyle to image the belly of the rectus femoris muscle. Before securing the ultrasound transducer and the transducer holder to the leg, obtain an axial slice of the quadriceps muscle group. Using this as a guidance, make sure the ultrasound transducer is now imaging the rectus femoris and does not move more lateral or medial, to avoid imaging the vastii muscle group.
Now, use a cohesive self-adhesive bandage to secure the transducer holder onto the subject’s thigh. Make this procedural step does not block or cover the reflective markers. The self-adhesive bandage must not be lax or excessively tight. Lax bandaging will risk the ultrasound transducer to fall during the drop-landing task and an excessively tight bandaging will cause discomfort, disrupt superficial blood flow and possibly alter drop landing dynamics.
Place the high speed camera at least 2 m away from the subject in the sagittal plane to collect videos at a 500 frames/sec. Focus the camera lens to ensure that the entire drop landing sequence of the subject can been captured.
3. Experiment Protocol
Once all the markers and the ultrasound transducer are secure, ask the subjects to stand on a platform of height 30 cm place at 50 cm from the force plates. Ensure that the area around the platform (about 2.5 m) is clear of any objects that could hinder the drop landing task or injure the subject. This includes the ultrasound transducer cord.
Instruct the subjects to place their hands on their hips prior starting the drop landing task and during the entire drop landing sequence.
Start the data collection for ultrasound, 3D motion capture, force plates and the high speed camera prior to start of the drop landing task. Synchronization between the different instruments can be achieved by using a single key press to start all the data acquisition. A pressure sensor attached to the keyboard can be used to generate a synchronizing trigger signal when a specific key is pressed.
Direct the subject to perform the drop-landing task from the platform and land with both legs, simultaneously. Ensure that the subjects drop from box instead of jumping from it. No specific instructions are provided regarding landing technique.
Stop the data collection once the subject has fully stabilized and completed the drop landing sequence.
Repeat this protocol five times per subject.
4. Ultrasound Data Analysis
Export and store the raw data from the ultrasound system to a computer.
The raw radiofrequency (rf) ultrasound data from each receive beam is digitized at 40 MHz. Process the data using MATLAB.
Perform quadrature demodulation on the RF data to remove the carrier frequency. Remove stationary and low-frequency clutter by filtering the quadrature data from each the receive beams and for each depth using a 20 Hz high pass filter.
Estimate the velocities along both receive beams using the conventional autocorrelation velocity estimator 21.
Combine the individual velocity waveforms to obtain lateral (along the transducer) and axial (perpendicular to the transducer) velocity waveforms throughout the drop landing sequence, as seen in Figure 1.
Obtain the magnitude of the resultant velocity vector from the individual velocity components using equation 1 as described previously 22:
 where β is the beam steering angle, f1 and f2 are the two received frequency components and ft is the transmit frequency.
Calculate the lateral and axial strain rate de/dt using the spatial gradients in the lateral and axial velocities.
 where V2 and V1 are instantaneous velocities estimated at two spatial locations separated by a distance L.
Calculate the axial and lateral strain, e, by integrating the axial and lateral strain rate respectively.

5. 3D Motion Capture Data Analysis
Export the 3D motion capture data to a computer for further analysis.
Using the static standing trial, create a kinematic model (pelvis, thigh, shank, and foot) using 3D motion capture software with a least-squares optimization 23.
Use this kinematic model to quantify the motion at the hip, knee, and ankle joints.
Filter the reflective marker trajectories and ground reaction forces using a 4th order low-pass Butterworth filter with a cutoff frequency of 7 Hz and 25 Hz, respectively using 3D motion capture software.
Calculate 3-D joint forces and moments from the kinematic and ground force data using a standard inverse dynamics analysis, using segment inertial characteristics estimated for each participant as per the methods of Dempster. Inter-segmental joint moments are defined as internal moments (e.g. a knee internal extension moment will resist a flexion load applied to the knee).
6. High Speed Camera Data Analysis
Export the videos from the high speed camera data to a computer for analysis and comparison with ultrasound and 3D motion capture kinematic data.
Play the movie at 15 frames/sec and observe the drop landing dynamics.
Then, quantify the movement of the transducer holder and the displacement of the ultrasound transducer during the entire drop landing trial by tracking the visible markers on the anatomical landmarks using the high speed video data. Assessing the drop landing dynamics can also be done simultaneously to better understand the different launch and landing styles.
Representative Results
Representative results from our previous work demonstrating the methods are presented below. While the methods utilized in our current research integrate imaging and motion capture, the representative results presented below are from studies where these measurements were performed separately.
I. Ultrasound (vTDI)
Using the data from the 3D motion capture and the high speed camera, the pattern of subject’s jump, landing and stabilization phases were studied for each trial. The axial and lateral rectus femoris muscle velocities from vTDI were compared to data collected from 3D motion capture and high speed camera. Using this data, the temporal characteristics of the axial and lateral rectus femoris muscle velocities throughout the drop landing sequence were studied. Positive lateral velocities correspond to eccentric contraction of the rectus femoris muscle during knee flexion, while negative lateral velocities correspond to concentric contraction of the muscle during knee extension. This is illustrated in Figure 2. The entire drop-landing sequence for all subjects lasted approximately 1.45±0.27 seconds.
For each subject, the axial and lateral muscle velocities showed a strong repeatability between trials with a slope of 0.99 and R2 = 0.75 (Figure 3). Velocity values for six out of eight subjects were in a similar range of 48-62 cm/sec, while two subjects (both men) had higher velocities. Males (72.96 cm/sec) presented significantly higher muscle velocity than females (48.71 cm/sec), p=0.029, when adjusting for each subject's individual weight and muscle thickness.
The position of the ultrasound transducer was tracked thought the drop-landing sequence using the high-speed camera. The angle between the line segment made between the trochanter and the cuff (green dashed line segment) and the line segment between the mid-thigh and the cuff (purple dashed line segment) was calculated. A total of 16 trials, with 2 trials per subject (trial 1 & 2 relate to subject 1 and so on) are observed in Figure 4. Minimal angular variation (0.91°±0.54 degrees) of the transducer holder relative to the anatomical markers during landing was observed over all 16 trials. The ultrasound transducer angular variation presented a high repeatability as well (ICC2,1 = 0.90, p<0.05).This shows that the transducer movement during the landing trial was minimal and the velocity measurements were not affected due to any transducer movement.
II. 3D Motion Camera & Force Plates
We primarily focused on knee and hip flexion angles, knee valgus angle, and knee valgus moment. We found that during the initial contact with the ground, subjects had the following kinematic patterns: hip flexion 41°±13 degrees, knee flexion 23°±9 degrees, and knee valgus 0.03°±6 degrees. As they progress during the landing phase, the maximum angles attained were: hip flexion 58°±19 degrees, knee flexion 54°±24 degrees, and knee valgus -4°±8 degrees (Figure 5). Knee valgus moment presented a decrease from 0.03±0.03 to 0.1±0.1 Nm/km from initial ground contact to its maximum during the landing phase (Figure 6).
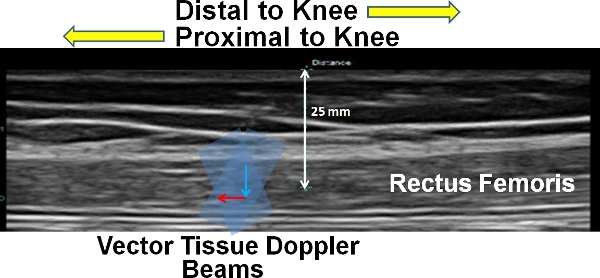 Figure 1. Representation of the vTDI velocity measurement of the rectus femoris muscle. The grey beam represent the two individual transmit and receive beams and the red line represents the lateral velocity component (along proximal-distal direction of the knee) and the blue line represents the axial velocity component (along the thickness of the muscle).
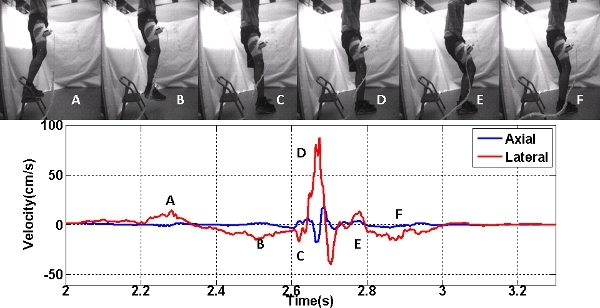 Figure 2. Axial and Lateral velocities during drop landing are compared to the sequence of video frames (upper panel). The lower panel is the axial and lateral velocities, where A corresponds to the initial knee flexion, B corresponds to the knee extension, C corresponds to the toe striking the ground, D corresponds to the heel striking the ground, E corresponds to knee flexion post landing and F corresponds to the knee extension and stabilization.
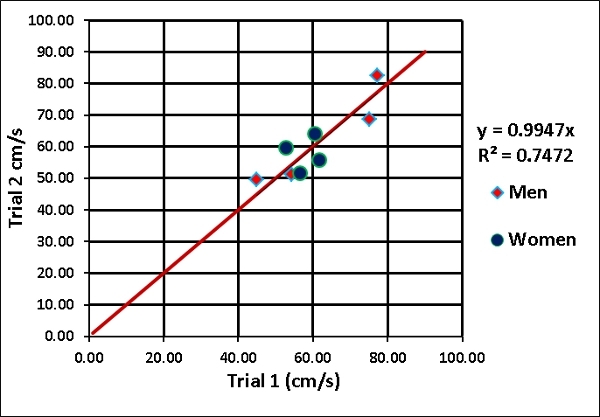 Figure 3. Repeatability of the magnitude of the resultant velocity vector for all 8 subjects (2 trials per subject). Men are denoted in red diamonds and women in blue circles.
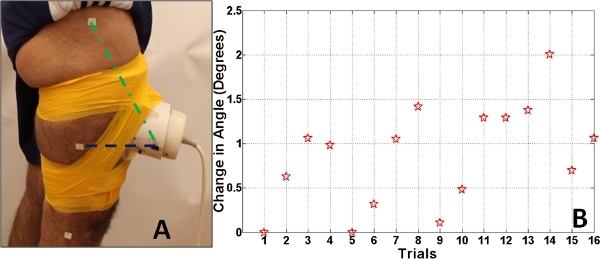 Figure 4. Panel A. The error in the angle between the line segment made by ultrasound transducer holder and the marker on the mid-thigh (purple dashed line segment) and the line segment made by the ultrasound transducer and the marker on the trochanter (green dashed line segment). Panel B. The absolute error in the angle between the line segment made by ultrasound transducer holder and the marker on the mid-thigh and the line segment made by the ultrasound transducer and the marker on the trochanter.
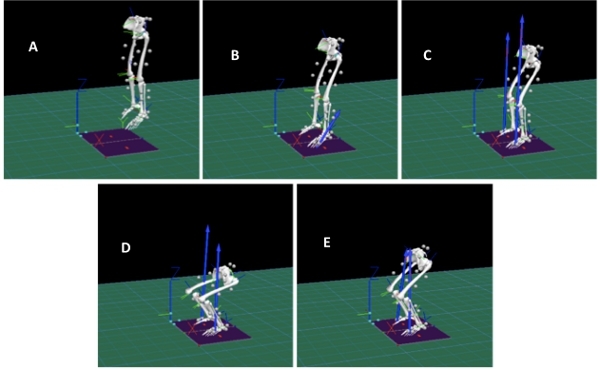 Figure 5. Figure shows the 3D motion capture during the drop landing task. A corresponds to the initial knee flexion for launch from platform, B corresponds to the toe striking the ground, C corresponds to the heel striking the ground, D corresponds to knee flexion post landing and E corresponds to the knee extension and stabilization. Click here to view larger figure.
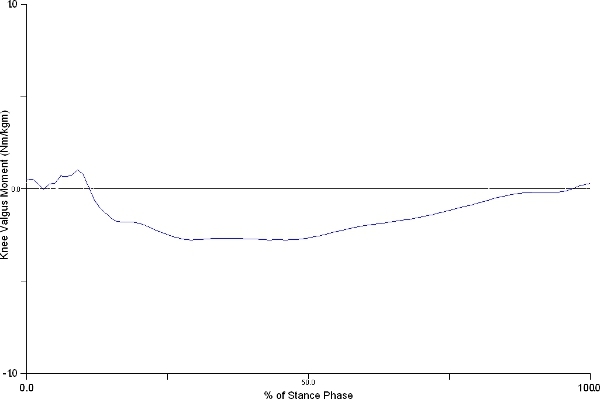 Figure 6. Figure shows representative knee valgus moment changes during the stance phase of drop-jump. Knee valgus moment presented an increase from 0.03±0.03 to 0.1±0.1 Nm/km from initial ground contact to its maximum during the landing phase. Click here to view larger figure.
Discussion
Ultrasound imaging has the ability to provide direct assessment of muscle kinematics in dynamic studies that can complement conventional measures, such as 3D motion capture, dynamometry, electromyography, and ground reaction force measurements. This approach can be broadly applicable for fundamental biomechanics research and clinical evaluation. There are three main approaches to estimating tissue motion using ultrasound: (1) speckle tracking methods that use cross-correlation on raw radiofrequency (RF) ultrasound data or envelope-detected gray scale (or B-mode) image data. These techniques have been widely used in both skeletal 24-25 and cardiac 26 muscle motion tracking and estimation; (2) image processing methods that track the muscle fascicles or features 27-28 and (3) tissue Doppler imaging techniques used in both cardiac 29-30 and skeletal 31 motion estimation. Speckle tracking based on spatial cross-correlation has been used widely to track motion of tissue and can track motion with sub-pixel resolution. However, speckle patterns decorrelate quickly during larger motions. Motion out of the image plane also poses a challenge for speckle tracking. Methods for tracking muscle fascicle length have better applicability where the entire fascicle is visualized in the image during the dynamic task. Methods that rely on processing image data have low temporal resolution limited by the imaging frame rate and hence cannot track motion at high velocities. In addition, these fascicle tracking methods are very sensitive to out of plane motion. Thus probe movement relative to the muscle could cause the tracking to fail. Velocity estimates from conventional tissue Doppler imaging (TDI) can have higher temporal resolution, as well are more robust to small probe movements. Doppler methods can estimate velocities components only along the ultrasound beam, thus Doppler estimates could be inaccurate due to the varying angle of insonation with the motion of the muscle. Our proposed vTDI method overcomes this problem by utilizing two different ultrasound beams steered at different angles; therefore the velocity estimate is independent of the insonation angle in the imaging plane. Also, the effective temporal resolution of vTDI can be approximately 0.1 ms and therefore this method can track motion of skeletal muscle during dynamic activities (e.g. drop-landing, gait and jogging).
Other advantages of our approach include the use of a linear array imaging transducer based on a clinical ultrasound system for performing vector tissue Doppler imaging. We electronically controlled the transmit/receive beam steering, aperture size and focus locations, for scanning a large field of view. Furthermore, this approach can be extended to perform duplex vTDI with simultaneous real time imaging. Our system also allows us to perform conventional B-mode imaging to locate the region of interest for quantification of tissue strain and kinematics. Since this method was implemented on a clinical scanner, we have been able to deploy this vTDI method in a gait lab for biomechanics research.
Limitations of this technique must be acknowledged. Various factors affect the accuracy of Doppler measurements. vTDI based velocity estimates in two dimension (along and across muscle fibers) requires the linear array transducer to be split into two transmit/receive sub-apertures (32 elements wide) and steer the beams by 15°. Steering the ultrasound transmit and receive beams to higher angles could affect velocity measures due to grating lobes. Also, the area of the beam overlap region in vTDI changes with varying beam focus depths 32, potentially affecting the velocity estimates. The variance of the Doppler estimates depend upon (1) acceleration and deceleration of tissue within the analysis time window (2) variance of tissue velocity within the Doppler range gate (3) the varying Doppler angle within the aperture used for Wideband spectral the transmitted and received ultrasound beams, also known as geometric broadening 33 and (4) the bandwidth of the transmitted ultrasound pulse, since the Doppler shift is proportional to the carrier frequency 34. Several methods can be used to limit the variance. Phase based velocity estimators, such as the autocorrelation, typically utilize smaller analysis time windows compared to spectral estimators, but they estimate mean Doppler shift rather than the peak shift. Wideband spectral estimators like the 2D Fourier transform 35 can reduce the variance due to the pulse bandwidth. In the case of vTDI, which utilizes two steered Doppler beams, the variance of tissue velocities in the beam-overlap region relative to the muscle is another factor to consider. The rectus femoris muscle contraction is in 3D and the contraction velocity varies spatially along the muscle. Therefore, it is important to carefully select the region of interest.
In this study, we investigated the repeatability of the rectus femoris muscle kinematics during a drop-landing task in eight healthy volunteers using vTDI. Even though the trials were independent, we observed highly correlated and repeatable peak muscle contraction velocities for individuals between trials. We are currently recruiting more subjects in our study to further examine this pattern. This study has provided non-invasive and real time measurement of the contraction velocities of the rectus femoris muscle during drop-landing. The following patterns of contraction velocities were observed during the various phases of the drop landing task (Figure 2): 1. Muscle contraction velocities dominate in the lateral direction compared to axial direction during the knee flexion (launch phase) and extension (in-the-air phase). This is expected, since the rectus femoris muscle is undergoing eccentric contraction during the launch phase and concentric contraction during in-the-air phase. 2. Low lateral muscle velocities during the third phase (toe touching the ground), with negligibly low axial muscle velocities. This corresponds to lower rectus femoris muscle contraction during this phase 3. Substantial increase in axial and lateral muscle velocities just after the heel touches the ground. This is probably due to the muscle undergoing both eccentric contraction and change in shape due to compression, causing increase in velocities along the muscle fibers and normal to the muscle fibers, respectively. Despite the fact that the drop landing task is a high impact task, vTDI demonstrated repeatable rectus femoris muscle velocities. This ultrasound technique could have clinical impact since this muscle is primarily responsible for protecting the knee joint from excessive loading. Therefore, further assessment of the rectus femoris muscle in patients with ACL reconstruction is warranted to understand the mechanisms leading to the early and accelerated onset of OA.
Although the participants in this study were all asked to perform a natural drop-landing task from a 30 cm tall platform, we found differences in the height of the jump or launch. Also, using the high speed camera data, it was observed that all the subjects had a different drop landing style. This could explain the slight differences between subjects in the peak resultant velocity values of the rectus femoris muscle as a consequence of possible differences in activation patterns during the task. Another possible factor is the differences in cross-sectional area of the rectus femoris muscle, which could potentially lead to different levels of muscle contraction and force production.
Disclosures
None of the authors have any financial disclosures or conflicts of interest and the study was approved by our institution's IRB.
Acknowledgments
This work was supported in part by Grant Number 0953652 from the National Science Foundation and in part by the George Mason University libraries open access publishing fund. We would like to thank Dr. John Robert Cressman Jr. for providing access to the high-speed camera.
References
- Woolf AD, Akesson K. Understanding the burden of musculoskeletal conditions. The burden is huge and not reflected in national priorities. BMJ. 2001;322:1079–1080. doi: 10.1136/bmj.322.7294.1079. [DOI] [PMC free article] [PubMed] [Google Scholar]
- World Health Organization. Health 21: the health for all policy for the WHO European region - 21 targets for the 21st century. Copenhagen: WHO Regional Office for Europe; 1988. [Google Scholar]
- National Center for Health Statistics. National health interview survey. Hyattsville, MD: US Department of Health and Human Services; 1995. [Google Scholar]
- Reginster JY. The prevalence and burden of arthritis. Rheumatology. 2002;41(Supplement 1):3. [PubMed] [Google Scholar]
- Slemenda C, Brandt KD, Heilman DK, et al. Quadriceps weakness and osteoarthritis of the knee. Annals of internal medicine. 1997;127(2):97. doi: 10.7326/0003-4819-127-2-199707150-00001. [DOI] [PubMed] [Google Scholar]
- Rasker JJ. Rheumatology in general practice. British Journal of Rheumatology. 1995;34:494–497. doi: 10.1093/rheumatology/34.6.494. [DOI] [PubMed] [Google Scholar]
- Chopra A, Abdel-Nasser A. Epidemiology of rheumatic musculoskeletaldisorders in the developing world. Best Practice & Research Clinical Rheumatology. 2008;22:583–604. doi: 10.1016/j.berh.2008.07.001. [DOI] [PubMed] [Google Scholar]
- Narayan UG. The role of gait analysis in the orthopedic management of ambulatory cerebral palsy. Current Opinion in Pediatrics. 2007;19:38–43. doi: 10.1097/MOP.0b013e3280118a6d. [DOI] [PubMed] [Google Scholar]
- Ahtiainen JP, et al. Panoramic ultrasonography is a valid method to measure changes in skeletal muscle cross-sectional area. European journal of applied physiology. 2010;108(2):273–279. doi: 10.1007/s00421-009-1211-6. [DOI] [PubMed] [Google Scholar]
- Rutherford OM, Jones DA. Measurement of fibre pennation using ultrasound in the human quadriceps in vivo. European journal of applied physiology and occupational physiology. 1992;65(5):433–437. doi: 10.1007/BF00243510. [DOI] [PubMed] [Google Scholar]
- Fukunaga T, et al. Determination of fascicle length and pennation in a contracting human muscle in vivo. Journal of Applied Physiology. 1997;82(1):354–358. doi: 10.1152/jappl.1997.82.1.354. [DOI] [PubMed] [Google Scholar]
- Miyoshi T, et al. Automatic detection method of muscle fiber movement as revealed by ultrasound images. Medical engineering. 2009;31(5):558–564. doi: 10.1016/j.medengphy.2008.11.004. [DOI] [PubMed] [Google Scholar]
- Cronin NJ, et al. Automatic tracking of medial gastrocnemius fascicle length during human locomotion. Journal of Applied Physiology. 2011;111(5):1491–1496. doi: 10.1152/japplphysiol.00530.2011. [DOI] [PubMed] [Google Scholar]
- Heimdal A, Stoylen A, Torp H, Skjaerpe T. Real-time strain rate imaging of the left ventricle by ultrasound. Journal of American Society of Echocardiography. 1998;11:1014–1019. doi: 10.1016/s0894-7317(98)70151-8. [DOI] [PubMed] [Google Scholar]
- D'hooge J, Bijnens B, Thoen J, Van de Werf F, Sutherland GR, Suetens P. Echocardiographic strain and strain-rate imaging: a new tool to study regional myocardial function. IEEE Trans Med. Img. 2002;21:1022–1030. doi: 10.1109/TMI.2002.804440. [DOI] [PubMed] [Google Scholar]
- Eranki A, et al. Measurement of tendon velocities using vector tissue Doppler imaging: A feasibility study. Conf. Proc. IEEE Eng. Med. & Biol. 2010. pp. 5310–5313. [DOI] [PMC free article] [PubMed]
- Sikdar S, et al. Measurement of rectus femoris muscle velocities during patellar tendon jerk using vector tissue Doppler imaging. Conf. Proc. IEEE Eng. Med. & Biol. 2009. pp. 2963–2966. [DOI] [PMC free article] [PubMed]
- Cortes N, Blount E, Ringleb S, Onate J. Soccer-specific video simulation for improving movement assessment. Sports biomechanics / International Society of Biomechanics in Sports. 2011;10(1):12–24. doi: 10.1080/14763141.2010.547591. [DOI] [PubMed] [Google Scholar]
- Quammen D, Cortes N, Van Lunen B, Lucci S, Ringleb S, Onate J. The effects of two different fatigue protocols on lower extremity motion patterns during a stop-jump task. J Athl Train. 2012;47(1):32–41. doi: 10.4085/1062-6050-47.1.32. [DOI] [PMC free article] [PubMed] [Google Scholar]
- Kasai C, Namekawa K, Koyano A, Omoto R. Real-time two-dimensional blood flow imaging using autocorrelation technique. IEEE Trans. Sonics Ultrasonics. 1985;Su-32:458–464. [Google Scholar]
- Pastorelli A, Torricelli G, Scabia M, Biagi E, Masotti L. A real-time 2-D vector Doppler system for clinical experimentation. IEEE Trans. Med. Imag. 2008;27:1515–1524. doi: 10.1109/TMI.2008.927337. [DOI] [PubMed] [Google Scholar]
- Lu T-W, O'Connor JJ. Bone position estimation from skin marker co-ordinates using global optimisation with joint constraints. Journal of Biomechanics. 1999;32:129–134. doi: 10.1016/s0021-9290(98)00158-4. [DOI] [PubMed] [Google Scholar]
- Cronin NJ, Lichtwark G. The use of ultrasound to study muscle-tendon function in human posture and locomotion. Gait & Posture. 2012. [DOI] [PubMed]
- Loram ID, Maganaris CN, Lakie M. Use of ultrasound to make noninvasive in vivo measurement of continuous changes in human muscle contractile length. Journal of applied physiology. 2006;100(4):1311–1323. doi: 10.1152/japplphysiol.01229.2005. [DOI] [PubMed] [Google Scholar]
- D'hooje J, Heimdal A, Jamal F, et al. Regional strain and strain rate measurements by cardiac ultrasounds: principles, implementation and limitations. Eur J Echocardiogr. 2000;1:154–170. doi: 10.1053/euje.2000.0031. [DOI] [PubMed] [Google Scholar]
- Yeung F, et al. Feature-adaptive motion tracking of ultrasound image sequences using a deformable mesh. Medical Imaging, IEEE Transactions on. 1998;17(6):945–956. doi: 10.1109/42.746627. [DOI] [PubMed] [Google Scholar]
- Duan Q, et al. Tracking of LV endocardial surface on real-time three-dimensional ultrasound with optical flow. Functional Imaging and Modeling of the Heart. 2005. pp. 873–875.
- Miyatake K, et al. New method for evaluating left ventricular wall motion by color-coded tissue Doppler imaging: in vitro and in vivo studies. Journal of the American College of Cardiology. 1995;25(3):717–724. doi: 10.1016/0735-1097(94)00421-L. [DOI] [PubMed] [Google Scholar]
- Nagueh SF, et al. Doppler estimation of left ventricular filling pressure in sinus tachycardia: a new application of tissue Doppler imaging. Circulation. 1998;98(16):1644–1650. doi: 10.1161/01.cir.98.16.1644. [DOI] [PubMed] [Google Scholar]
- Grubb NR, et al. Skeletal muscle contraction in healthy volunteers: assessment with Doppler tissue imaging. Radiology. 1995;194(3):837–842. doi: 10.1148/radiology.194.3.7862989. [DOI] [PubMed] [Google Scholar]
- Eranki A, AlMuhanna K, Sikdar S. Characterization of a vector Doppler system based on an array transducer. Ultrasonics Symposium (IUS) 2010.
- Newhouse VL, et al. The dependence of ultrasound Doppler bandwidth on beam geometry. IEEE Trans. Sonics Ultrason. 1980;27(2):50–59. [Google Scholar]
- Baker DW, Rubenstein SA, Lorch GS. Pulsed Doppler echocardiography: principles and applications. The American journal of medicine. 1997;63(1):69–80. doi: 10.1016/0002-9343(77)90119-x. [DOI] [PubMed] [Google Scholar]
- Loupas T, Gill RW. Multifrequency Doppler: improving the quality of spectral estimation by making full use of the information present in the backscattered RF echoes. IEEE Trans. Ultrasonics, Ferroelect. Freq. Contr. 1994;41:522–531. [Google Scholar]


