Abstract
The generation of cardiomyocytes from human embryonic stem cells (hESC) enables a variety of potential therapeutic and diagnostic applications. However, progress is challenged by the low efficiency of cardiomyocyte differentiation. Recently, Kattman et al., 2011 showed that individual hESC lines required proper balance of the Activin A and BMP4 signaling for efficient cardiac differentiation, presenting their differentiation protocols for several human and mouse ESC lines. However, two of the most utilized hESC lines, H7 and H9, were not included. Therefore, we set out to verify the published methodology for highly efficient cardiac specification and investigate the cardiac differentiation in the H7 and H9 ESC lines. Our studies examined a range of time points for the initial culture of hESC as embryoid bodies (EB) prior to transfer to monolayer culture, as well as, concentrations of Activin A and BMP4 in the medium formulations. The results highlight an efficient protocol for reproducibly generating cultures with approximately 50% cardiomyocytes from H7 and H9 ESC lines.
Keywords: Human Embryonic Stem Cells, Cardiomyocytes, Stem Cell Differentiation
Introduction
Functional cardiomyocytes differentiated from human embryonic stem cell (hESC) offer a potentially unlimited cell source for therapies; however, large numbers of cells (approximately 1-5 million cells per injection) are thought to be required. Although the commonly used embryoid body (EB) formation protocol for hESC cardiac differentiation generates only 8% cardiomyocytes,[1] recent studies have shown that Activin A/BMP4 signaling induces mesoderm with enhanced numbers of cardiomyocytes (30%).[2-5] Most recently, Kattman et al. reported that each ESC line required individual and stage-specific titrations of Activin A/BMP4 signaling levels. These optimized methods generate over 60% cardiomyocytes from H1 and HES2 hESC.[6] However, this work did not analyze protocols of the most frequently used hESC: H7 and H9, comprising 10% and 37% of hESC publications, respectively.[7] Based on this groundbreaking cardiac differentiation scheme,[6] we examined 1) the kinetics of differentiation and 2) the supplemental volumes of Activin A and BMP4 for cardiac fate from the H7 and H9 using a less expensive basal medium.
Results
The three stages involved in the differentiation of hESC to cardiomyocytes include: 1) the formation of a primitive-streak; 2) the induction and specification of cardiac mesoderm; and 3) final expansion.[2] By optimizing the number of days for EB induction, BMP4 concentration in the first 24 hours of differentiation, and Activin A/BMP4 concentrations from day 1-4, the protocols (Figure 1) described here can reproducibly generate high numbers of H7 and H9 hESC towards the cardiac lineage.
Figure 1.
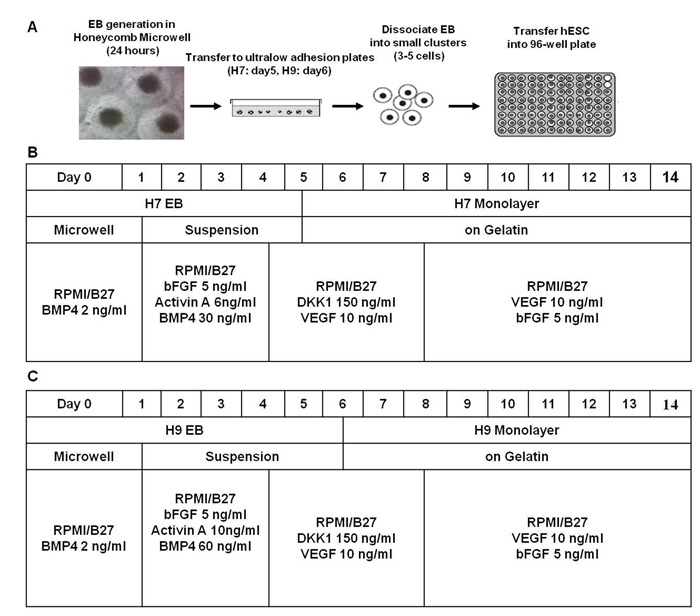
Figure 1: Scheme for hESC cell culture manipulation and methods. (A) Embryoid bodies (EB) were generated from small clumps (3-5 cells) in honeycomb microwells and then transferred to suspension culture. At indicated time points, EBs were dissociated into small clumps (3-5 cells) and plated down as monolayer on gelatin in 96-well flat bottom plate. Overall optimized differentiation schemes for the first 14 days of cardiac induction of H7. The optimized stage-specific differentiation scheme for generating cardiac cells from (B) H7 and (C) H9 hESC.
Optimal Dissociation Day Promotes the Generation of Cardiac Mesoderm
Takei, et al. showed that the expression of Brachyury increased continuously up to day 4 followed by a sudden reduction by day 5,[8] and according to Kattman et al., EB containing large KDR/PDGFR-α populations can generate highly enriched cardiomyocytes.[6] Therefore, at days 4-7, the percentage of KDR+/PDGFR-α+ in suspended EB were analyzed for the timepoint in which the EB contained the highest percentage of cardiac mesoderm. Results indicate that H7 EB collected on day 5 express the highest percentage (14.9%±2.3%) of KDR+/PDGFR-α+ cells (Figure 2A), whereas H9 EB collected on day 6 contain the highest yield (15.8%±0.6%) of KDR+/PDGFR-α+ population (Figure 2B).
Figure 2.
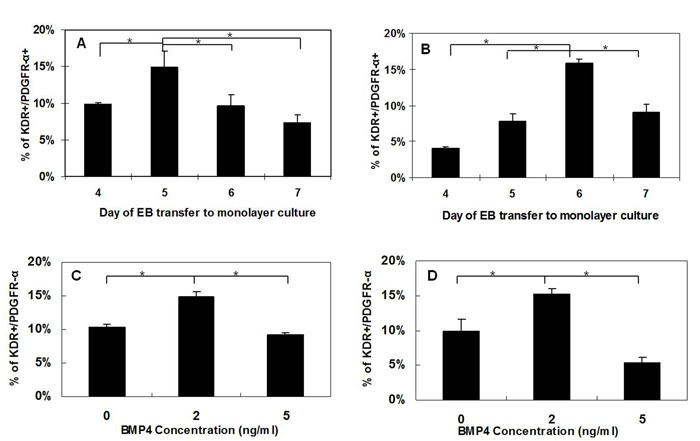
Figure 2: Optimization of day for EB dissociation and initial BMP4 treatment. EB were generated from small clumps (3-5 cells) in honeycomb microwells at day 0 with 2ng/ml BMP4 and then transferred to suspension culture with 0ng/ml Activin A and 30ng/ml BMP4. EB were collected from day 4 to day 7 and then dissociated in to single cells for FACS analysis of KDR/PDGFR-α. (A) H7 EB collected on day 5 expressed highest percentage of KDR+/PDGFR-α+ cells. (B) H9 EB collected on day 6 contained the highest percentage of KDR+/PDGFR-α+ cells. The optimization of initial (first 24 hours) BMP4 concentration in RPMI/B27 medium is also included for (C) H7 EB and (D) H9 EB with 0 ng/ml , 2 ng/ml and 5 ng/ml BMP4 treatment in the first 24 hours and then transferred to suspension culture with 0ng/ml Activin A and 30ng/ml BMP4. H7 EB were collected and dissociated into single cells for FACS analysis on day 5. H9 EB were collected and dissociated into single cells for FACS analysis on day 6. Both H7 and H9 EB treated with 2 ng/ml of BMP4 contained highest percentage of KDR+/PDGFR-α+ cells (*, P< 0.1).
Optimal BMP4 Concentration (First 24 Hours) for Generating Cardiac Mesoderm
Kattman et al. reported that optimal concentrations of BMP4 (0.5 - 5 ng/ml) during the first 24 hour of EB formation varied between the different ESC lines.[6] Therefore, we investigated the effect of BMP4 concentration in the first 24 hours on cardiac mesoderm generation followed by transfer to suspension culture with 0ng/ml Activin A and 30ng/ml BMP4 for 4 days for H7 and 5 days for H9. [Note that preliminary studies used 10ng/ml BMP4 with varied concentrations of activin A, but only very low numbers (~3%) of cTnI and Nkx2.5 expressing cells were obtained on day 14 (data not shown). Therefore, we began these studies using 30ng/ml of BMP4 as the lowest value of BMP4 upon transfer to suspension culture]. Results show that both H7 and H9 EB treated with 2 ng/ml of BMP4 from day 0 contained highest percentage (~14%) of KDR+/PDGFR-α+ population from both H7 (Figure 2C) and H9 (Figure 2D).
Optimal Combinations of Activin A and BMP4 for the Induction of Cardiac Mesoderm and Cardiomyocytes
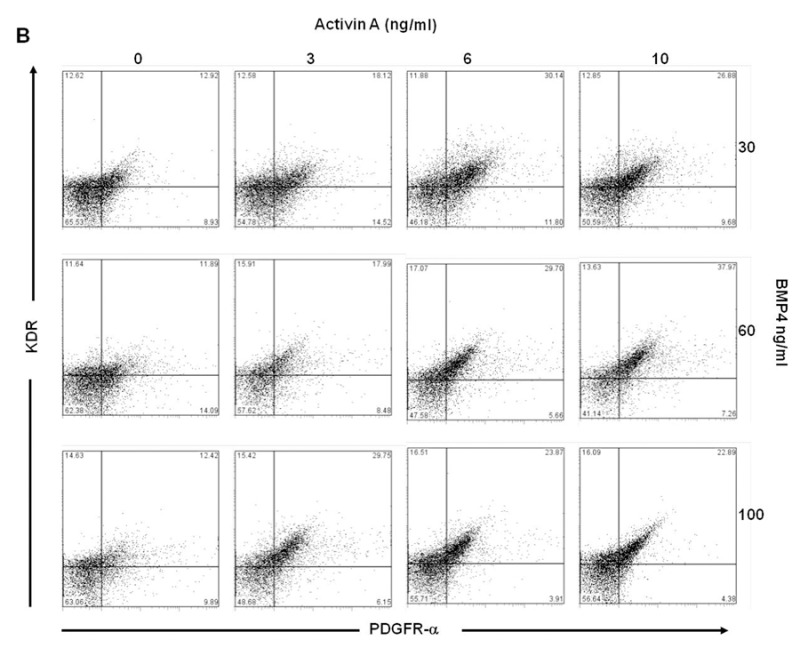
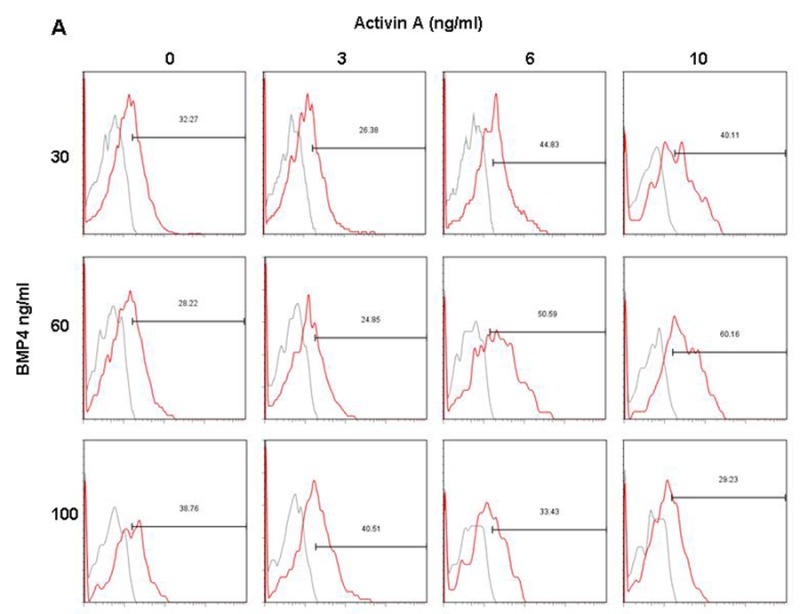
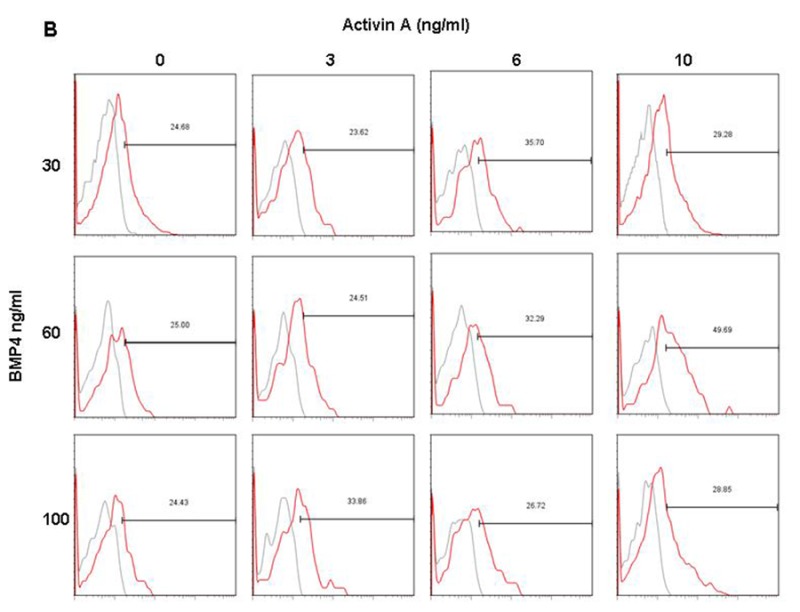
In order to determine the combinations of Activin A and BMP4 from day 1 to day 4 in generating large KDR+/PDGFR-α+ populations, EB were cultured in suspension with varying concentrations of Activin A (0 – 10 ng/ml) and BMP4 (30 – 100 ng/ml) from day 1 to day 4. Results indicated that treatments at 6 ng/ml Activin A and 30 ng/ml BMP4 resulted in the highest KDR+/PDGFR-α+ population (~24%) in H7 (Figures 3A and Supplementary Figure 1A), and H9 (Figures 3B and Supplementary Figure 1B) required higher concentrations of both of Activin A (10 ng/ml) and BMP4 (60 ng/ml) to generate the optimal KDR+/PDGFR-α+ populations (~34%).
Figure 3.
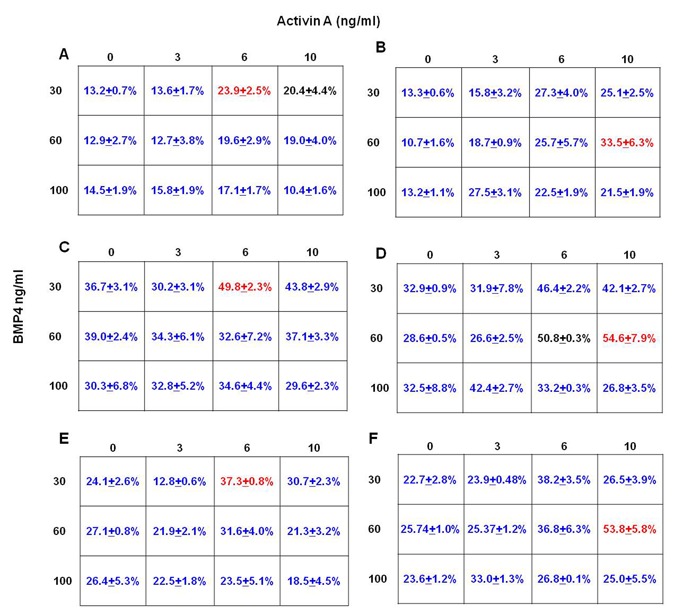
Figure 3: Induction of KDR+/PDGFR-α+ cells in H7 and H9 EB, and day 14 cardiac cells from H7 and H9 hESC with varying concentrations of Activin A and BMP4 from day 1 to day 4. (A) H7 EB cultured in medium with 6 ng/ml Activin A and 30 ng/ml BMP4 contained highest percentage of KDR+/PDGFR-α+ cells (highlighted in red). (B) H9 EB cultured in medium with 10 ng/ml Activin A and 60 ng/ml BMP4 contained highest percentage of KDR+/PDGFR-α+ cells (highlighted in red). The percentage of KDR+/PDGFR-α+ cells in red is significantly greater compared withdata in blue (P<0.1), but not black. H7 differentiated cells cultured in medium with 6 ng/ml Activin A and 30 ng/ml BMP4 from day 1 to day 4 also contained highest percentage of (C) cTnI+ and (E) Nkx2.5+ cells (highlighted in red). H9 cultured in medium with 10 ng/ml Activin A and 60 ng/ml BMP4 from day 1 to day 4 also contained highest percentage of (D) cTnI+ and (F) Nkx2.5+ cells (highlighted in red). Again, the percentages of cTnI+ and Nkx2.5+ cells in red are significantly greater than those in blue (P<0.1), but not blackcontained highest percentage of KDR+/PDGFR-α+ cells (*, P< 0.1).
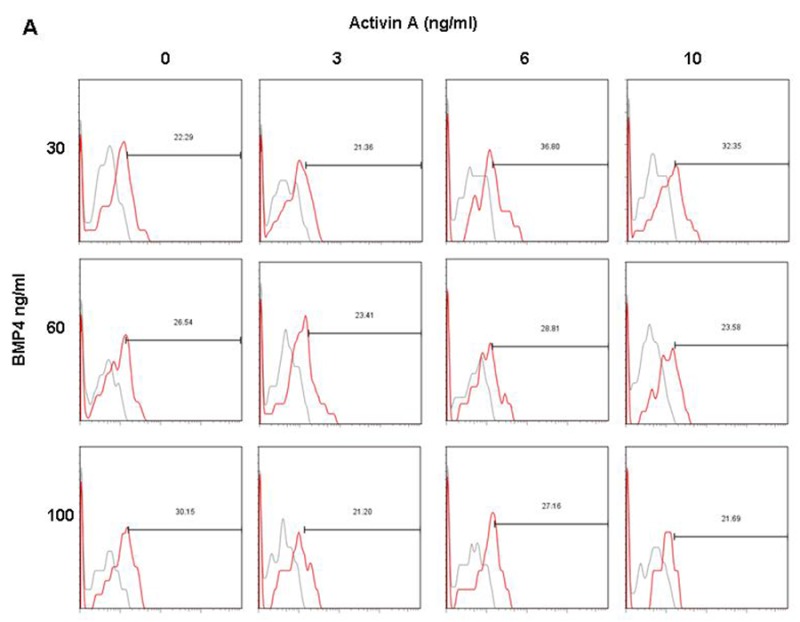
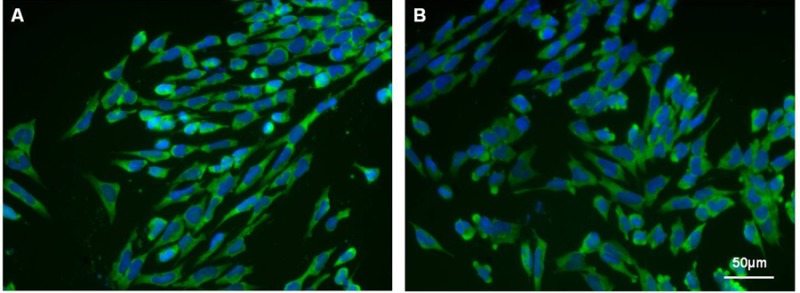
Analysis of cardiac specific markers, cTnI and Nkx2.5, in H7 and H9 monolayers at day 14 produced optimal numbers at 6 ng/ml Activin A and 30 ng/ml BMP4 and 10 ng/ml Activin A with 60 ng/ml BMP4 for H7 and H9, respectively (Figures 3 C-F). Under the optimal stage-specific culture conditions, differentiated H7 monolayer cultures (day 14) contain approximately 50% cTnI+ (Figures 3C and Supplemental Figure 2A) and 38% Nkx2.5+ (Figures 3E and Supplemental Figure 2B) cells; whereas H9 monolayer cultures contain approximately 55% cTnI+ (Figures 3D and Supplemental Figure 3A) and 54% Nkx2.5+ (Figures 3F and Supplemental Figure 3B) cells. Immunostaining of H7 and H9 monolayers with cTnI at day 14 also confirm that the hESC were directed towards the cardiac lineage (Supplemental Figure 4). Lastly, monolayers of differentiated H7 and H9 exhibit spontaneous beating at day 13 (Supplemental Movie S1), showing that the H7 and H9 hESC had developed into functional cardiomyocytes.
Discussion
Using the stage-specific optimization strategy outlined in Kattman et al., [6] we show that these methods also can be used on two of the most prevalent and accessible hESC: H7 and H9. We verify that co-expression of KDR/PDGFR-α predicts the emergence of cardiovascular mesoderm, and that the kinetics of differentiation varies between cell lines. Lastly, the results support the finding that different cell lines require a balance of Activin A/ BMP4 signaling for efficiently generating KDR+/PDGFR-α+ cardiovascular mesoderm population.
The differentiation of hESC into cardiomyocyte has also been reported by a number of researchers. [2, 4, 6, 9] The first group to identify the value of high density monolayer cultures for efficient differentiation of cardiomyocytes, [4] has recently also published updated protocols using sequential treatment with 100 ng/ml activin A on day 0 and 10 ng/ml BMP4 on day 1 in H7 hESC.[3] This method plates hESC at high density on Matrigel, resulting in 35-40% Nkx2.5-postive cells. Another group rigorously examined a multiple factors in cardiac differentiation in order to generate a universal protocol for cardiomyocyte induction. This group examined H1, H9, and several iPS cell lines and showed the stage-specific optimization of a high number of factors also lead to the generation of 64-89% cardiac troponin-I+ cells.[9] Together, our results show that cardiomyocyte differentiation from hESC can be enhanced using stage-specific culture conditions that involve precise growth factors, importantly Activin A and BMP4. The differentiation methods described here for H7 and H9 hESC, combined with those reported by other groups: H1 and HES2, [6] and H1 and H9, [9] provide valuable model systems of cardiogenesis in vitro.
Supplementary Materials and Methods
Human Embryonic Stem Cell Culture and Differentiation
Native H7 hESC (WA07, WISC Bank) and H9 hESC - transfected with green fluorescence protein (GFP) expression linked to the α-myosin heavy chain (MHC) promoter (courtesy of Bernstein Lab, UCSF) - were maintained in mouse embryonic fibroblast (MEF)-conditioned medium supplemented with 5 ng/ml basic fibroblast growth factor (bFGF, Sigma) and plated on tissue cultured plates coated with Matrigel (BD) according to previously published protocols. When the hESC on the tissue culture plates were 80% confluent, they were detached using Accutase (Invitrogen), and dissociated into small clumps (3-5 cells). The cells were then spun down and re-suspended in 2ml Roswell Park Memorial Institute (RPMI; Invitrogen) medium supplemented with 2% B27 (Invitrogen). To generate EB, a 400-µm Honeycomb Microwell microchip[10] was placed into each well of a standard 24-well plate and 6×10⁵ cells were added to the Microwell. Cells then settle into the bottom of microwells by gravity, facilitating the formation of large numbers of uniformly-sized EB. Ten μM of ROCK inhibitor (Y-27632; EMD) was added during EB formation to enhance cell survival. After 24 hours, uniform EB were formed in Microwell and then transferred to ultra-low attachment plates (Corning) in RPMI/B27 media. Then EB were dissociated into small clusters (3-5 cells) by gentle pipetting. 1×10⁵ cells were seeded into individual wells of a 96-well flat bottom plate (BD) coated with 0.5% gelatin in RPMI/B27 media (Figure 1). Cell numbers were estimated by dissociation of parallel culture with trypsin (Invitrogen). The growth factors were added with the following sequence: day 0-1, varying concentration of BMP4 (0-5 ng/ml); day 1-4, varying concentration of Activin A (0-10 ng/ml), varying concentration of BMP4 (30-100 ng/ml) and 5ng/ml bFGF; day 4-8, 150ng/ml DKK1 and 10ng/ml VEGF; day 8-14, 5ng/ml bFGF and 10ng/ml VEGF. All growth factors were purchased from R&D Systems, Inc. The medium was replaced daily.
Flow Cytometry and Fluorescent Microscopy
EB and cardiac culture generated from hESC differentiation experiments were dissociated into single cells by incubation with cell dissociation buffer (enzyme free, PBS-based, Invitrogen). The cells were stained with the following antibodies: anti-KDR-phycoerythrin (Biolegend), anti-PDGFR-α-allophycocyanin (R&D), anti-cardiac Troponin I (cTnI) (US Biological) and anti-Nkx2.5 (R&D). For cell surface markers, staining was carried out in PBS with 1% BSA. For intracellular proteins, immunostaining was carried out on cells fixed with 4% paraformaldehyde (Tousimis Research Corporation) in PBS and permeablization with 0.7% Triton X100 for 15 minutes. Stained cells were analyzed on an LSRII flow cytometer (BD). For fluorescent microscopy, day 14 hESC-derived cardiac monolayers were fixed and permeabilized as above. Cells were stained for cTnI (US Biological) and DAPI (Calbiochem). Mouse IgG1 and IgG2b (Sigma) were used as isotype controls.
Statistics
Data are presented as mean ± standard deviation for two independent sets of experiments. All experiments were repeated a minimum of 2 times. Statistical significance was measured using a nonparametric Wilcoxon T-test to individually compare between all groups.
Supplementary Information
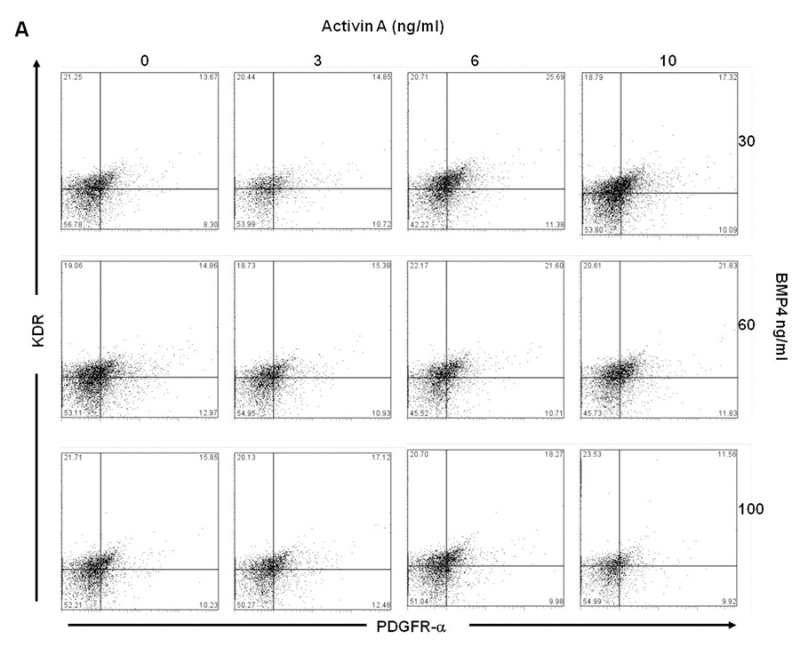
Dot plots of KDR/PDGFR-α expression of (A) H7 and (B) H9 EB with varying concentrations of Activin A and BMP4 during day 1 to day 4 of culture.
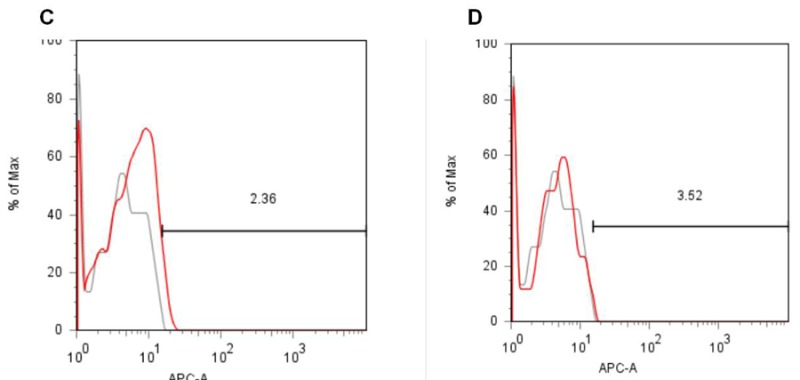
Percentage of cardiac cells from H7 hESC. The histograms represent the expression of cardiac markers (A) cTnI and (B) Nkx2.5 expression in H7 at day 14 with isotype controls for IgG1 both (C) Nkx2.5 and (D) cTnI.
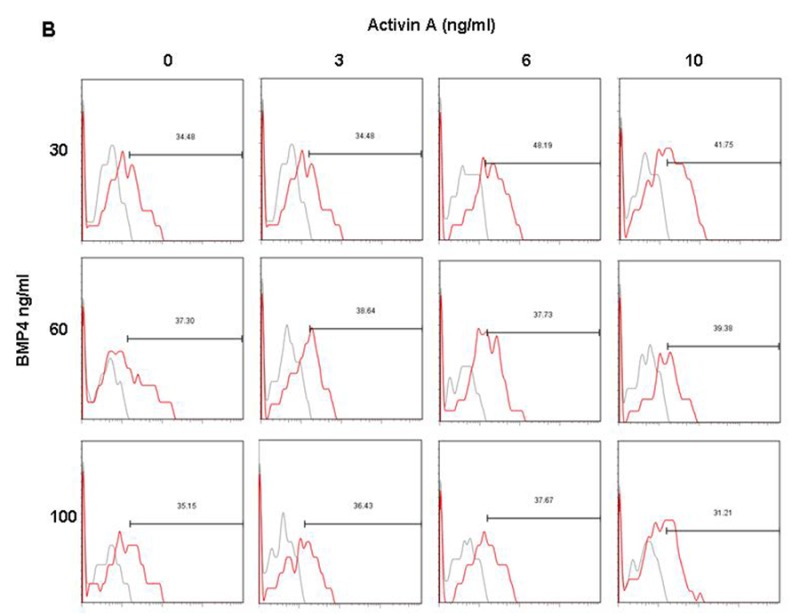
Percentage of cardiac cells from H9 hESC. The histograms represent the expression of (A) cTnI and (B) Nkx2.5 expression in H9 at day 14.
Immunostaining for cTnI at day 14. The H7 (A) and H9 (B) cells were imaged under immunofluorescently stained with cardiac troponin I (green) and DAPI (blue).
Supporting Figure 1.
Acknowledgements
This work was funded by a New Faculty Award II from the California Institute of Regenerative Medicine (RN2-00921-1).
References
- 1.Kehat I, Kenyagin-Karsenti D, Snir Met al. Human embryonic stem cells can differentiate into myocytes with structural and functional properties of cardiomyocytes. J Clin Invest. 2001;108:407-414 [DOI] [PMC free article] [PubMed] [Google Scholar]
- 2.Yang L, Soonpaa MH, Adler EDet al. Human cardiovascular progenitor cells develop from a KDR+ embryonic-stem-cell-derived population. Nature. 2008;453:524-528 [DOI] [PubMed] [Google Scholar]
- 3.Xu C, Police S, Hassanipour Met al. Efficient generation and cryopreservation of cardiomyocytes derived from human embryonic stem cells. Regen Med. 2011;6:53-66 [DOI] [PMC free article] [PubMed] [Google Scholar]
- 4.Laflamme MA, Chen KY, Naumova AVet al. Cardiomyocytes derived from human embryonic stem cells in pro-survival factors enhance function of infarcted rat hearts. Nat Biotechnol. 2007;25:1015-1024 [DOI] [PubMed] [Google Scholar]
- 5.Nostro MC, Cheng X, Keller GMet al. Wnt, activin, and BMP signaling regulate distinct stages in the developmental pathway from embryonic stem cells to blood. Cell Stem Cell. 2008;2:60-71 [DOI] [PMC free article] [PubMed] [Google Scholar]
- 6.Kattman SJ, Witty AD, Gagliardi Met al. Stage-specific optimization of activin/nodal and BMP signaling promotes cardiac differentiation of mouse and human pluripotent stem cell lines. Cell Stem Cell. 2011;8:228-240 [DOI] [PubMed] [Google Scholar]
- 7.Loser P, Schirm J, Guhr A, et al. Human embryonic stem cell lines and their use in international research. Stem Cells. 2010;28:240-246 [DOI] [PMC free article] [PubMed] [Google Scholar]
- 8.Takei S, Ichikawa H, Johkura K, et al. Bone morphogenetic protein-4 promotes induction of cardiomyocytes from human embryonic stem cells in serum-based embryoid body development. Am J Physiol Heart Circ Physiol. 2009;296:H1793-1803 [DOI] [PubMed] [Google Scholar]
- 9.Burridge PW, Thompson S, Millrod MA, et al. A universal system for highly efficient cardiac differentiation of human induced pluripotent stem cells that eliminates interline variability. PLoS One.6:e18293. [DOI] [PMC free article] [PubMed] [Google Scholar]
- 10.Nguyen D, Sa S, Pegan JD, et al. Tunable shrink-induced honeycomb microwell arrays for uniform embryoid bodies. Lab on a chip. 2009;9:3338-3344 [DOI] [PubMed] [Google Scholar]
Associated Data
This section collects any data citations, data availability statements, or supplementary materials included in this article.
Supplementary Materials
Dot plots of KDR/PDGFR-α expression of (A) H7 and (B) H9 EB with varying concentrations of Activin A and BMP4 during day 1 to day 4 of culture.


Percentage of cardiac cells from H7 hESC. The histograms represent the expression of cardiac markers (A) cTnI and (B) Nkx2.5 expression in H7 at day 14 with isotype controls for IgG1 both (C) Nkx2.5 and (D) cTnI.


Percentage of cardiac cells from H9 hESC. The histograms represent the expression of (A) cTnI and (B) Nkx2.5 expression in H9 at day 14.


Immunostaining for cTnI at day 14. The H7 (A) and H9 (B) cells were imaged under immunofluorescently stained with cardiac troponin I (green) and DAPI (blue).


